Project 1 - Parsing NASA thermodynamic data
AIM:
To Write a function that extracts the 14 co-efficients and calculates the enthalpy, entropy and specific heats for all the species in the data file
EXPLANATION:
The THERMO.dat file where the global and local temperature are been given with the species they contain of about 53 species.From that file we have to find the
(1)Specific heat capacity
(2)Entrophy
(3)Enthalphy using
R-Universal gas constant
T-Temperature
Cp-Specific heat capacity
S-Entrophy
H-Enthalphy
SPECIFIC HEAT CAPACITY:
Specific Heat capacity is defined as the amount of heat required to raise the temperature kilogram of a substance by 1kelvin

ENTROPHY:
The Entrophy of an object is a measure of the amount of energy which is unavailable to do work.Entrophy is also a measure of the number of possible arrangements the atoms in a system can have.In the sense, entrophy is a measure of uncertainity or randomness.

ENTHALPHY:
Enthalpy is a concept used in science and engineering when heat and work need to be calculated. ... When a substance changes at constant pressure, enthalpy tells how much heat and work was added or removed from the substance. Enthalpy is similar to energy, but not the same

CODE WITH EXPLANATION:
MAIN:
clear all
close all
clc

f1=fopen('C:\Users\user\Documents\MATLAB\THERMO.dat','r')


fgetl(f1);

temp=fgetl(f1);


A=strsplit(temp,' ');


global_low_temp=(A{2});
global_mid_temp=(A{3});
global_high_temp=(A{4});


R=8.31;

for j=1:3
    fgetl(f1);
end
for i=1:53
    main=fgetl(f1);

    B=strsplit(main,' ');
    species=(B{1});


   local_low_temp=(B{end-3});
   local_low_temp=str2num(local_low_temp);

   local_med_temp=(B{end-1});
   local_med_temp=str2num(local_med_temp);

   local_high_temp=(B{end-2});
   local_high_temp=str2num(local_high_temp);


    line1=fgetl(f1);
    c=findstr(line1,'E');
    c1=line1(1:c(1)+3);
    c1=str2num(c1);
    c2=line1(c(1)+4:c(2)+3);
    c2=str2num(c2);
    c3=line1(c(2)+4:c(3)+3);
    c3=str2num(c3);
    c4=line1(c(3)+4:c(4)+3);
    c4=str2num(c4);
    c5=line1(c(4)+4:c(5)+3);
    c5=str2num(c5);


    line2=fgetl(f1);
    d=strfind(line2,'E');
    c6=line2(1:c(1)+3);
    c6=str2num(c6);
    c7=line2(c(1)+4:c(2)+3);
    c7=str2num(c7);
    c8=line2(c(2)+4:c(3)+3);
    c8=str2num(c8);
    c9=line2(c(3)+4:c(4)+3);
    c9=str2num(c9);
    c10=line2(c(4)+4:c(5)+3);
    c10=str2num(c10) ;


    line3=fgetl(f1);
    f=findstr(line3,'E');
    c11=line3(1:c(1)+3);
    c11=str2num(c11);
    c12=line3(c(1)+4:c(2)+3);
    c12=str2num(c12);
    c13=line3(c(2)+4:c(3)+3);
    c13=str2num(c13);
    c14=line3(c(3)+4:c(4)+3);
    c14=str2num(c14);


    T=linspace(local_low_temp,local_high_temp,500);


    for k=1:length(T)
    if T(k)>local_med_temp
        Cp(k)=(8.31)*(c1+(c2*(T(k)))+(c3*(T(k)^2))+(c4*(T(k)^3))+(c5*(T(k)^4)));
        H(k)=((8.31)*(T(k)))*(c1+(c2*(T(k))/2)+((c3*((T(k)^2))/3))+((c4*(T(k)^3))/4)+((c5*(T(k)^4))/5)+(c6/T(k)));
        S(k)=(8.31)*(c1*(log(T(k)))+(c2*(T(k)))+((c3*(T(k)^2))/2)+((c4*(T(k)^3))/3)+((c5*(T(k)^4))/4)+c7);
    else
        Cp(k)=(8.31)*(c8+(c9*(T(k)))+(c10*(T(k)^2))+(c11*(T(k)^3))+(c12*(T(k)^4)));
        H(k)=((8.31)*(T(k)))*((c8+c9*(T(k))/2)+((c10*((T(k)^2))/3))+((c11*(T(k)^3))/4)+((c12*(T(k)^4))/5)+(c13/T(k)));
        S(k)=(8.31)*(c8*(log(T(k)))+(c9*(T(k)))+((c10*(T(k)^2))/2)+((c11*(T(k)^3))/3)+((c12*(T(k)^4))/4)+c14);
    end
end

   w=molecular_weight(species);

   mw_file=fopen('molecular_weight.txt','w');
   fprintf(mw_file,'molecular weight of %s id %d',species,w);
   fclose(mw_file);

   cd('C:\Users\user\Documents\MATLAB')
   mkdir(species);
   cd(species);


figure(1)
plot(T,Cp,'linewidth',3,'color','r')
xlabel('Temperature')
ylabel('Specific heat')
title(sprintf('specific heat vs Temperature of %s',species));
saveas(figure(1),'specific heat.jpg')

figure(2)
plot(T,S,'linewidth',3,'color','b')
xlabel('Temperature')
ylabel('Entrophy')
title(sprintf('Entrophy vs Temperature of %s',species));
saveas(figure(2),'Entrophy.jpg')

figure(3)
plot(T,H,'linewidth',3,'color','g')
xlabel('Temperature')
ylabel('Enthalpy')
title(sprintf('Enthalpy vs Temperature of %s',species));
saveas(figure(3),'Enthalpy.jpg')

cd('C:\Users\user\Documents\MATLAB')

w=molecular_weight(species)


end
FUNCTION:
function w=molecular_weight(species)

atomic_name=['H','C','O','N','Ar'];

atomic_weight=[1.008 12.011 15.999 14.007 39.948];

w=0;

for i=1:length(species)
    for j=1:length(atomic_name)
        if strcmp(species(i),atomic_name(j))
            w=w+atomic_weight(j);
            position=j;
        end
    end
    n=str2num(species);

    if n>1
        w=w+atomic_weight(position)*(n-1);
    end


end
fprintf('molecular_weight of %s ',species);
fprintf('%f',w)
disp(' ')
end
The THERMO.dat file is named as f1 and opened by fopen command,fgetl file to get the first line of the dat file.
The next line contains the global temperature so that fgetl command is been used to get them and separate them using the strsplit command.
The Gas constant is been given as R
Skipping the next three lines using a for loop which has the command of fgetl
The next lines contains a main line and the next lines contains the co-efficient values, so that a for loop is been created for the 53 species which has the first line and the first one has the name of the species,so that it been noted as the main.
Splitting the main line using strsplit by the space present between them,then the first value is been noted as species name for all the 53 lines.
The local temperature values are all been given from the last end, so that the values are been taken from the end using the command (end-1) for each temperature the value is been taken from the backside of the main line.
All the temperature are been converted from string because strsplit command is been used to split them in strong basis so that str2num command is been used to change them into numbers.
The next line is been taken as the line 1,the next and line 2 and the next as line 3 which have 5,5,4 co-efficients respectively.
Each line are taken by separating them by the value of three numbers after exponential(E),and they are converted into numbers using str2num command.
T is the temperature which is ranging from low local temperature to the high local temperature with 500 values in them.
A for loop is been made a k value with the length of temperature.
If the temperature value is been greater than medium local temperature then the first seven co-efficients are all been calculated else the second seven values are been calculated.
The Cp, H and S value moves the temperature andgas constant to the opposite side to calculated them.
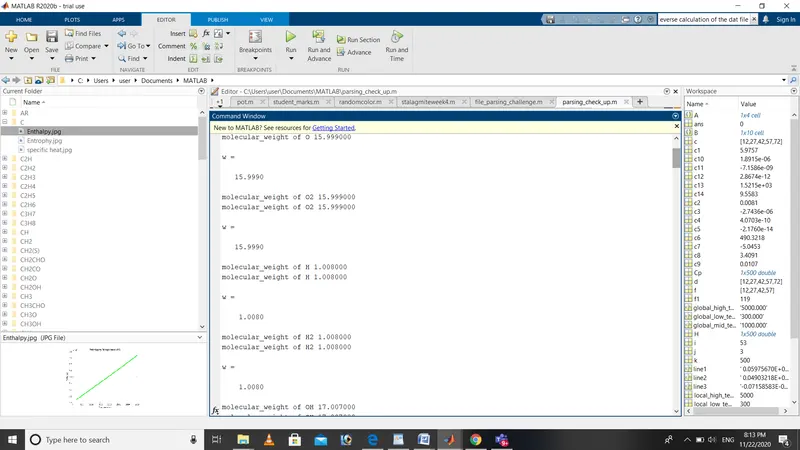
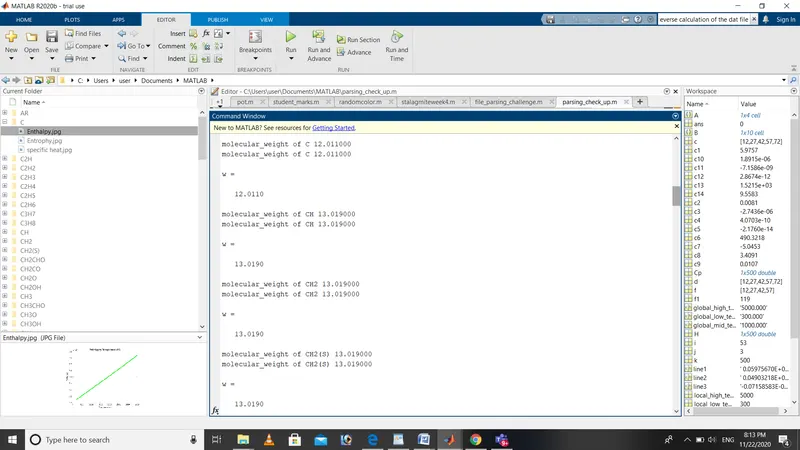
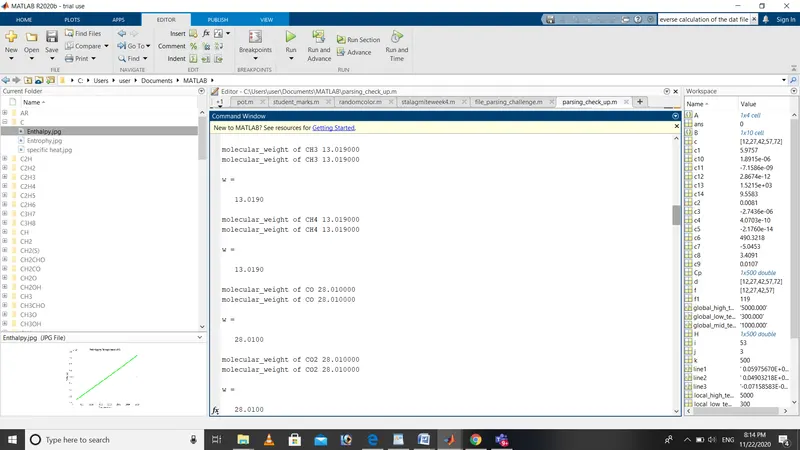
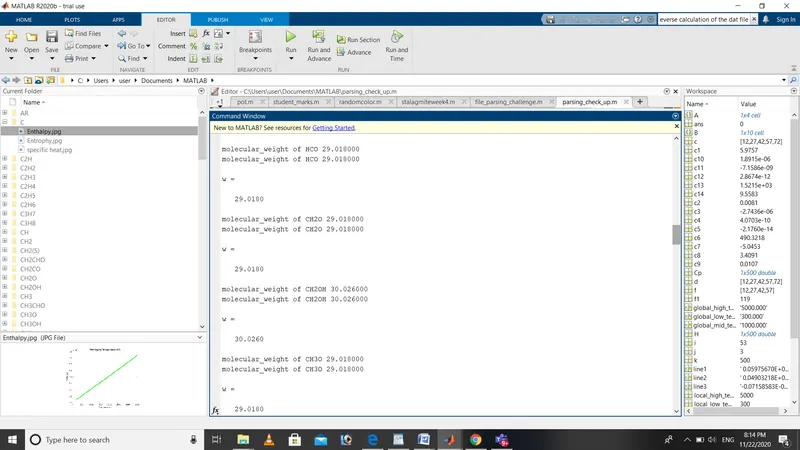
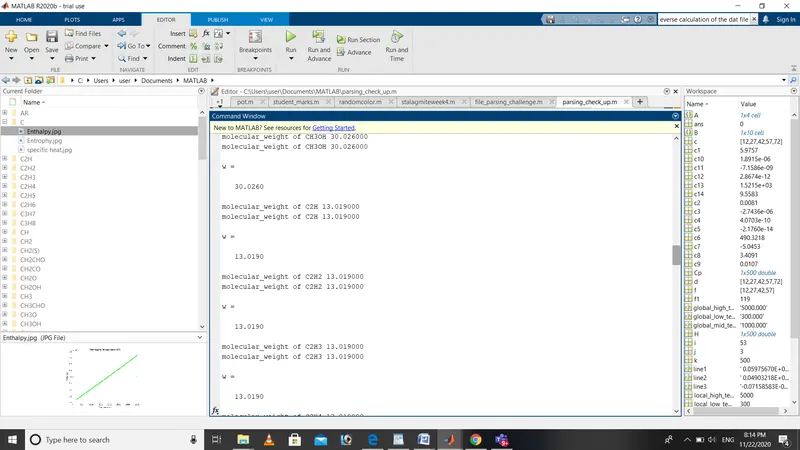
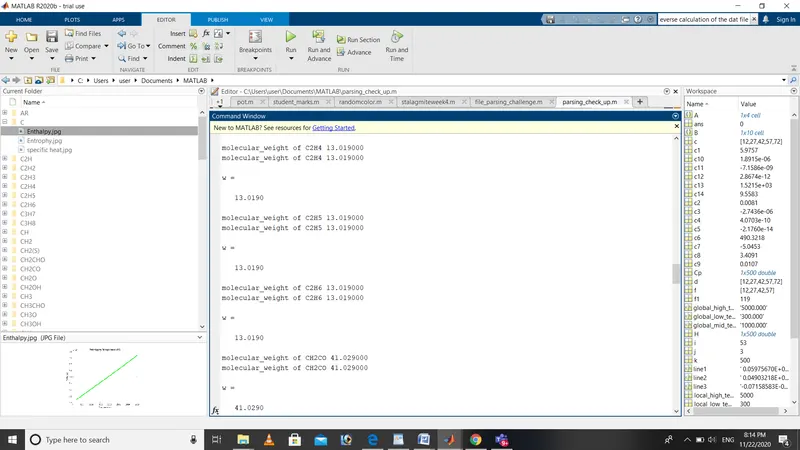
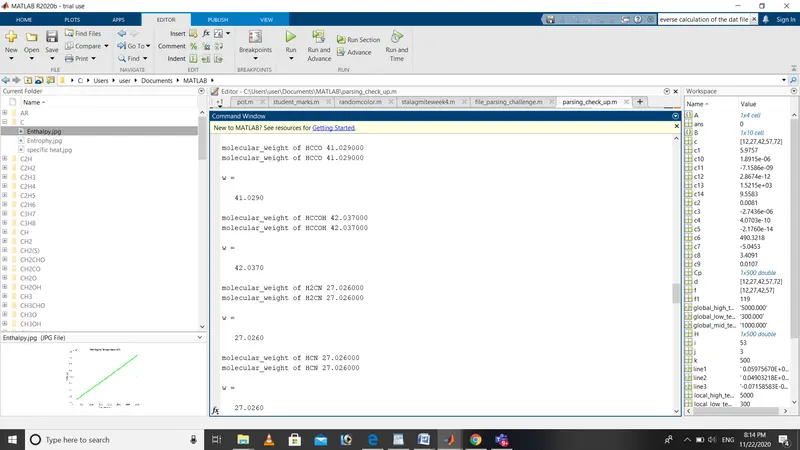
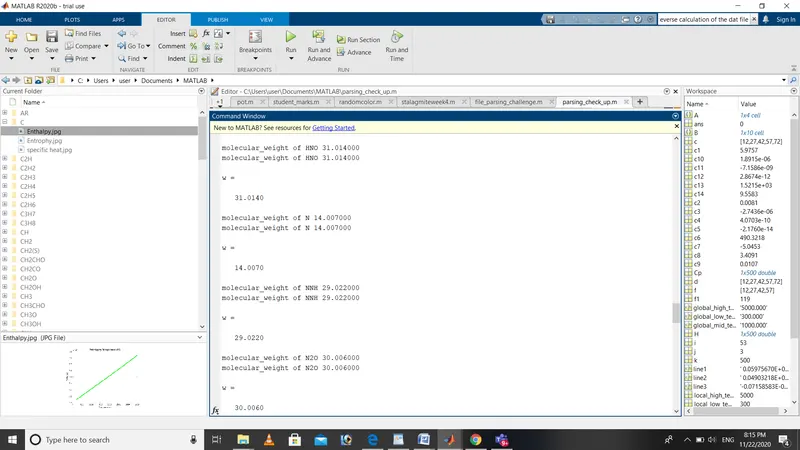
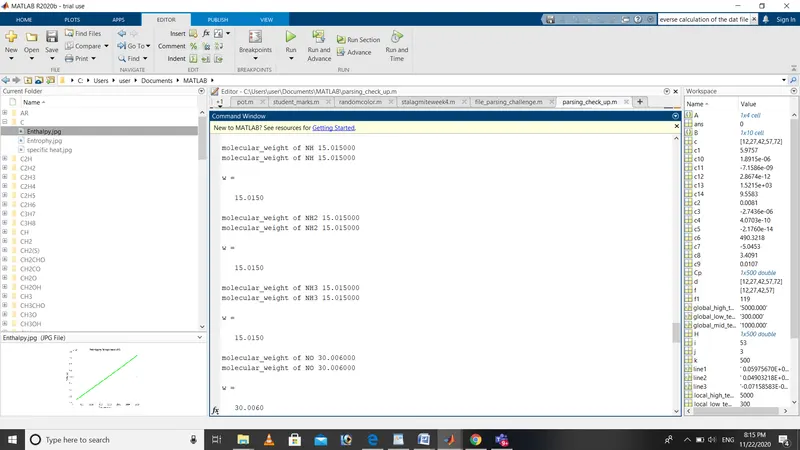
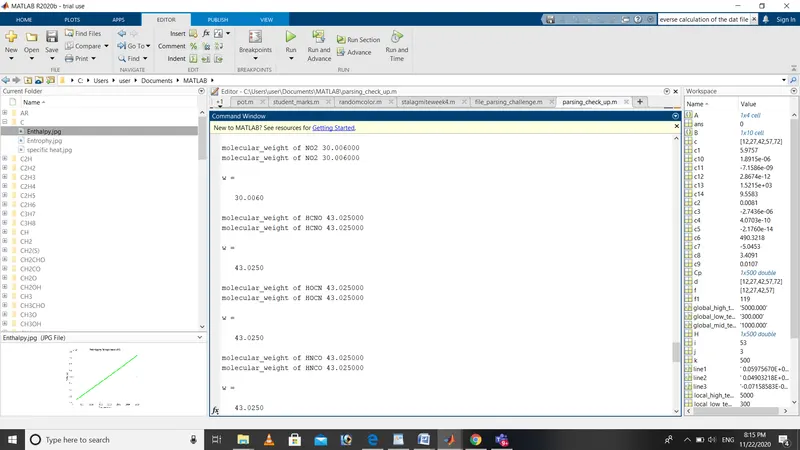
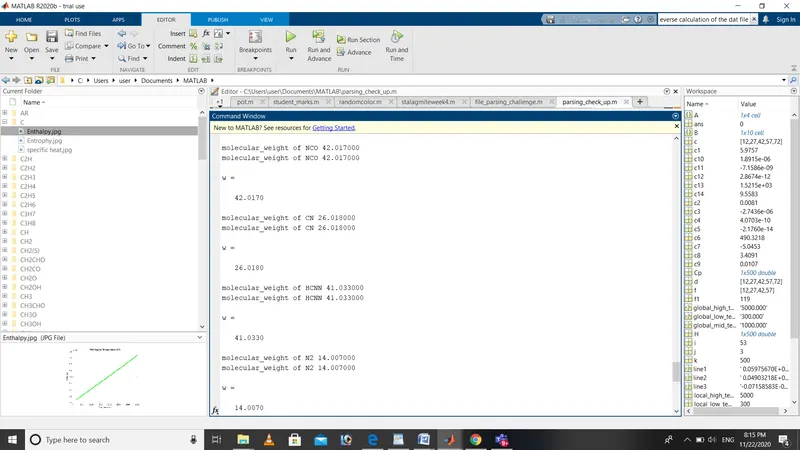
The molecular weight is been calculated through the seperate function with the atomic weight of the species.
wm file is been opened ,printed and closed using fopen,fprintf and fclose commands respectively and thier path is been changed usind cd command(change directory)
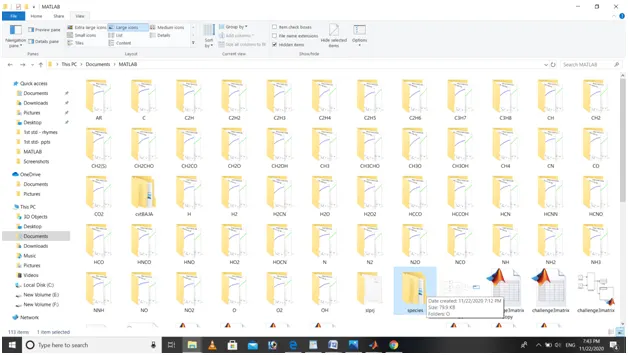
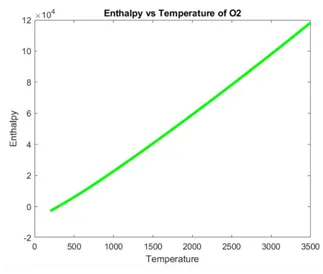
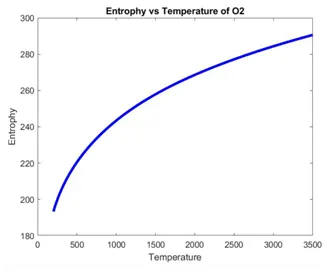
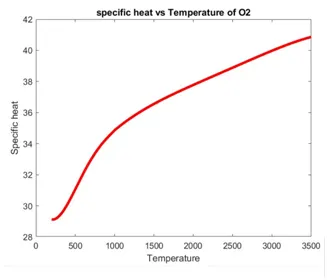
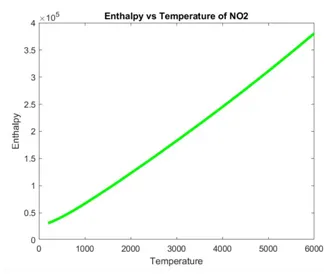
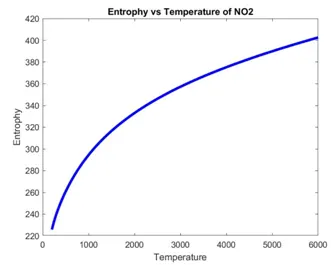
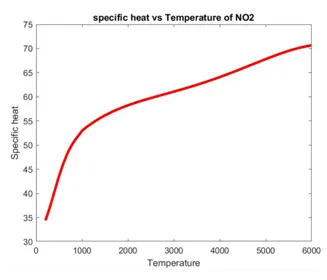
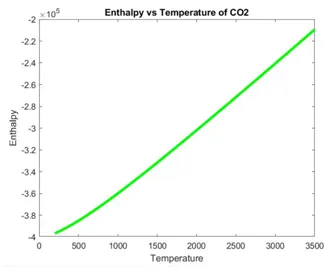
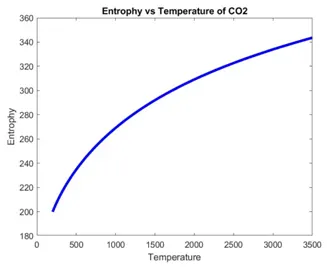
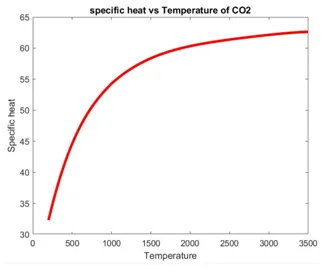
The plotting of all the species's specific heat, enthalpy and entrophy with the temperature and saved as image in a seperate folder for each of them.
ERRORS:
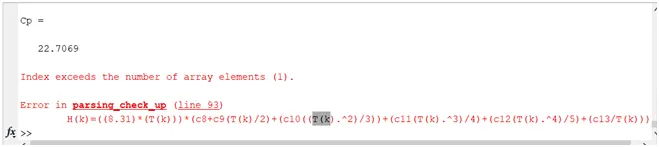
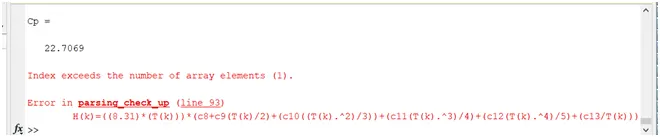
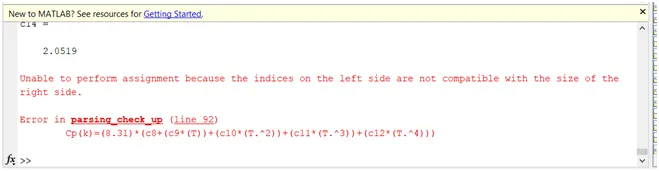
The needed operators and the brackets are all not given properly so that the error are all been occurred.
FOLDER LOCATION:
PLOTTINGS:
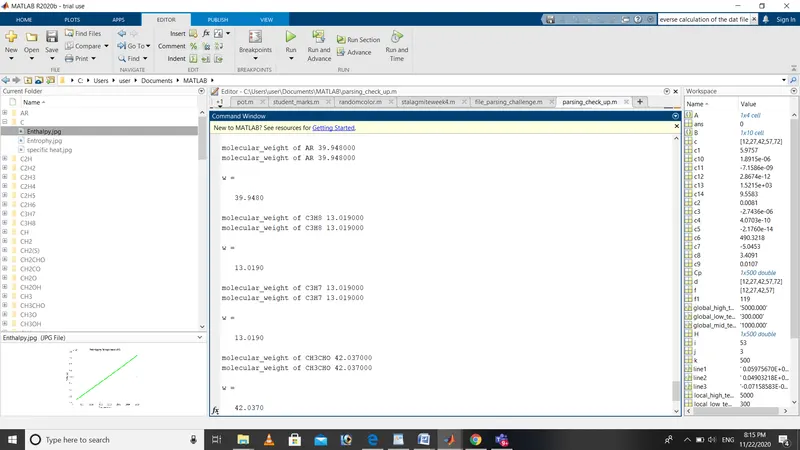
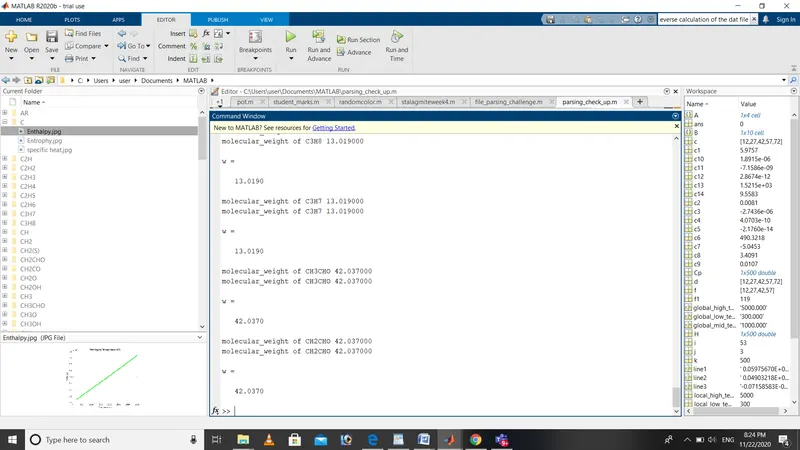
MOLECULAR WEIGHT OF EACH SPECIES:
RESULT:
Thus the 14 co-efficients is been extracted and enthalpy,entrophy and the specific heat is been found and plotted for O2,CO2 and NO2.