Week 5 Battery characteristics using drive cycle
Below is the simulink model of lithium ion batttery for analysing charge discharge characteristic using UDDS data
Here in this model we will be seeing how the speed of vehicle or the output load affects the SOC%, current and voltage.
A signal builder block is connected to controlled current source which is connected to the battery and then a bus collector is connected to the battery for getting SOC, voltage and current as output to plot it with the help of scope
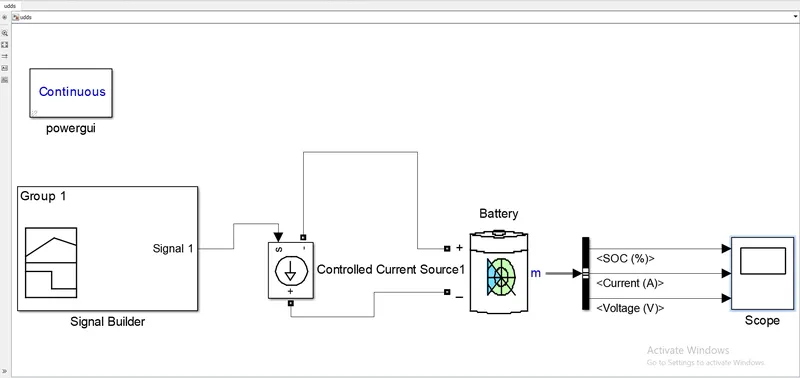
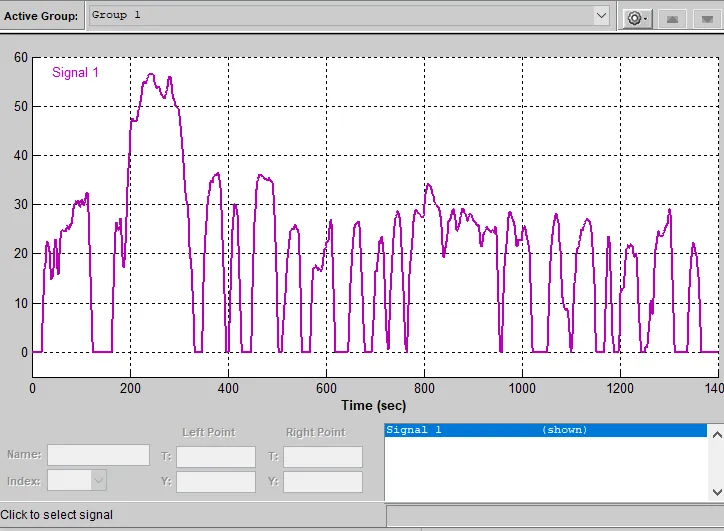
UDDS means urban dynamometer driving schedule which is a drive cycle of speed vs time it is taken as reference input for a vehicle to track the output.
So here in this simulink model we have imported UDDS data in signal builder block, by entering values of time and speed in array in commond window
Below is the time vs speed waveform which we got through UDDS data.
so for the above driving cycle pattern we have plot waveform for SOC, current and voltage
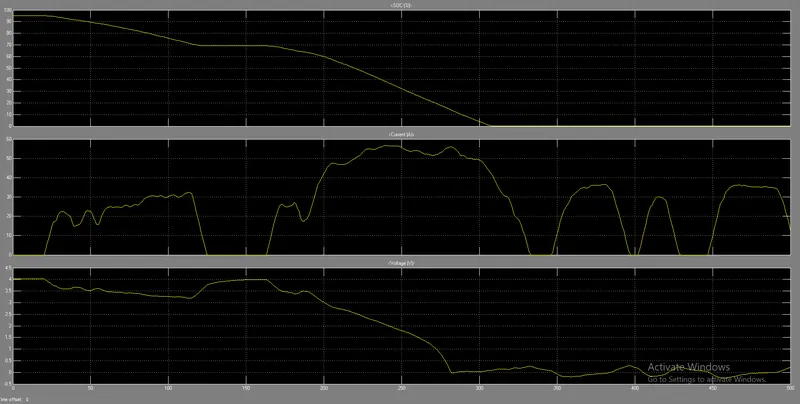
Here i have taken a lithium ion battery with nominal voltage of 3.7V , rated capacity as 2.6AH and SOC as 95%
We can see that when the vehicle is accelerated then the discharge current increases and the SOC of the battery reduces gradually, between 125sec to 165sec when the vehicle is at zero speed SOC remains constant, the battery reaches its 0% SOC at 310sec and the voltage reaches to 0 volt.
Also by looking at the voltage waveform we can see that somewhere around 115sec to 125sec we can see increase in voltage which is due regenerative braking.