Week 4- Rolling operation
Stress Concentration on Rolling Operation
OBJECTIVES:
To carry out a Static Structural Analysis on a rolling of sheet for the given materials for the workpiece and determine the stress, deformation, and Plastic strain.
MATERIAL:
Static Structural Analysis was carried out with the given model. The material used for this analysis was COPPER ALLOY NL and the analysis was carried out using ANSYS Mechanical Enterprise. The model for case-1 was imported to ANSYS Workbench software and is shown in the figure below.
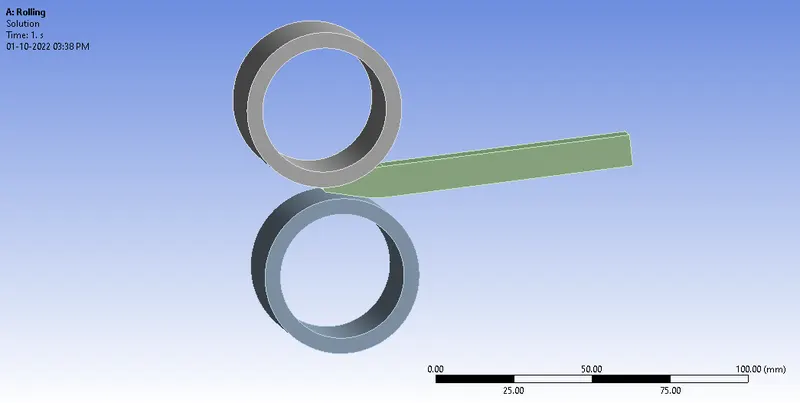
Fig.1 Rolling Setup
Later the material was assigned and the material and its properties used for this analysis are specified below. For Wheel, STRUCTURAL STEEL was used.
|
Material |
Copper Alloy NL |
Structural Steel |
|
Density |
6.999e-6 kg/mm3 |
7.85e-6 kg/mm3 |
|
Young’s Modulus |
1.1e+5 MPa |
2e+5 MPa |
|
Thermal Conductivity |
0.06 W/mm°C |
0.0605 W/mm°C |
|
Specific Heat |
3.85e+5 mJ/kg°C |
4.34e+5 mJ/kg°C |
|
Tensile Yield Strength |
79.81 MPa |
250 MPa |
|
Tensile Ultimate Strength |
141.4 MPa |
460 MPa |
|
Components |
Workpiece |
Wheels |
MESHING:
Meshing is done by setting a method using Hexahedrons elements. A Body sizing of 4mm is set to workpiece and wheels were meshed with default mesh size.
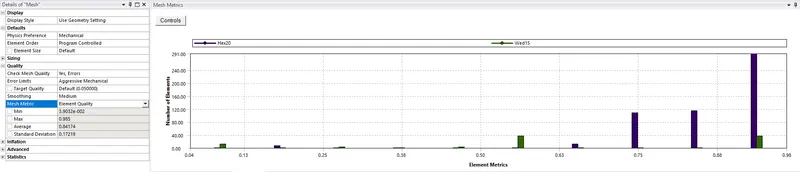
Fig.2 Element Quality
A mesh metric that identifies elements according to their quality was employed and it can be seen that the elements of the lowest quality are minimal. Most of the elements have very high quality in the range of 0.88 to 1. Hence, the mesh is of acceptable quality. The meshed model is shown below.
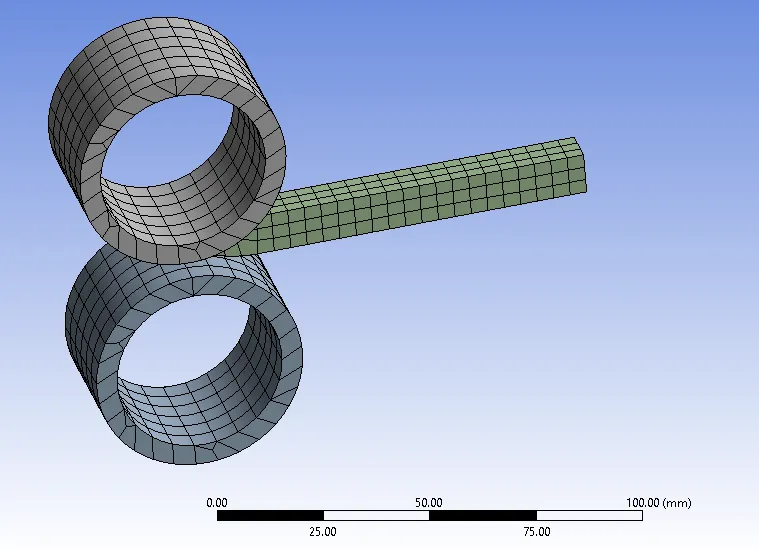
Fig.3 Meshed Model
CONTACT:
The contacts between the wheels and the workpiece are specified with a FRICTIONAL type connection. Two contacts are set : a) Wheel1 (target) ,workpiece (contact) ; b) Wheel2 (target), workpiece (contact). Both contacts have the following data set.
- Friction value of 0.2
- Augmented Lagrange
- Normal Stiffness factor of 0.1
- Update stiffness by each iteration
- Interface treatment of add offset and ramped effect
Then TWO CYLINDRICAL JOINTS were provided to the inner face of each wheel with the following data
- Connection Type of Body-Ground
- Cylindrical Type
ANALYSIS SETTING:
14 STEPS ARE USED.
For all 14 steps:
- Auto Time Stepping: Program Controlled
- Solver Type: Program Controlled
- Weak Spring: Program Controlled
- Large deflection: ON
- Stabilization: Constant
- Energy Dissipation factor: 0.1
BOUNDARY CONDITIONS AND LOAD:
The DISPLACEMENT was provided to the workpiece to move in the negative Y direction and CYLINDRICAL JOINT on both wheels with the ROTATION increasing in order of 15 degrees from 0 to 195 degrees. Both wheels rotate in opposite directions.
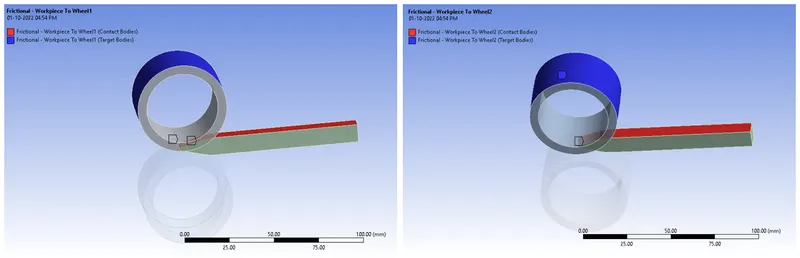
Fig.4 Frictional Contact
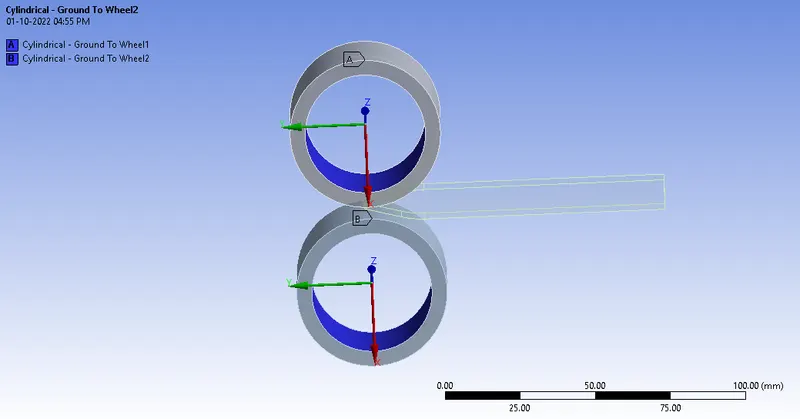
Fig.5 Cylindrical Joint
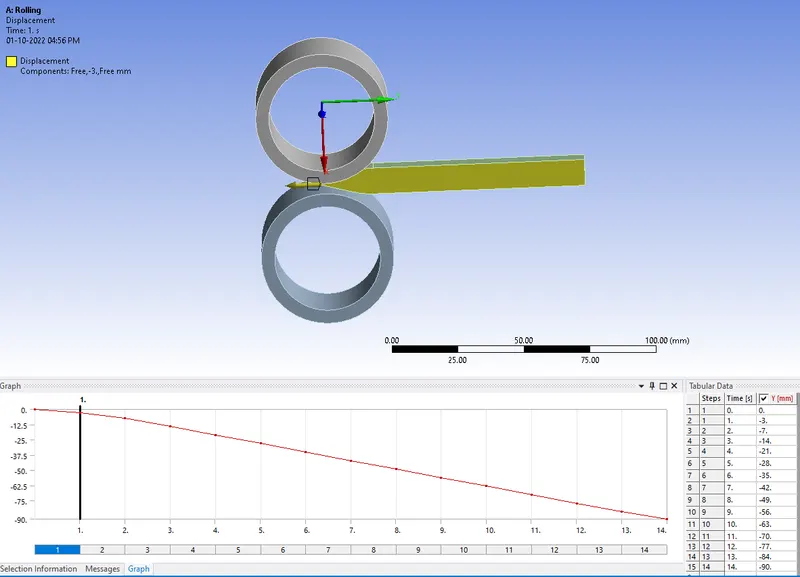
Fig.6 Displacement
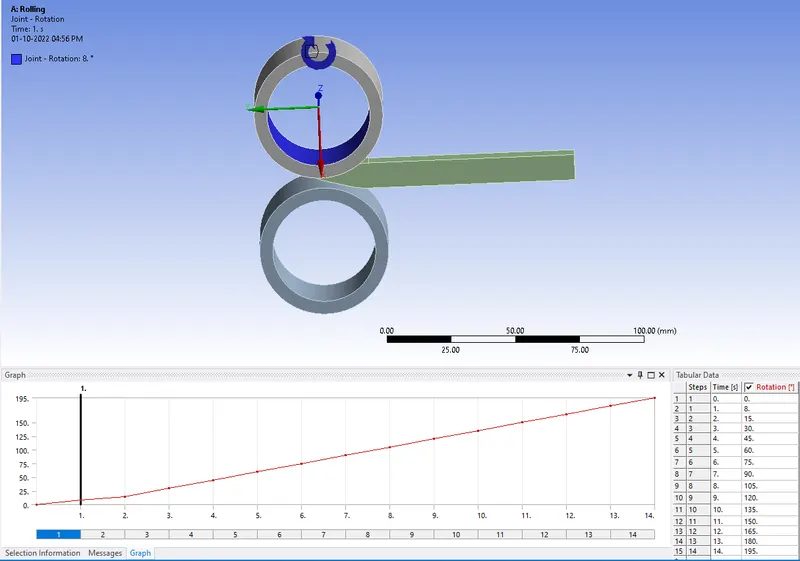
Fig.7 Cylindrical Joint-1
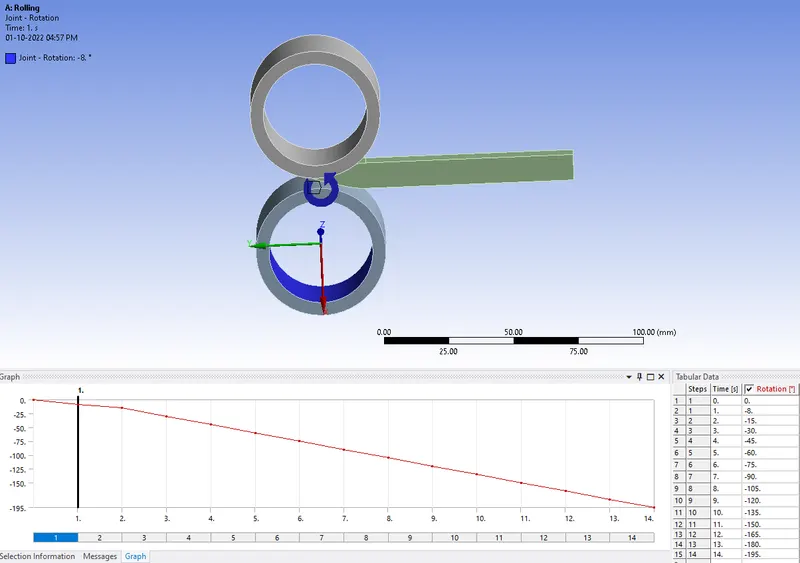
Fig.8 Cylindrical Joint-2
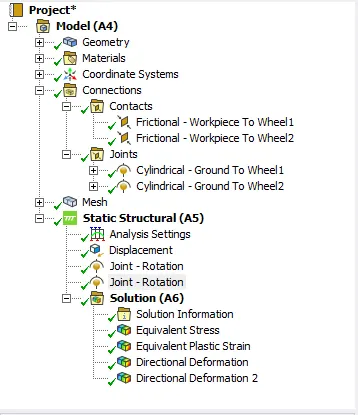
Fig.9 Case Setup
RESULTS:
The simulation was run and the results are tabulated below.
|
Output |
Maximum |
Minimum |
|
Equivalent Stress (setup) [MPa] |
2312.9 |
2.3678e-3 |
|
Equivalent Plastic Strain (workpiece) [mm/mm] |
1.3139 |
1.379e-3 |
|
Directional Deformation (workpiece) Z-axis [mm] |
5.3961 |
-5.7156 |
|
Directional Deformation (workpiece) Y-axis [mm] |
-90 |
-90.115 |
The Directional Deformation of the workpiece in the Z-axis obtained from the analysis is shown below.
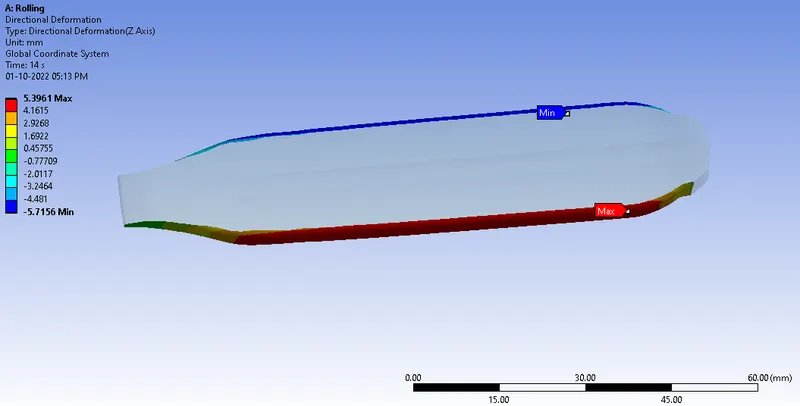
Fig.10 Directional Deformation in Z-axis Contour Plot
The Directional Deformation of the workpiece in the Y-axis obtained from the analysis is shown below.
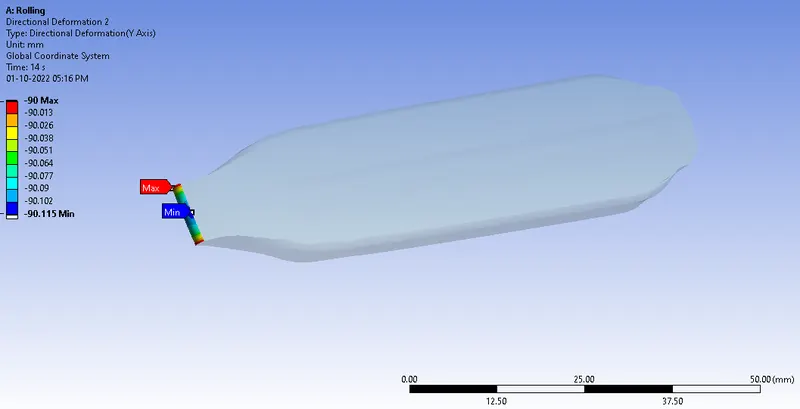
Fig.11 Directional Deformation in Y-axis Contour Plot
The Equivalent (Von-Mises) Stress of the workpiece obtained from the analysis is shown below.
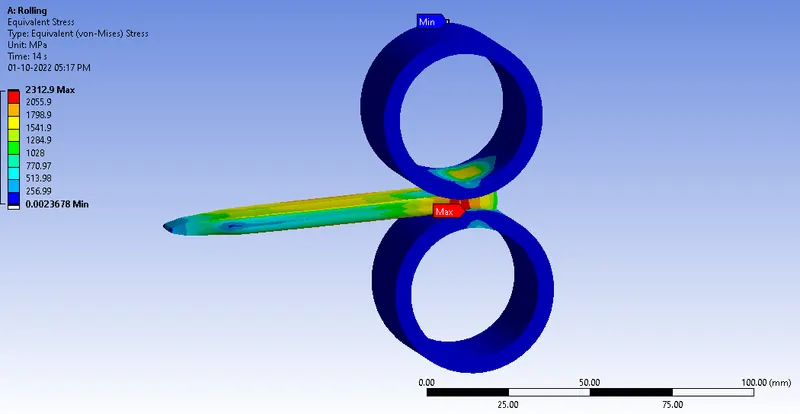
Fig.12 Equivalent Stress Contour Plot
The Equivalent Plastic Strain of the workpiece obtained from the analysis is shown below
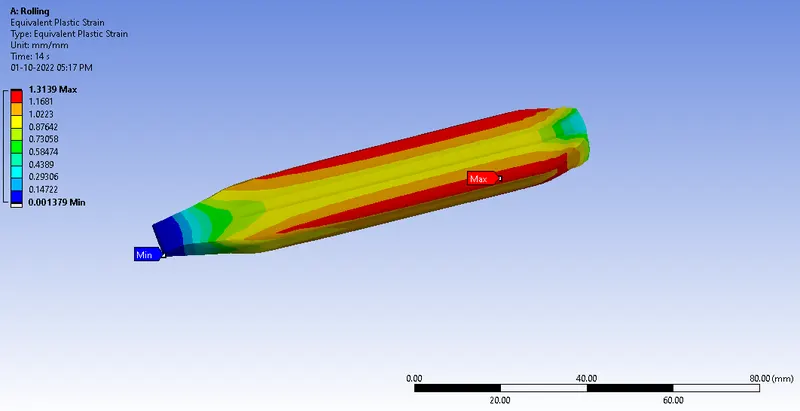
Fig. 13 Equivalent Plastic Strain Contour Plot
The Directional Deformation in the Z-axis graph/table plot is shown below.
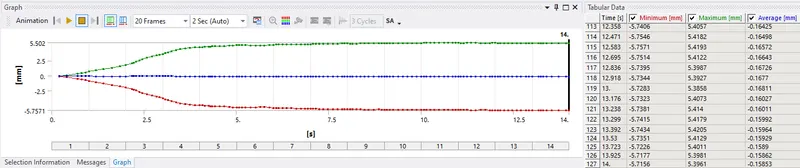
Fig.14 Directional Deformation in the Z-axis Table Plot
The Directional Deformation in the Y-axis graph/table plot is shown below.
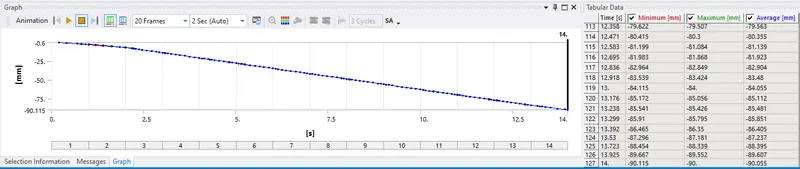
Fig.15 Directional Deformation in the Y-axis Table Plot
The Equivalent (Von-Mises) Stress graph plot is shown below.
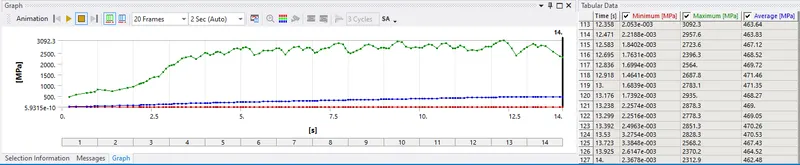
Fig.16 Equivalent Stress Table Plot
The Equivalent Elastic Strain graph plot is shown below
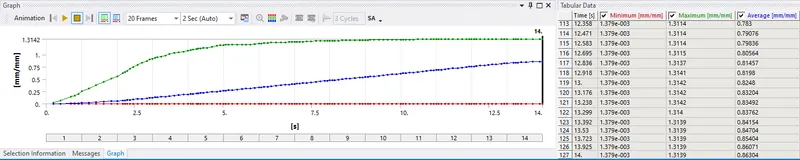
Fig. 17 Equivalent Elastic Strain Table Plot
CONCLUSION:
The analysis was run successfully for all three cases and results were obtained and tabulated.
- The Maximum Stress of the set-up was 3029.3 MPa and
- The Maximum Plastic Strain of the workpiece was 1.3142 mm/mm.
- The Maximum Directional Deformation in Z- the axis was 5.502mm.
- The Maximum Directional Deformation in Y- the axis was -90 mm. Figure 11 proves that the workpiece has been displaced by 90mm.