Genetic Algorithm
- Write a code in MATLAB to optimise the stalagmite function and find the global maxima of the function.
- Code
clear all, close all, clc

x = linspace(0,0.6,150);
y = linspace(0,0.6,150);
num_cases = 50;
[xx yy] = meshgrid(x,y);

for i = 1:length(xx)
    for j = 1:length(yy)
        input_vector(1) = xx(i, j);
        input_vector(2) = yy(i,j);
        f(i,j) = get_stalagmite(input_vector);
    end
end

%f = get_stalagmite(x,y);


%Study 1 - Statistical Behavior
tic
for i = 1:num_cases
    [inputs, fopt(i)] = ga(@get_stalagmite,2);
    xopt(i) = inputs(1);
    yopt(i) = inputs(1);
end
study1_time = toc
figure(1)
subplot(2,1,1)
hold on
surfc(x,y,f)
shading interp
plot3(xopt, yopt, fopt, 'marker', 'o', 'markersize', 5, 'markerfacecolor', 'r')
title('Unbounded inputs')
subplot(2,1,2)
plot(fopt)
xlabel('Iterations')
ylabel('Function minimum')


%Study 2 -  Statistical behavior-with upper and lower bound
tic
for i = 1:num_cases
    [inputs, fopt(i)] = ga(@get_stalagmite,2,[],[],[],[],[0;0],[0.6;0.6]);
    xopt(i) = inputs(1);
    yopt(i) = inputs(2);
end
study2_time = toc
figure(2)
subplot(2,1,1)
hold on
surfc(x,y,f)
shading interp
plot3(xopt, yopt, fopt, 'marker', 'o', 'markersize', 5, 'markerfacecolor', 'r')
title('Bounded inputs')
subplot(2,1,2)
plot(fopt)
xlabel('Iterations')
ylabel('Function minimum')


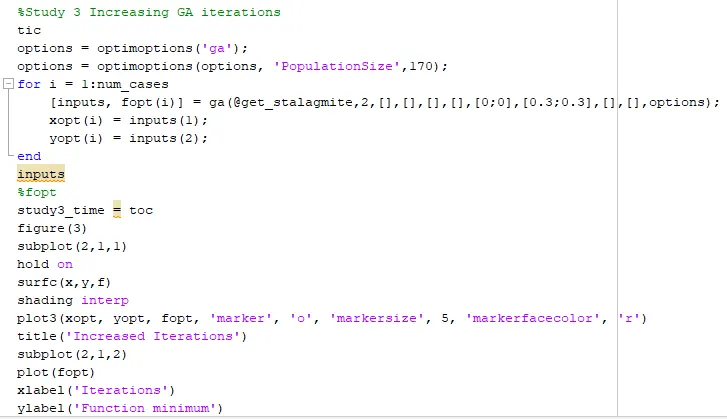
%Study 3 Increasing GA iterations
tic
options = optimoptions('ga');
options = optimoptions(options, 'PopulationSize',170);
for i = 1:num_cases
    [inputs, fopt(i)] = ga(@get_stalagmite,2,[],[],[],[],[0;0],[0.3;0.3],[],[],options);
    xopt(i) = inputs(1);
    yopt(i) = inputs(2);
end
inputs
%fopt
study3_time = toc
figure(3)
subplot(2,1,1)
hold on
surfc(x,y,f)
shading interp
plot3(xopt, yopt, fopt, 'marker', 'o', 'markersize', 5, 'markerfacecolor', 'r')
title('Increased Iterations')
subplot(2,1,2)
plot(fopt)
xlabel('Iterations')
ylabel('Function minimum')- Outputs
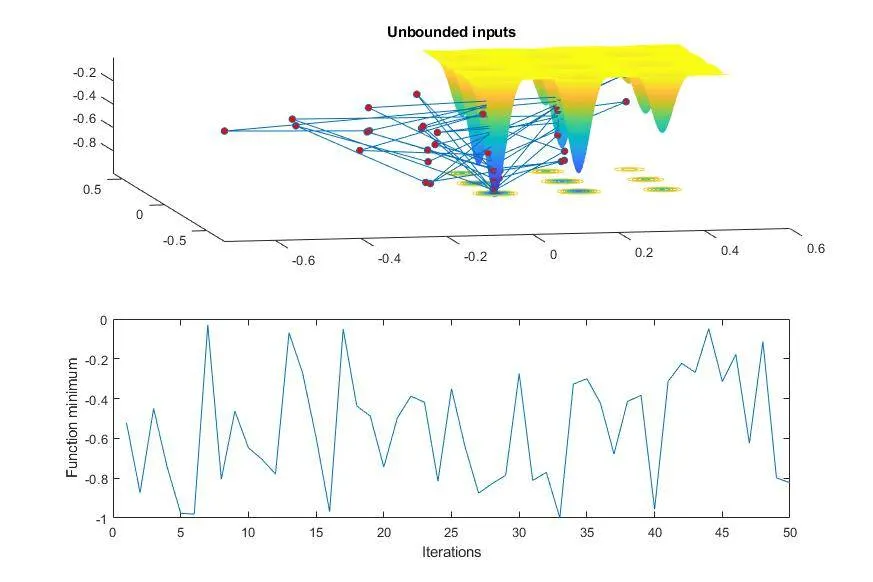
i. Study 1
ii. Study 2
iii. Study 3
- Explanation
i. Inputs
The input for the above study is as follows and are passed to a different function to find the data set for Genetic Algorithm evaluation.
INPUTS - 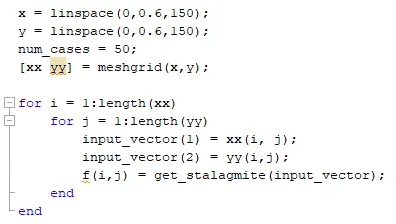
STALAGMITE DATA CREATION FUNCTION - 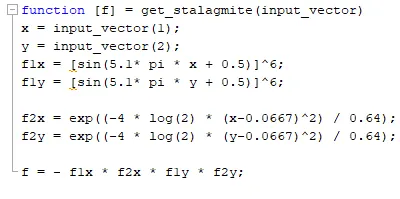
-ve sign is used in the formula for f, since the stalagmite function is used and gives minima of a data set. Using the negative sign will help in locating the maximum value from the data set.
ii. Study 1
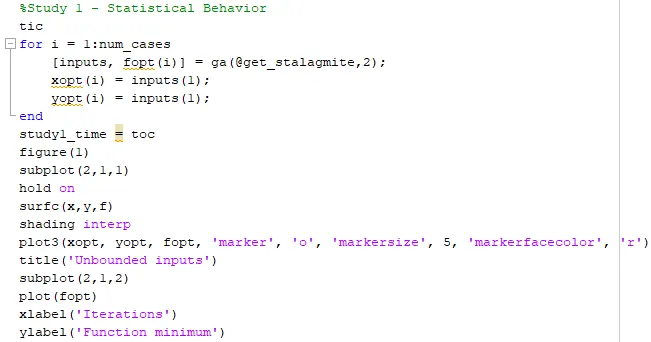
Output of this study shows the various results that the ga function gives. But since the range for the results and inputs are not specified the results get out of the range of the inputs
The output varies between- -1 to 0.
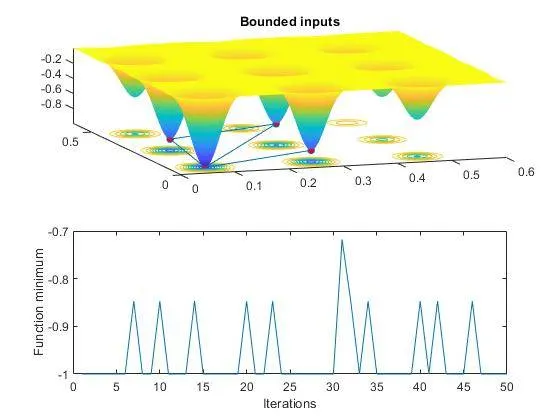
iii. Study 2
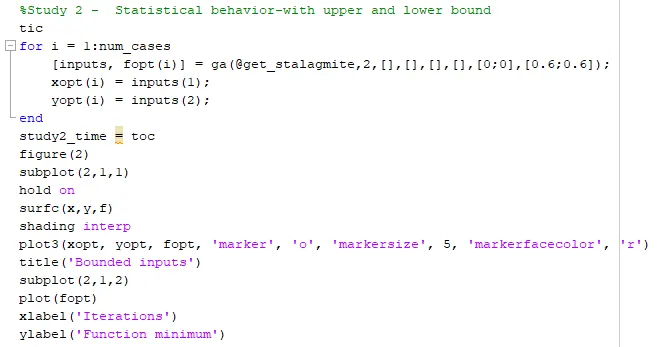
Further to reduce the range of the results so as to get the output between the inputs extremities of x and y, we use the ga function as - ga(@get_stalagmite,2,[],[],[],[],[0;0],[0.6;0.6]);.
Where in the terms - [0;0],[0.6;0.6], define the range of input for output evaluation.
Here, too, we get multiple results, but within the confines of the input range.
Here the output varies between- -1 to -0.7, which is better than Study 1.
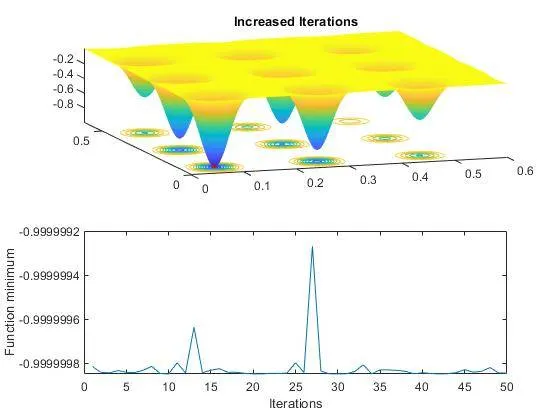
iv. Study 4
Here getting the results from Study 3, the range of the input for evaluation is further reduced to- [0;0],[0.3;0.3].
And to increase the number of the population size we use the options.
Here we can see the output variations differs between very small range - -1 to -0.9999992, the results are better than the Study 2.