Parsing NASA thermodynamic data
OBJECTIVES:
1. Write a function that extracts the 14 co-efficients and calculates the enthalpy, entropy and specific heats for all the species in the data file. You will be reading this file NASA thermodynamic data. The formulae are shown below.
`(Cp)/R = a1 + a2.T + a3.T^2 + a4.T^3 + a5.T^4`
`(H)/(RT) = a1 + a2.T/2 + a3.T^2/3 + a4.T^3/4 + a5.T^4/5 + a6/T`
`S/R = a1.lnT + a2.T + a3.T^2/2 + a4.T^3/3 + a5.T^4/4 + a7`
2. Calculate the molecular weight of each species and display it in the command window.
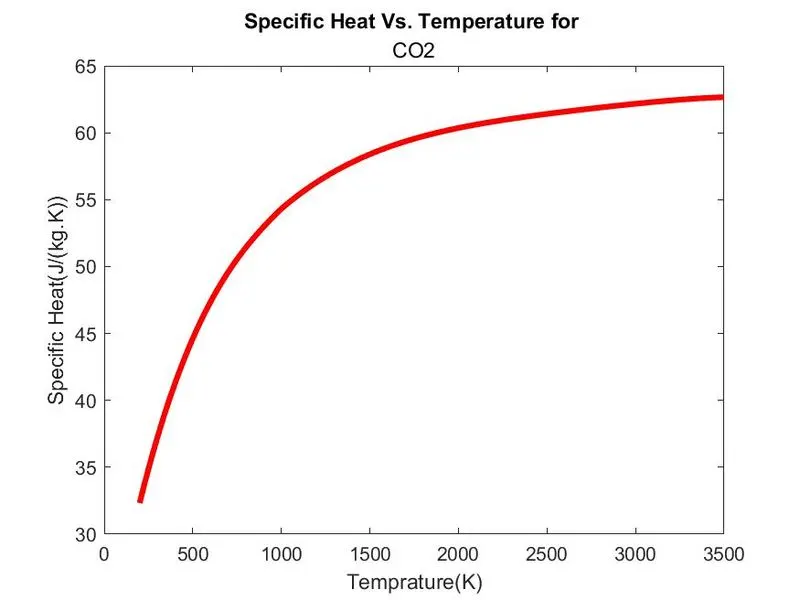
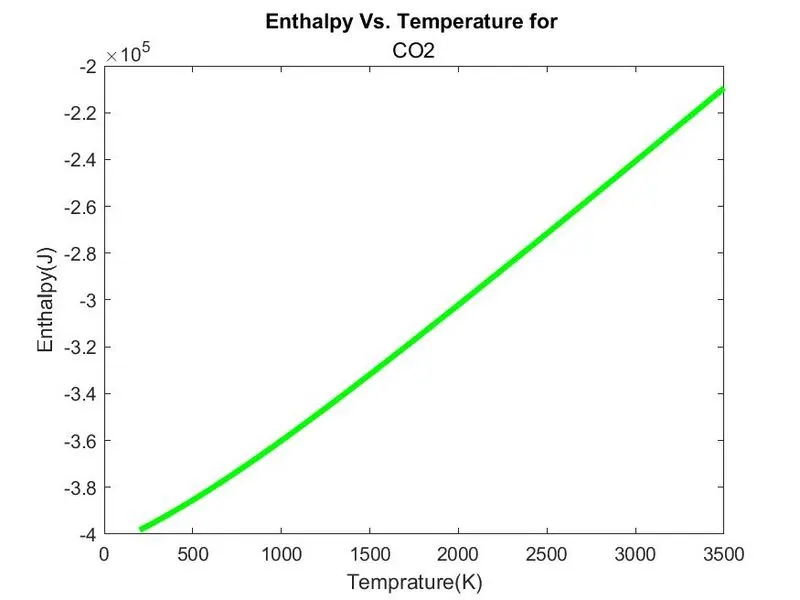
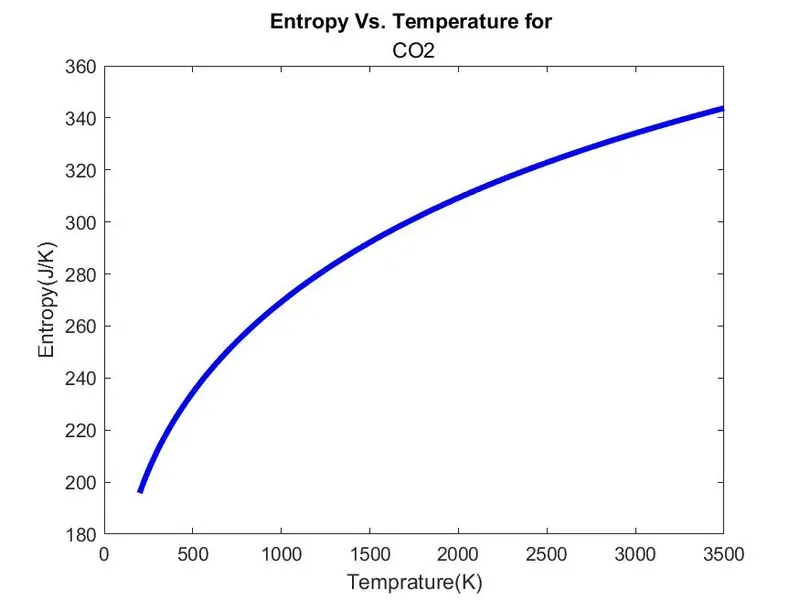
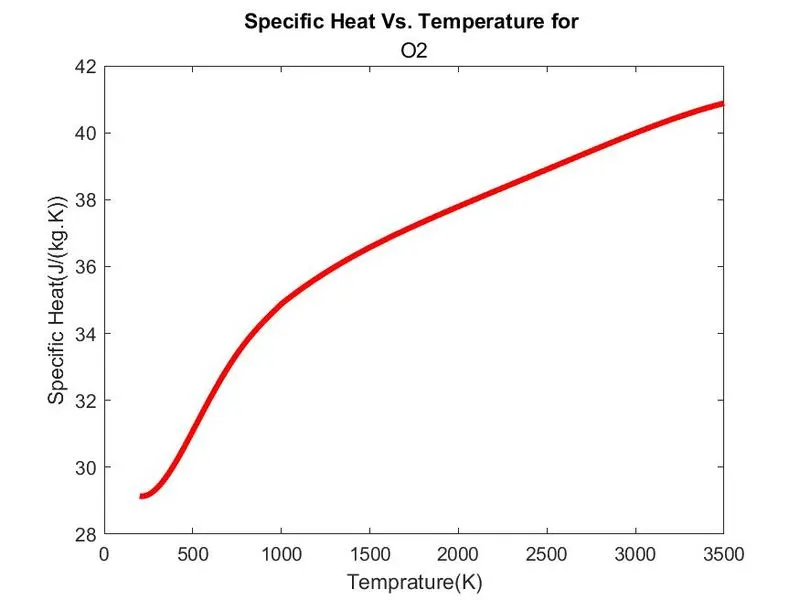
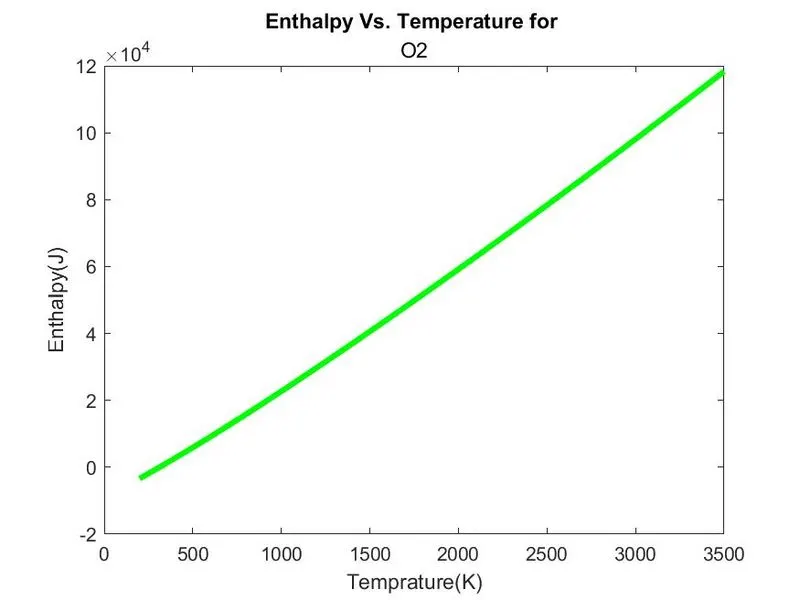
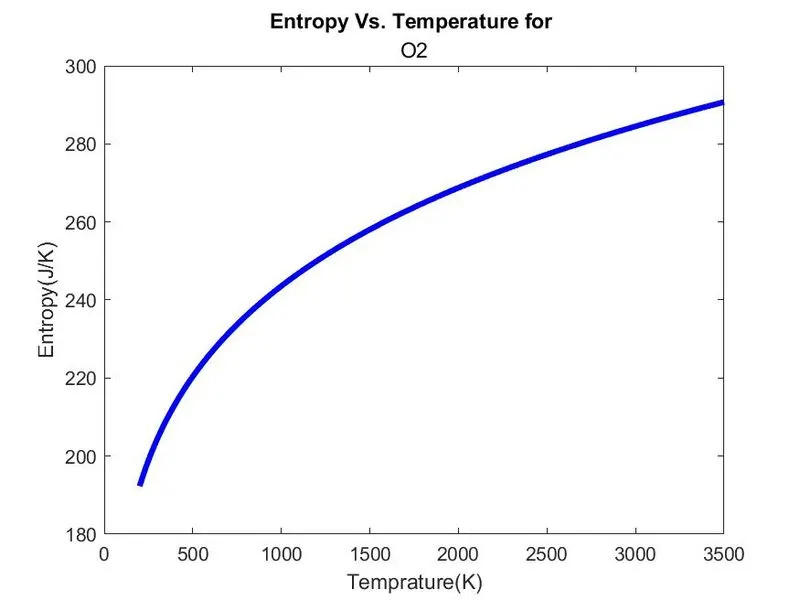
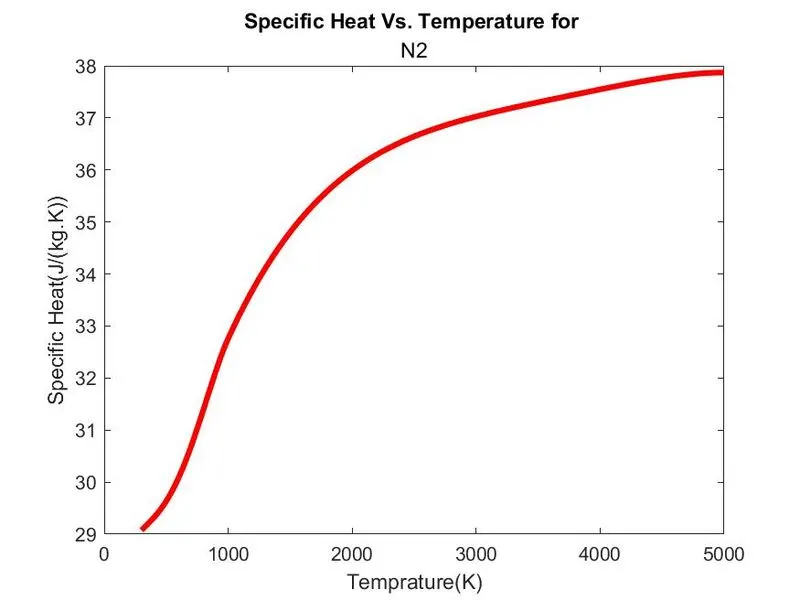
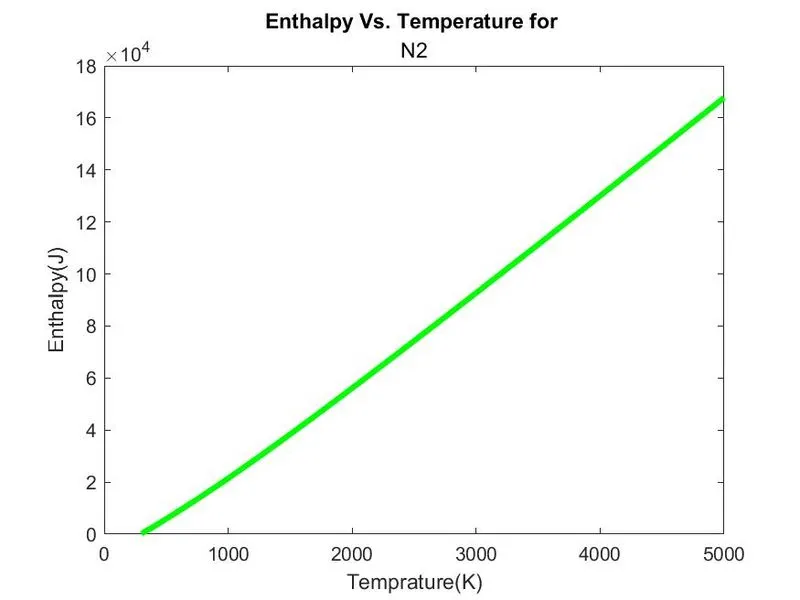
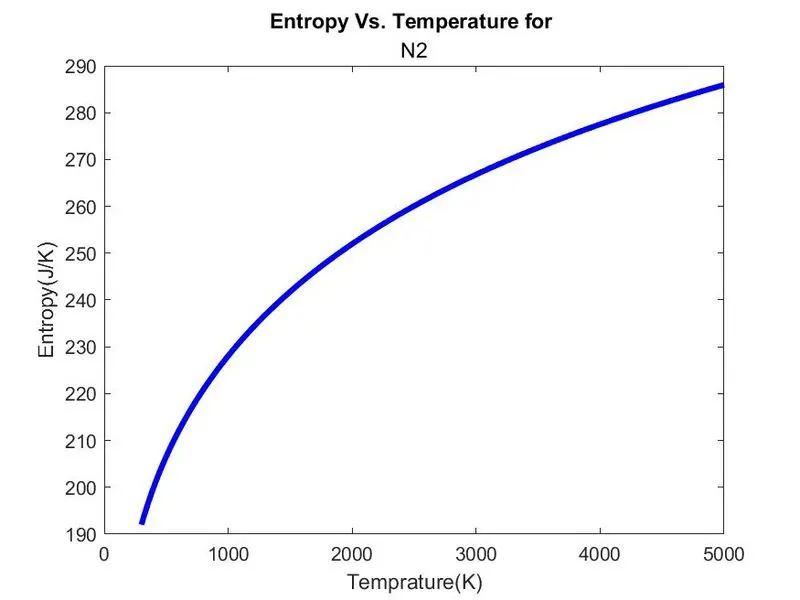
3. Plot the Cp, Enthalpy and Entropy for the local temperature range (low temperature : high temperature) specific for each species.
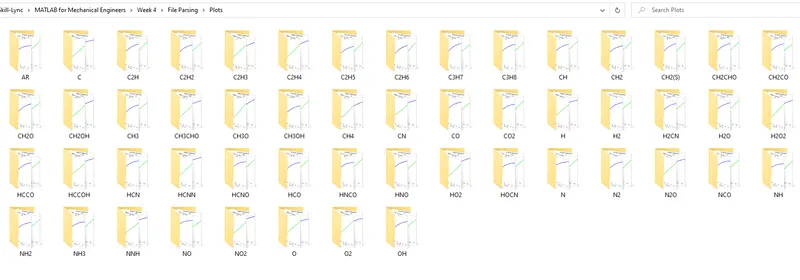
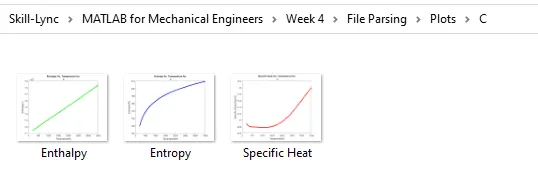
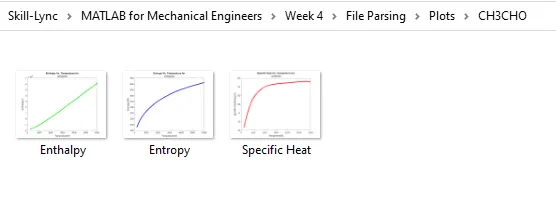
4. Save the plots as images with appropriate names and dump them in separate folders for each species with suitable name. All these should be generated automatically.
CODE:
1. First we need to find the number of species given in the input data. Below is the code for finding number of species: 53
g1 = fopen('THERMO.dat','r');         % Reading THERMO.dat file
no_of_species = 0;
while ~feof(g1)                       % Finding number of lines
    data = fgetl(g1);
    if data=="END"
        break
    end
    no_of_species = no_of_species+1;
end
no_of_species = (no_of_species-5)/4   % Total number species
2. Assigning f1 to THEROM.dat to read and utilize data in the code.
- Reading header, Global Temperatures and Comments.
% Reading first 5 lines and sorting
fgetl(f1);                                       % THERMO Header
global_temp = strsplit(fgetl(f1),' ');           % Global Temps
global_temp_low = str2double(global_temp{2});    % Global Low Temp
global_temp_med = str2double(global_temp{3});    % Global Med Temp
global_temp_high = str2double(global_temp{4});   % Global High Temp
fgetl(f1); fgetl(f1); fgetl(f1);                 % Skipping Comments
3. Extracting data
% Extarcting data
for i=1:no_of_species
    line_1 = fgetl(f1);                                 %Reading 1st line of species
    line_2 = fgetl(f1);                                 %Reading 2nd line of species
    line_3 = fgetl(f1);                                 %Reading 3rd line of species
    line_4 = fgetl(f1);                                 %Reading 4th line of species
    a = strsplit(line_1,' ');                           %Splitting First line
    species = a{1}                                      %Assigning species with Name
    local_temp_low = str2num(a{end-3});                 %Local Low Temperature
    local_temp_mid = str2num(a{end-1});                 %Local Mid Temperature
    local_temp_high = str2num(a{end-2});                %Local High Temperature
    T = linspace(local_temp_low, local_temp_high, 1000);%Dividing Temparture range by 1000

    b = strfind(line_2,'E');                            %Finding all E in line2
    c = strfind(line_3,'E');                            %Finding all E in line3
    d = strfind(line_4,'E');                            %Finding all E in line4

    % High Temperature Co-efficients
    hc1 = str2num(line_2(1:b(1)+3));
    hc2 = str2num(line_2(b(1)+4:b(2)+3));
    hc3 = str2num(line_2(b(2)+4:b(3)+3));
    hc4 = str2num(line_2(b(3)+4:b(4)+3));
    hc5 = str2num(line_2(b(4)+4:b(5)+3));
    hc6 = str2num(line_3(1:c(1)+3));
    hc7 = str2num(line_3(c(1)+4:c(2)+3));

    % Low Temperature Co-efficients
    lc1 = str2num(line_3(c(2)+4:c(3)+3));
    lc2 = str2num(line_3(c(3)+4:c(4)+3));
    lc3 = str2num(line_3(c(4)+4:c(5)+3));
    lc4 = str2num(line_4(1:d(1)+3));
    lc5 = str2num(line_4(d(1)+4:d(2)+3));
    lc6 = str2num(line_4(d(2)+4:d(3)+3));
    lc7 = str2num(line_4(d(3)+4:d(4)+3));
3. Calling on Functions to calculate Specific Heat, Enthaly and Entropy
    % Calling functions for Specific Heat, Enthalpy and Entropy
    cp = specific_heat(R, T, local_temp_mid, hc1, hc2, hc3, hc4, hc5, lc1, lc2, lc3, lc4, lc5);
    H = enthalpy(R, T, local_temp_mid, hc1, hc2, hc3, hc4, hc5, hc6, lc1, lc2, lc3, lc4, lc5, lc6);
    S = entropy(R, T, local_temp_mid, hc1, hc2, hc3, hc4, hc5, hc7, lc1, lc2, lc3, lc4, lc5, lc7);
4. Creating Folders with Species names
% Creating folders
    cd('D:Skill-LyncMATLAB for Mechanical EngineersWeek 4File ParsingPlots')  % Changing Directory to create folders in new folder names Plots
    mkdir(species)                                                                 % Making folders with Species names
    cd(species)                                                                    %Changing directory to newly created folders
5. Creating plots and saving in respective folders with proper name
% Creating plots
    % Specific Heat Plot
    figure(1);
    plot(T,cp,'linewidth',3,'color','r');
    xlabel('Temprature(K)');
    ylabel('Specific Heat(J/(kg.K))');
    title('Specific Heat Vs. Temperature for ', species);
    saveas(figure(1),'Specific Heat.jpg');                  %Saving images of plots in respective folders

    %Enthalpy Plot
    figure(2);
    plot(T,H,'linewidth',3,'color','g');
    xlabel('Temprature(K)');
    ylabel('Enthalpy(J)');
    title('Enthalpy Vs. Temperature for ', species);
    saveas(figure(2),'Enthalpy.jpg');                  %Saving images of plots in respective folders

    %Entropy Plot
    figure(3);
    plot(T,S,'linewidth',3,'color','b');
    xlabel('Temprature(K)');
    ylabel('Entropy(J/K)');
    title('Entropy Vs. Temperature for ', species);
    saveas(figure(3),'Entropy.jpg');                  %Saving images of plots in respective folders

    cd('D:Skill-LyncMATLAB for Mechanical EngineersWeek 4File Parsing') % Changing directory to main folder to continue the FOR loop
end
6. Function for Specific Heat
function [cp] = specific_heat(R, T, local_temp_mid, hc1, hc2, hc3, hc4, hc5, lc1, lc2, lc3, lc4, lc5)

for i= 1:1000
    t = T(i);
if T(i)<= local_temp_mid
    cp(i) = (lc1 + lc2*t + lc3*t^2 + lc4*t^3 + lc5*t^4)*R;      %Using Low Temp Co-effts
else
    cp(i) = (hc1 + hc2*t + hc3*t^2 + hc4*t^3 + hc5*t^4)*R;      %Using High Temp Co-effts
end
end
end
7. Function for Enthalpy
function [H] = enthalpy(R, T, local_temp_mid, hc1, hc2, hc3, hc4, hc5, hc6, lc1, lc2, lc3, lc4, lc5, lc6)

for i = 1:1000
    t = T(i);
if T<= local_temp_mid
    H(i) = (lc1 + (lc2*t)/2 + (lc3*t^2)/3 + (lc4*t^3)/4 + (lc5*t^4)/5 + lc6*t^-1)*R*t;   %Using Low Temp Co-effts
else
    H(i) = (hc1 + (hc2*t)/2 + (hc3*t^2)/3 + (hc4*t^3)/4 + (hc5*t^4)/5 + hc6*t^-1)*R*t;   %Using High Temp Co-effts
end
end
end
8. Function for Entropy
function [S] = entropy(R, T, local_temp_mid, hc1, hc2, hc3, hc4, hc5, hc7, lc1, lc2, lc3, lc4, lc5, lc7)

for i = 1:1000
    t = T(i);
if T<= local_temp_mid
    S(i) = (lc1*log(t) + lc2*t + (lc3*t^2)/2 + (lc4*t^3)/3 + (lc5*t^4)/4 + lc7)*R;   %Using Low Temp Co-effts
else
    S(i) = (hc1*log(t) + hc2*t + (hc3*t^2)/2 + (hc4*t^3)/3 + (hc5*t^4)/4 + hc7)*R;   %Using High Temp Co-effts
end
end
end
8. Screenshot of folders where all species folders are created
9. Phots saved of plots
10. Plots of O2
11. Plots of N2
12. Plots of CO2