Week - 4 - crash box simulation
Objective: To analyze the Crash Box with different sheet thicknesses.
In this challenge, the following results have to define-
- The cross-sectional force generated in the middle of the crash box
- Acceleration plot of a node in the middle of the crash box.
- Maximum directional stress and strain along the length of the crash box.
- Plot all energies like total energy, internal energy, hourglass, and sliding energy.
- Compare the acceleration and stress-strain plot of 1.2 and 1.5mm thick crash box.
Crash Box:- Crash Box is a thin metal box that is the main energy-absorbing component in an automobile after the bumper. It is mounted next to the bumper in a vehicle. When an impact happens to the vehicle, the crush box is used to store the energy in terms of deformation. In this challenge, we will analyze various stresses, strain, sectional force, and energies of the crash box when it hit the wall.
Model:- The crash box model is made up of a 1.2 mm thick sheet and Piecewise Linear Plastic material is used for the analysis. The basic unit for this challenge is gm, mm, ms.
The properties of Piecewise Linear Plastic are listed below-
Density = 7.85E-3 gm/ cubic mm
Young's Modulus = 2.1E5 MPa
Poisson's Ratio = 0.3
Etan = 2100 MPa
Yield Stress = 250 MPa
Analysis:- Crash box model provided for this challenge is given below-
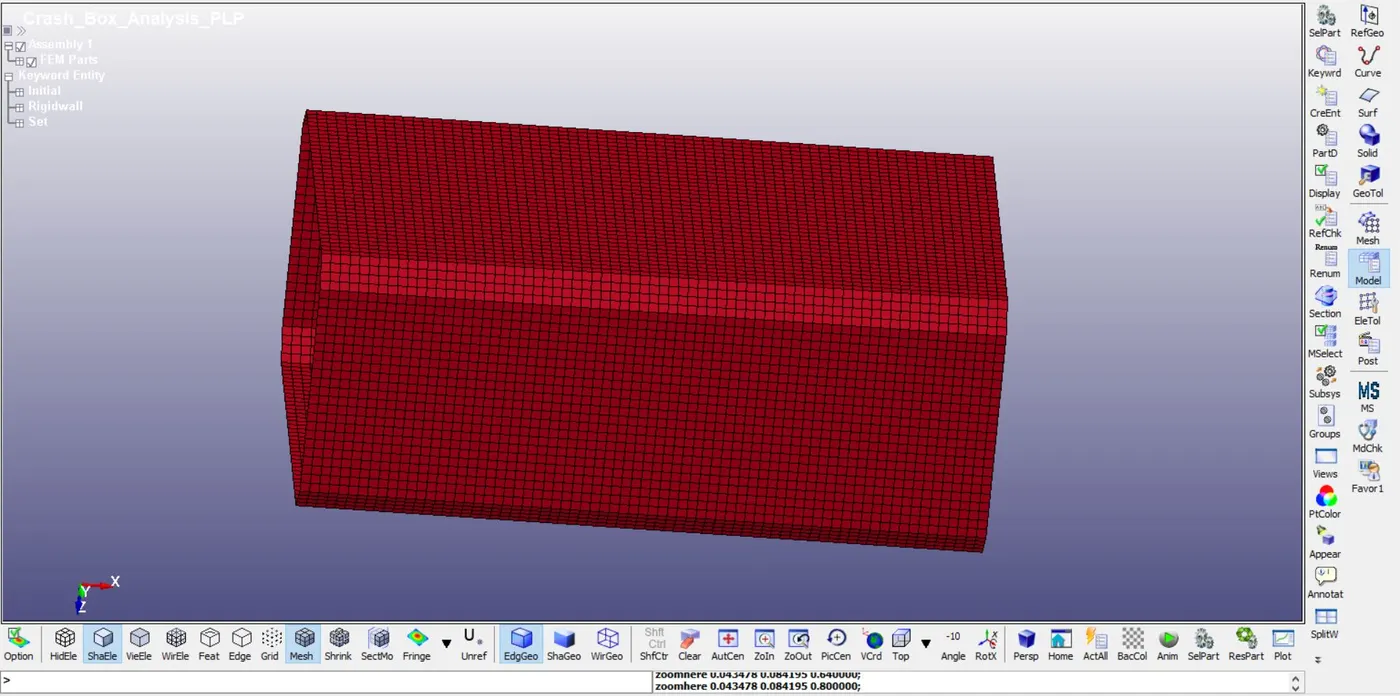
Fig 1:- Crash Box Model
1. Material Assignment:- Piecewise linear plastic material is selected due to its elastoplastic behavior. In this simulation, the crash box may deform plastically due to the high velocity of impact. The properties of the material are listed below.
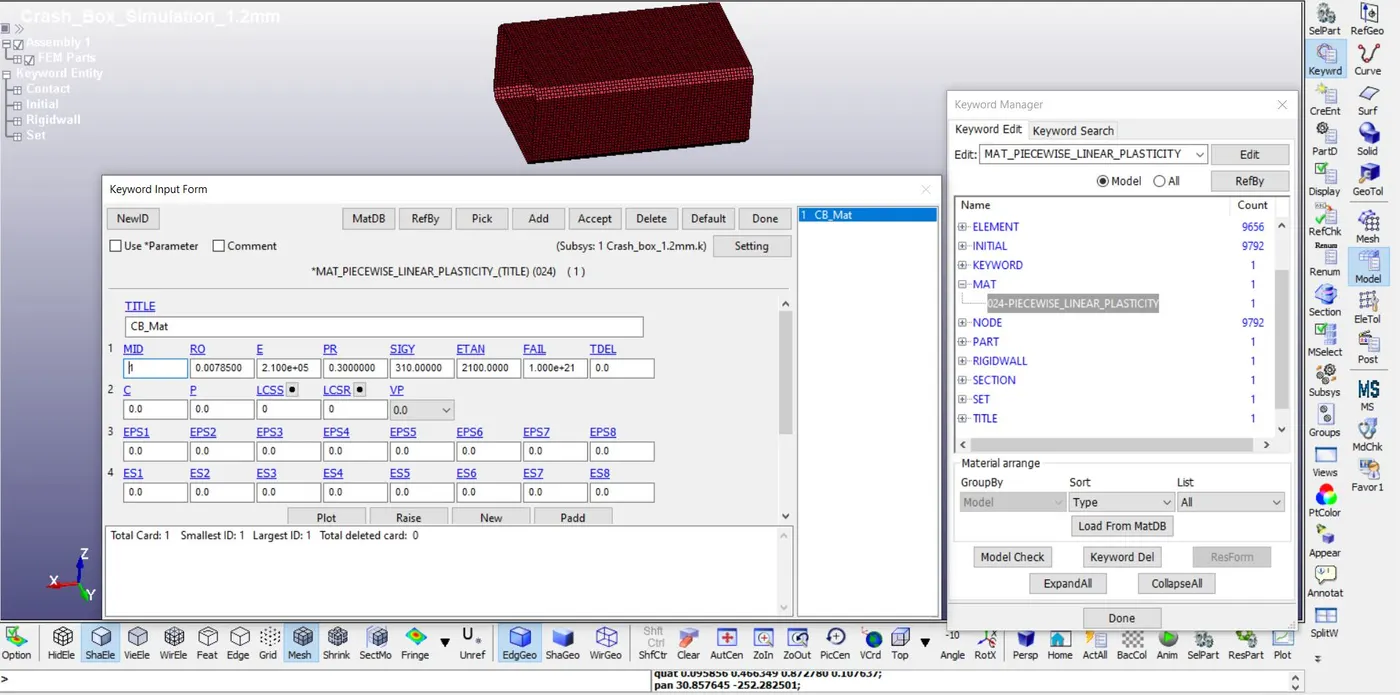
Fig 2:- Properties of Piecewise Linear Plasticity
2. Section Assignment:- Shell section with element formulation 2 is selected. The rest of the value is taken as default.
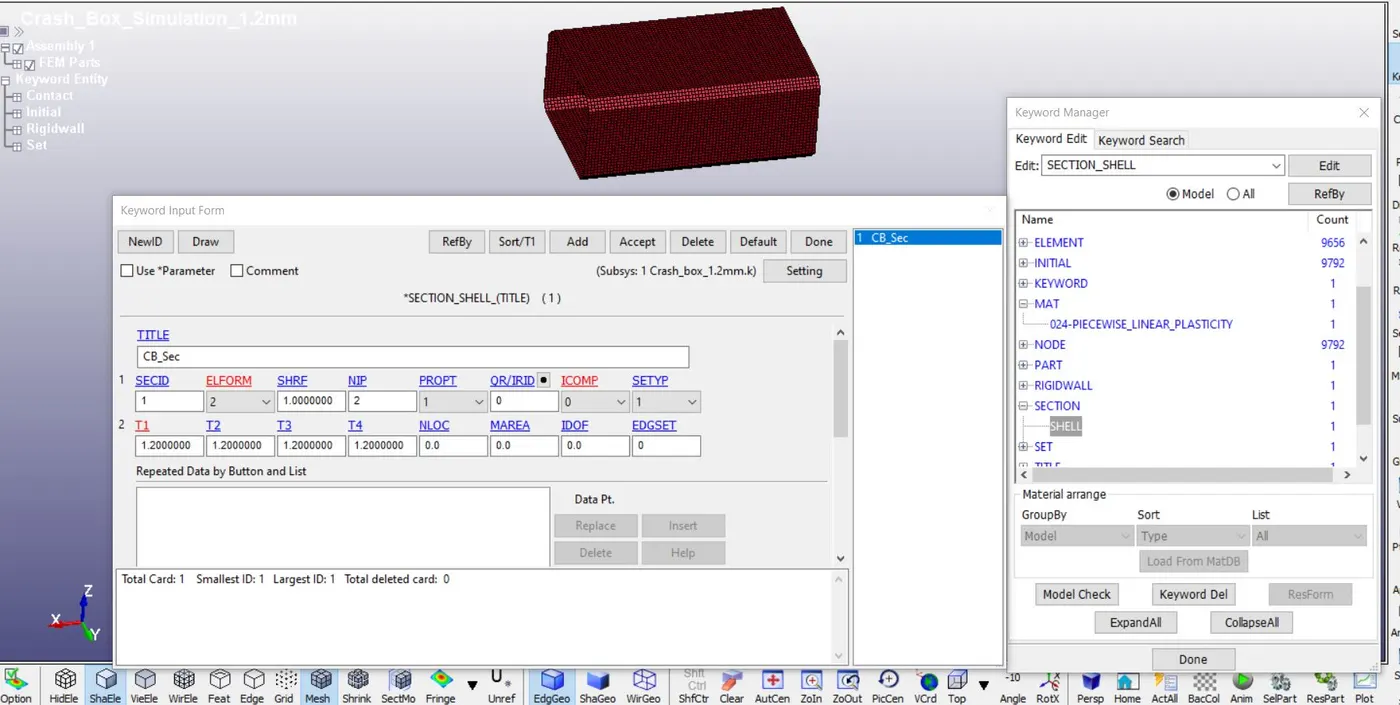
Fig 3:- Sectional properties
After that Material and section is assigned to the crash box.
3. Rigid wall:- To analyze the impact of the crash box, a rigid wall is created using the RIGIDWALL keyword. The parameter of the rigid wall is shown below.
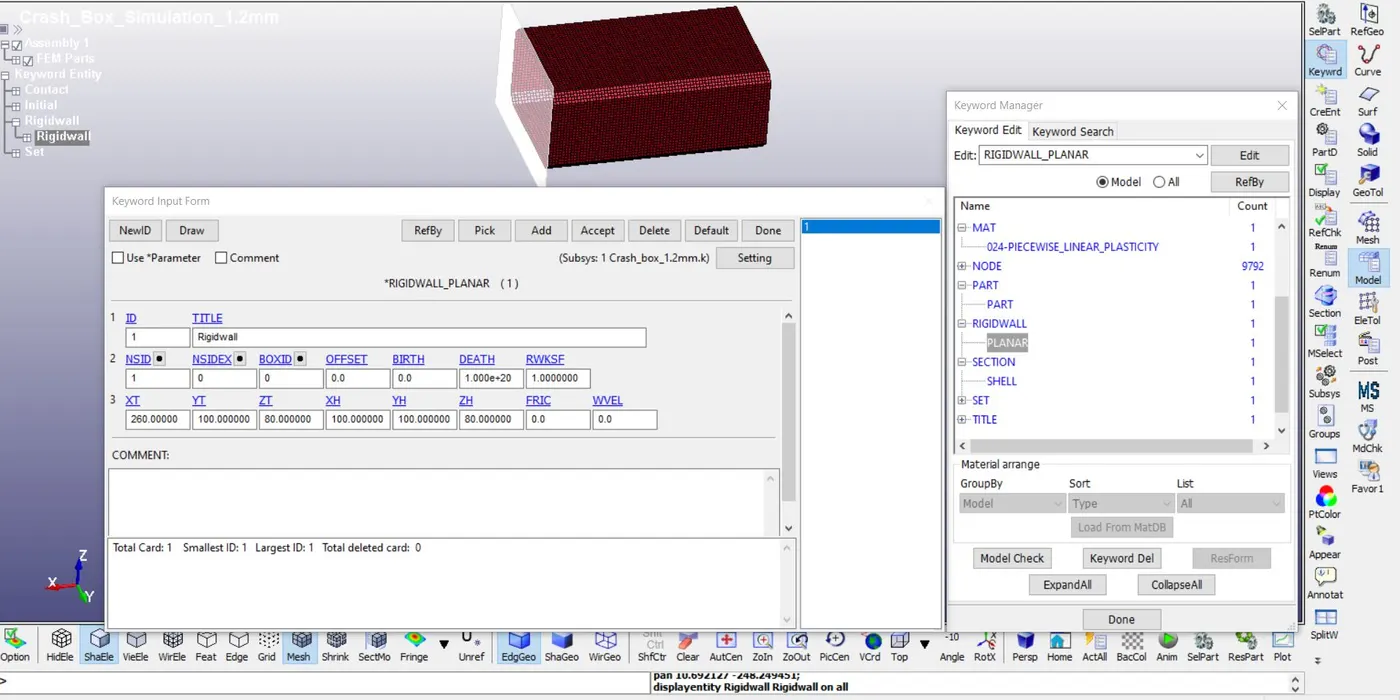
Fig 4:- Crash Box model with Rigidwall
4. Velocity:- A standard velocity of 50kmph is assigned to the crash box which is 13.88mm/ms in our base unit consideration. The velocity node is chosen to assign the velocity to the crash box in the positive x-direction.
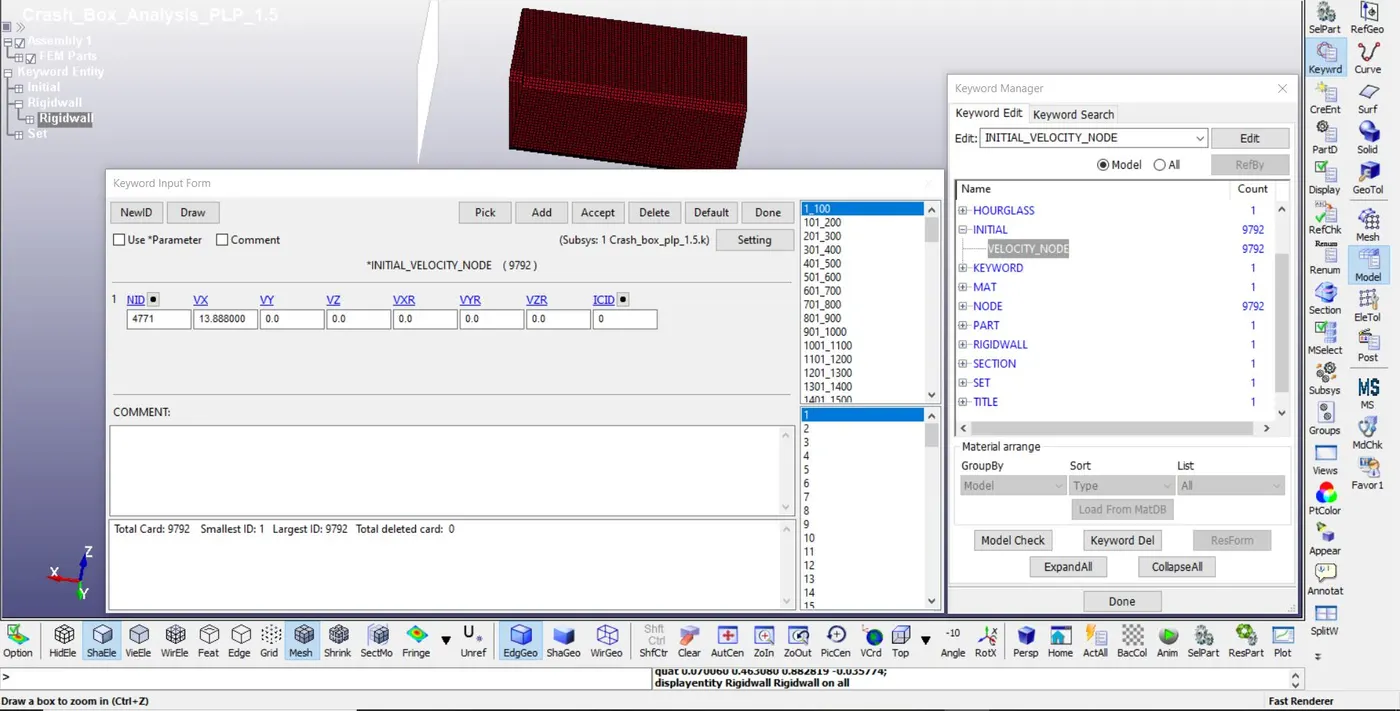
Fig 5:-Initial Velocity data
5. Contact:- During the impact, the crash box may get deform and folds itself. To simulate this phenomena AUTOMATIC_SINGLE_SURFACE keyword is used. The crash box is selected as a slave body.
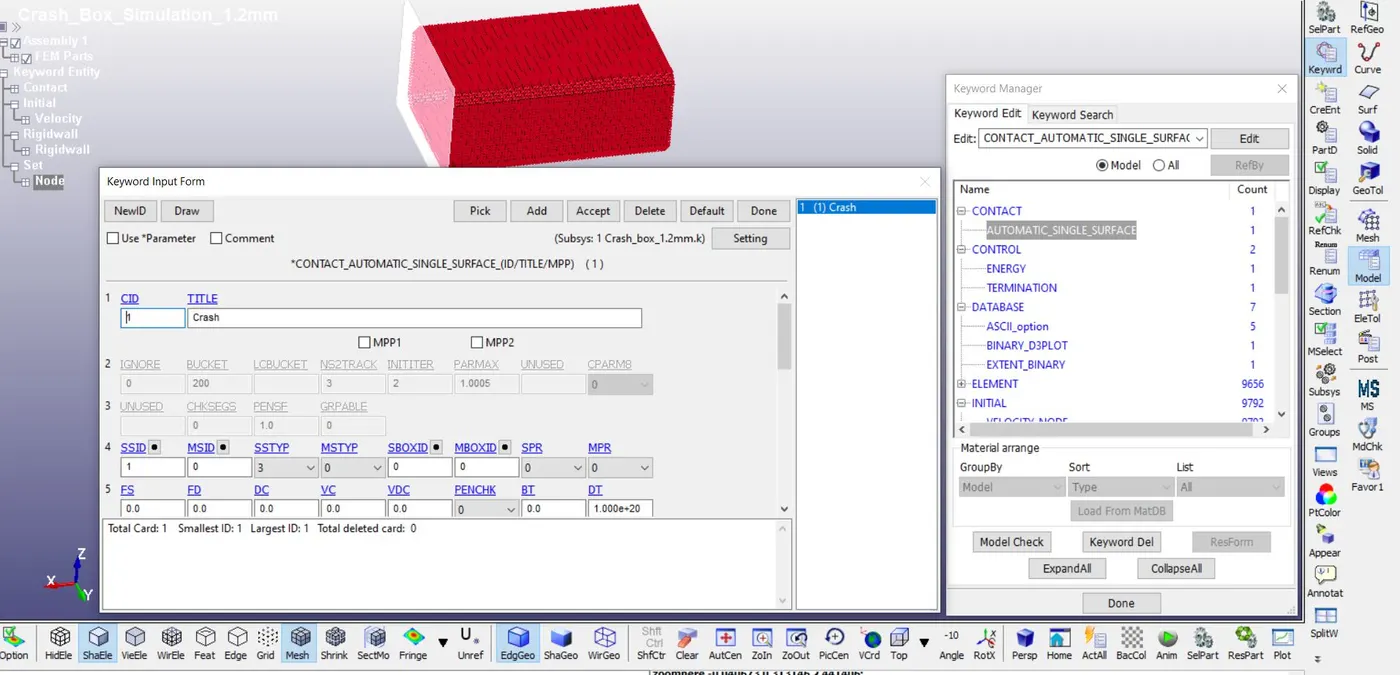
Fig 6:- Contact definition
6. Termination:- Termination time defines the end of the simulation. In this analysis end time is 2ms.
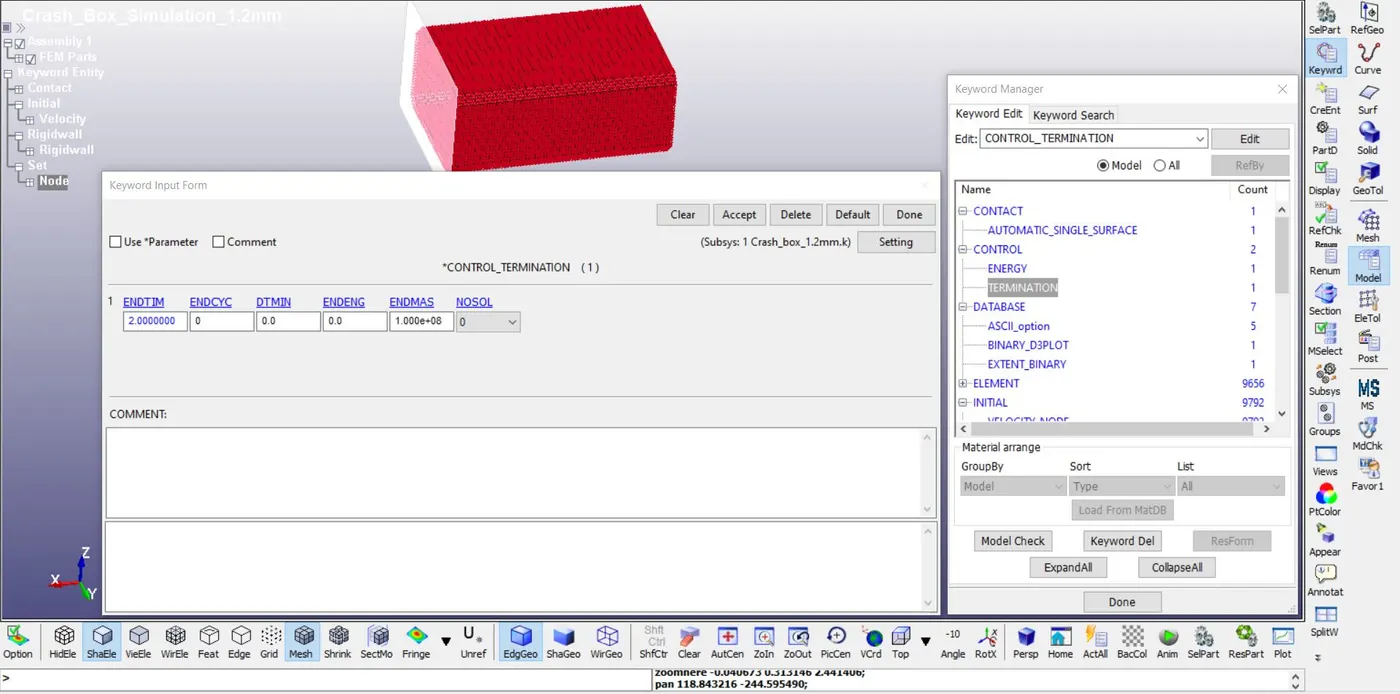
Fig 7:- Control Termination input
7. Database:- After defining all boundary conditions, what type of output needs can be defined in the DATABASE keyword. BINARY_D3PLOT used to define stress-strain contour. In ASCII, glstat, matsum, rcforce, and sleout are chosen. This keyword is used to define all energies and different parameters like cross-section force, hourglass, etc. The Interval time for result calculation is taken as 0.03ms.
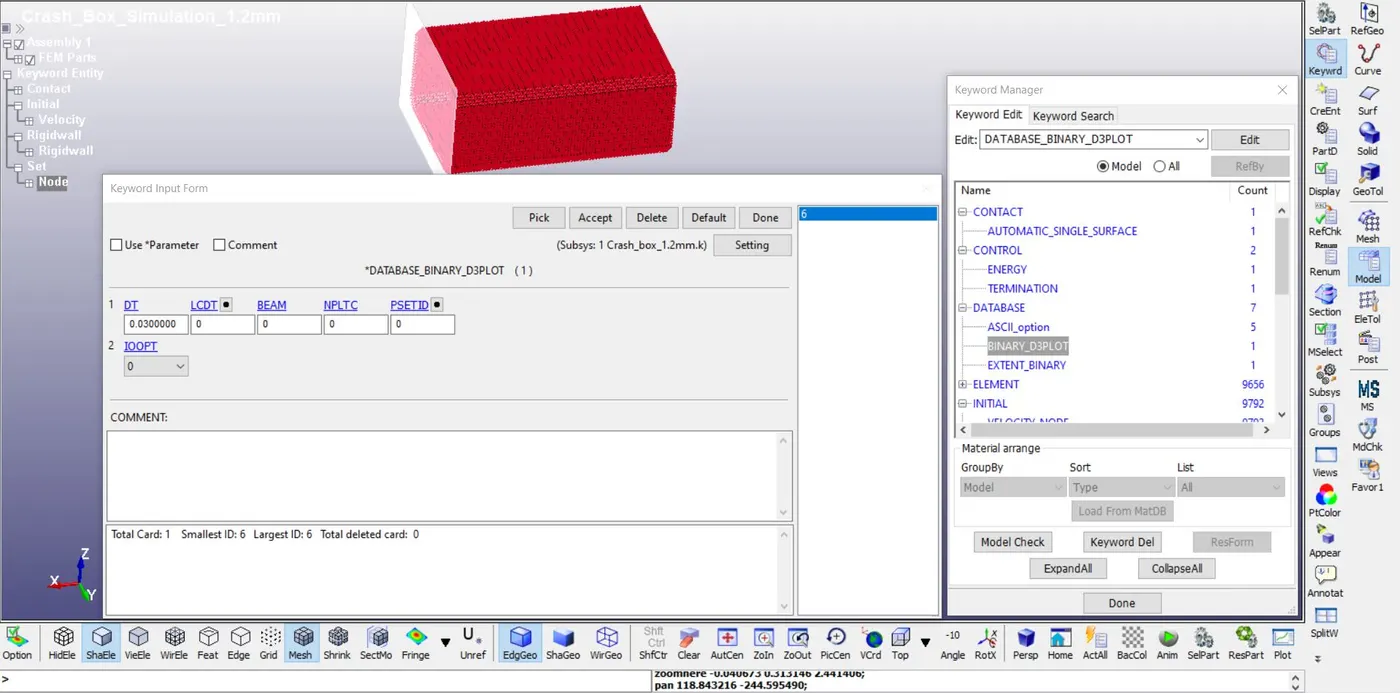
Fig 8: Binary D3plot input
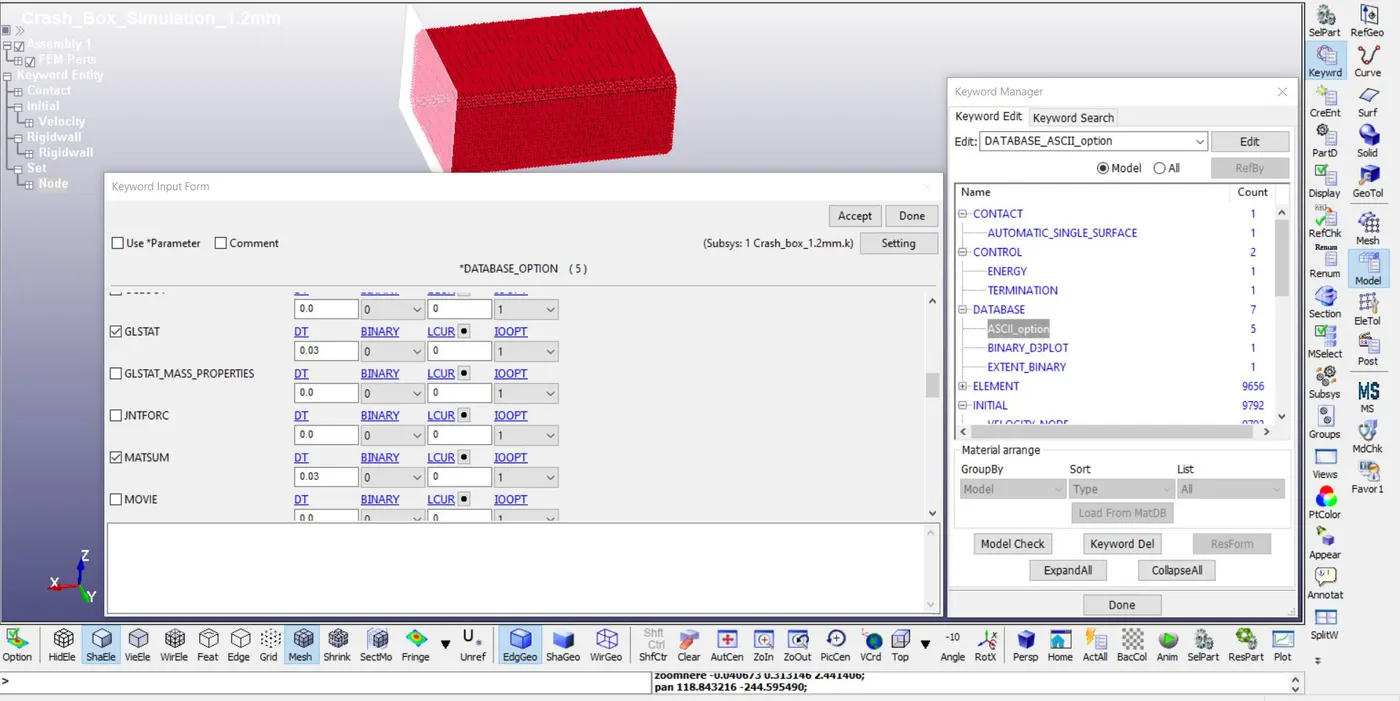
Fig 9: ASCII definition
After defining all the boundary conditions and parameters the keyword file is saved to the desire location. Then the solver is used to run this keyword file. After normal termination, the results can be displayed using a Binary keyword file.
RESULTS:-
1.Cross-Sectional Force:- When the crash box hit the rigid wall, a force of reaction was generated in the crash box. In this analysis, sectional force is defined in the middle of the crash box.
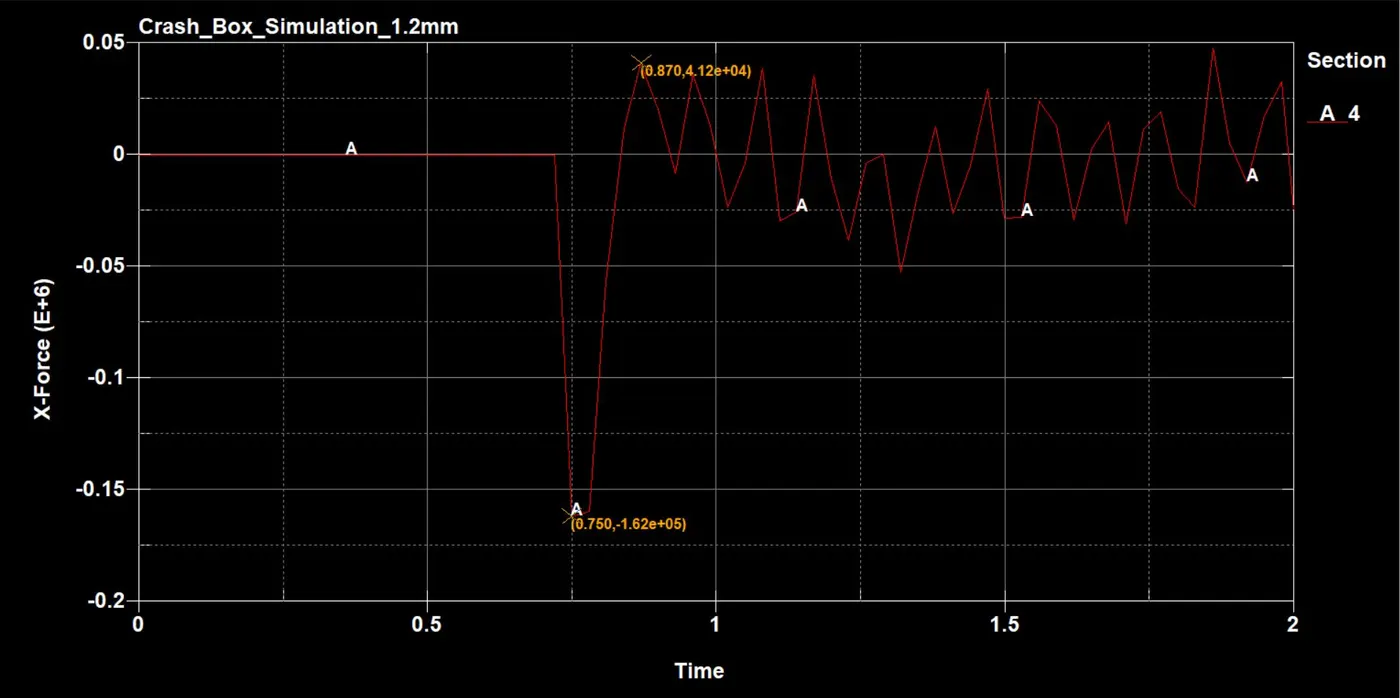
Fig 10:- Cross-sectional force at the middle of Crash Box
After the impact, a cross-sectional force of 162kN is generated in the middle plane of the crash box at 0.75ms. The negative spike in this graph indicates the compressive nature for the small-time interval after the impact results in small contractions in the crash box. Then due to rebounce, force becomes positive. The continuous ups and downs indicate that the crash box is having some vibration due to rebounce.
2. Acceleration Plot:-
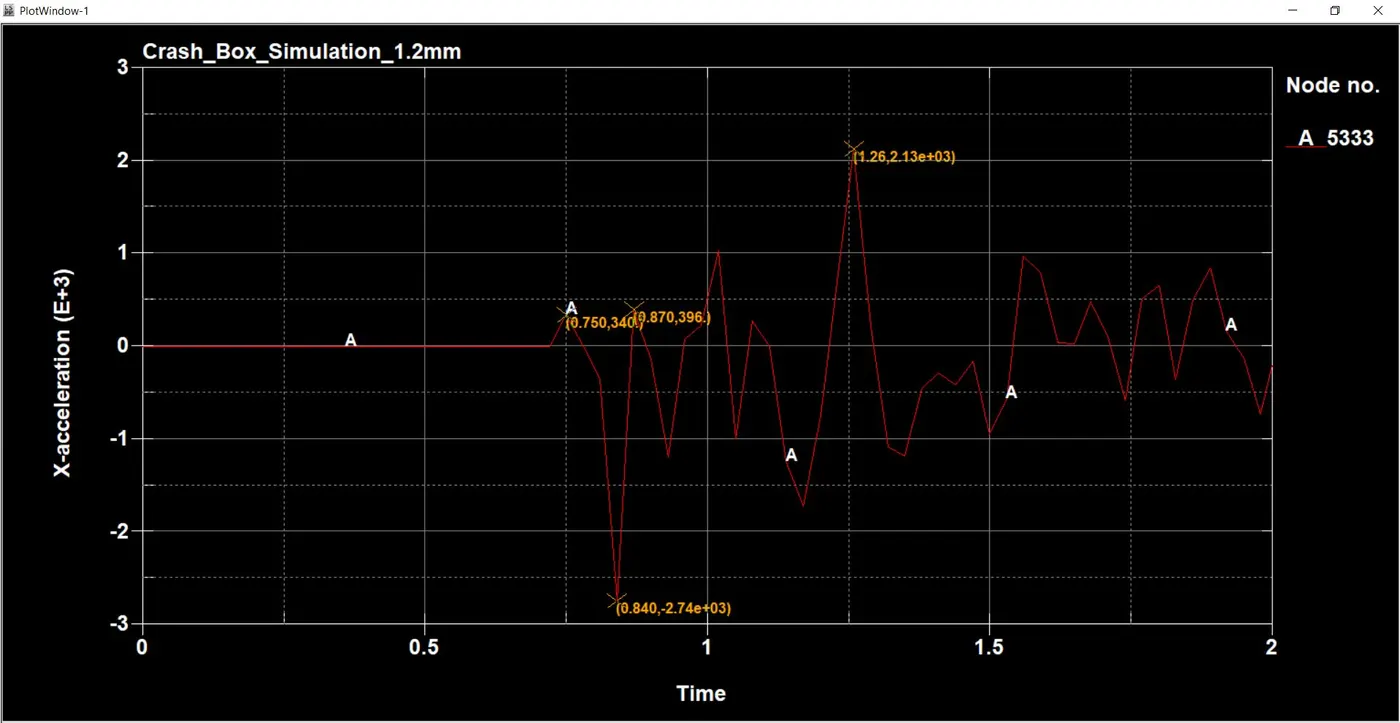
Fig 11:- Acceleration Plot
During impact, a negative spike in this graph indicates that the crash box is deaccelerating with 2.74E+3 mm/ ms^2 at 0.84ms. After a bounce-back, the crash box accelerated with 396mm/ ms^2.
3. Directional Stress and Strain:- The crash box is moving towards the rigid wall in the positive x-direction. In this simulation, we will find out the stress along the length of the crash box i.e. X stress and X strain.
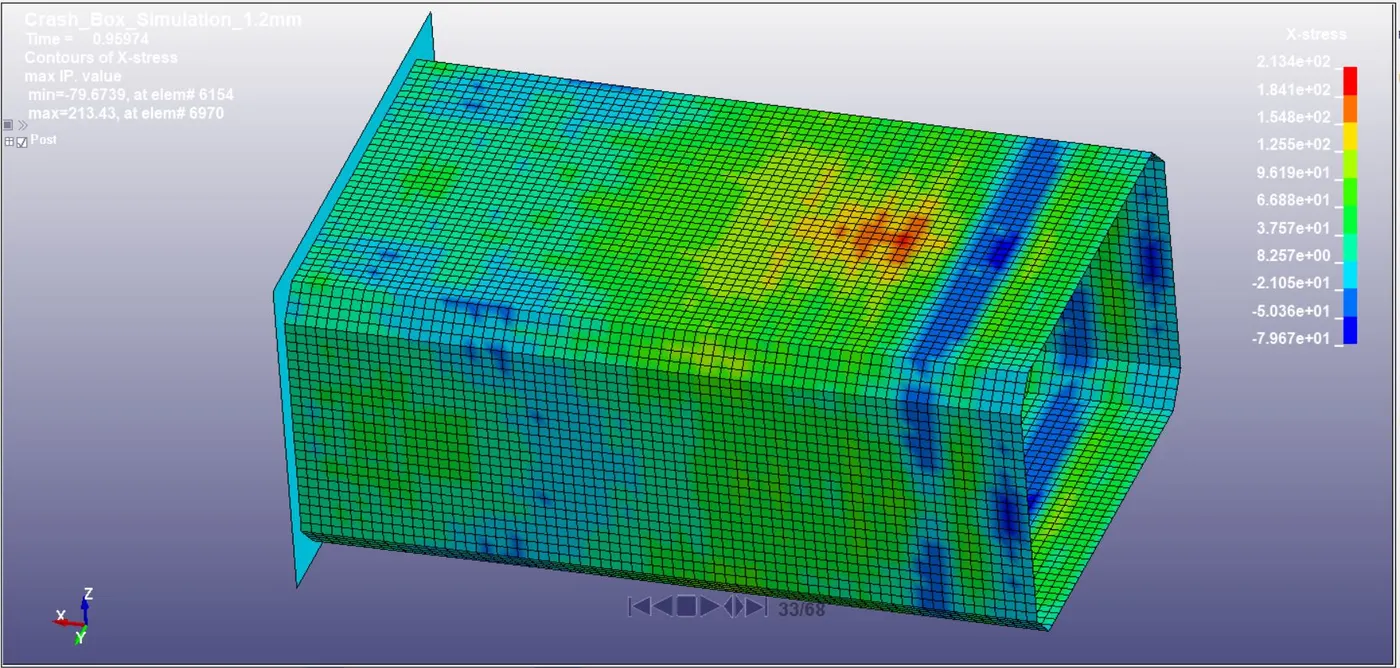
Fig 12:- X Directional Stress
From the result, it can be seen that the stress developed in the x-direction is 213.4Mpa which is generated near the back end of the crash box. During impact the middle part of the crash box experience more stress due to the compression from the front side as well as backside. This stress is less than the yield strength of the material, so it will not get failed if stress is considered a failure criterion.
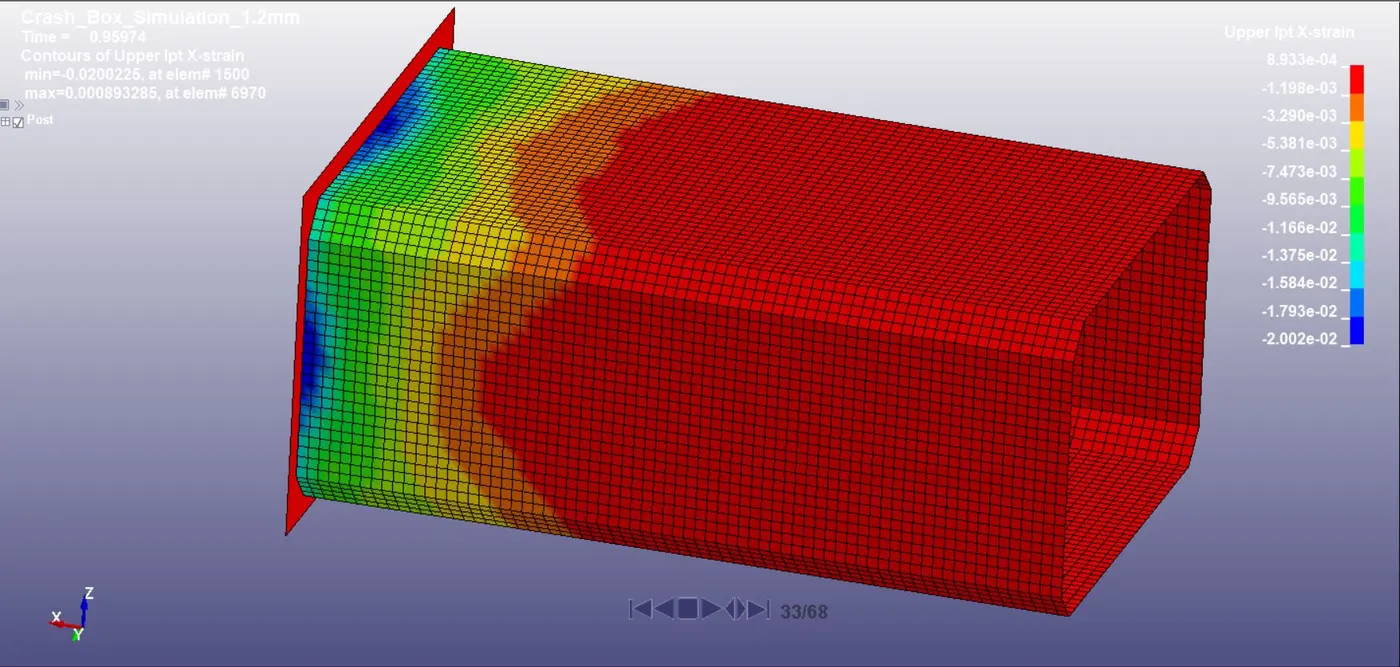
Fig 12:- Upper IPT X Strain
The strain value in the x-direction is 8.933E-04 which is too small. From the model, it can be analyzed that the maximum strain is developed around the back end of the control box.
4. Energies comparison:- In this part of the simulation we will see how the energy is changing its form.
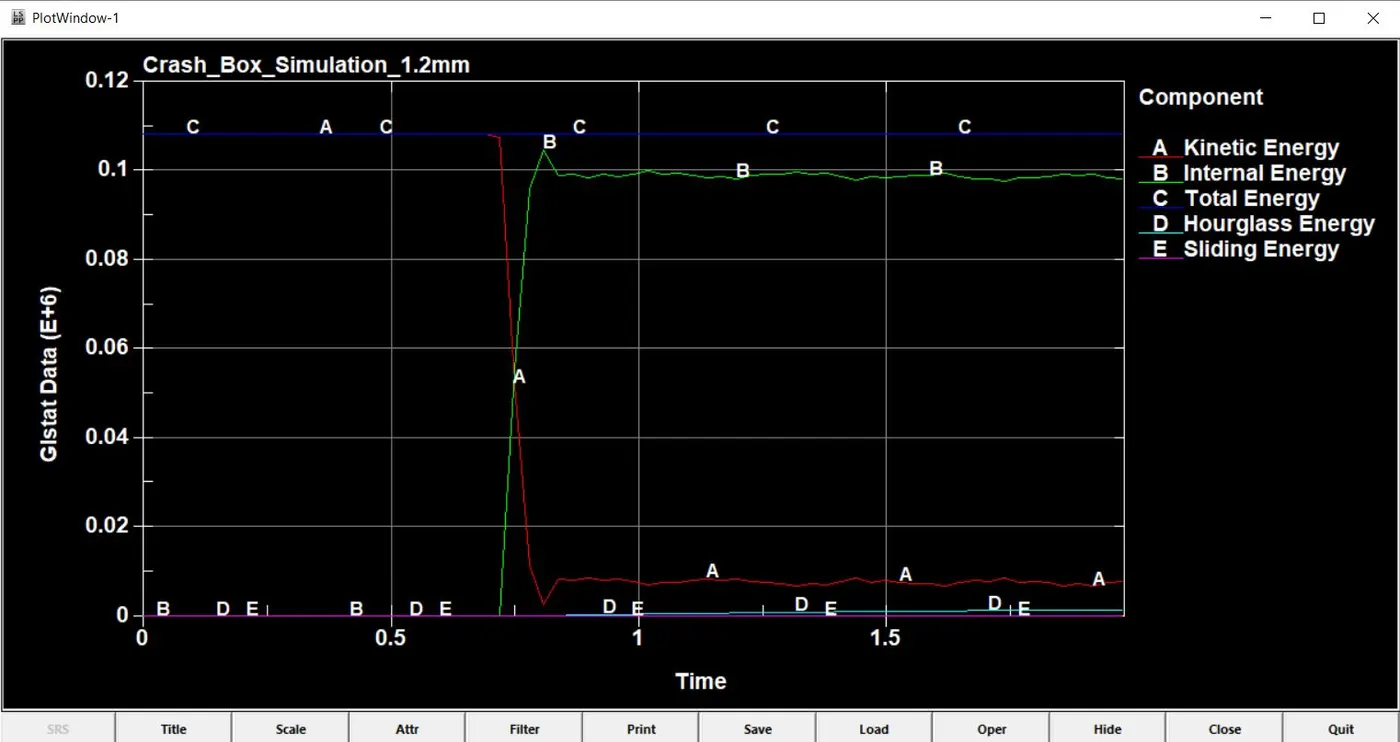
Fig 13:- Energies
Before the impact, the energy stored in the control box in the form of kinetic energy, and at the time of impact the kinetic energy is converted into internal energy which leads to an increase in the temperature of the crash box. The hourglass energy is too small as compared to internal energy which indicates the analysis is precise.
5. Comparison of Stress-Strain and acceleration for a crash box having 1.2mm and 1.5mm thickness:-
5.1 Stress-Strain Comparison:- Here we will compare the Stress-Strain plot and acceleration for the crash box having a thickness of 1.2mm and 1.5mm.
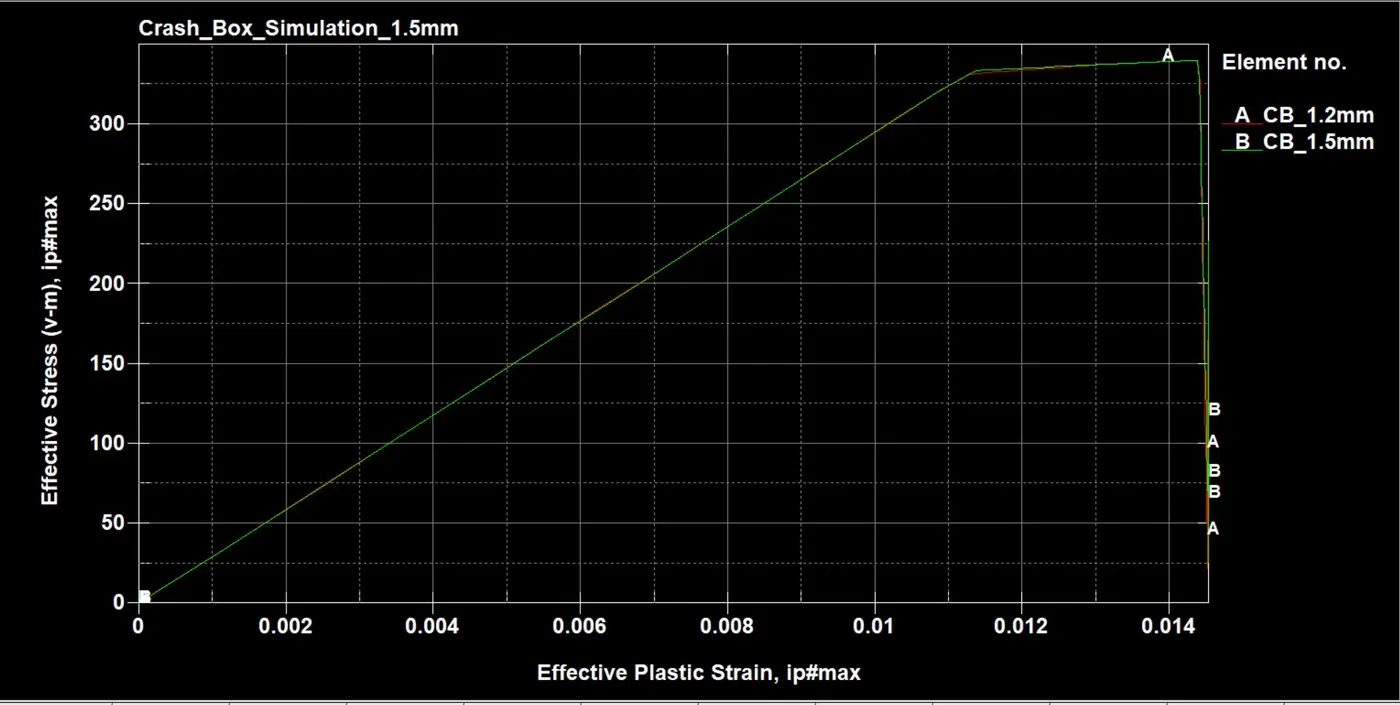
Fig 14:- Stress-Strain Plot
Table 1:- Stress-Strain Comparison
| Thickness | Stress (MPa) | Strain |
| 1.2 mm | 332 | 0.0113 |
| 340 | 0.0144 | |
| 1.5mm | 334 | 0.0114 |
| 340 | 0.0143 |
From the above table and the graph, it can be seen that the value of stress and stress for both the crash box having a different thickness is almost the same. But for the crash box having 1.2mm thickness is required less stress to get plastically deformed as compare to 1.5mm thick.
5.2 Acceleration Comparison:-
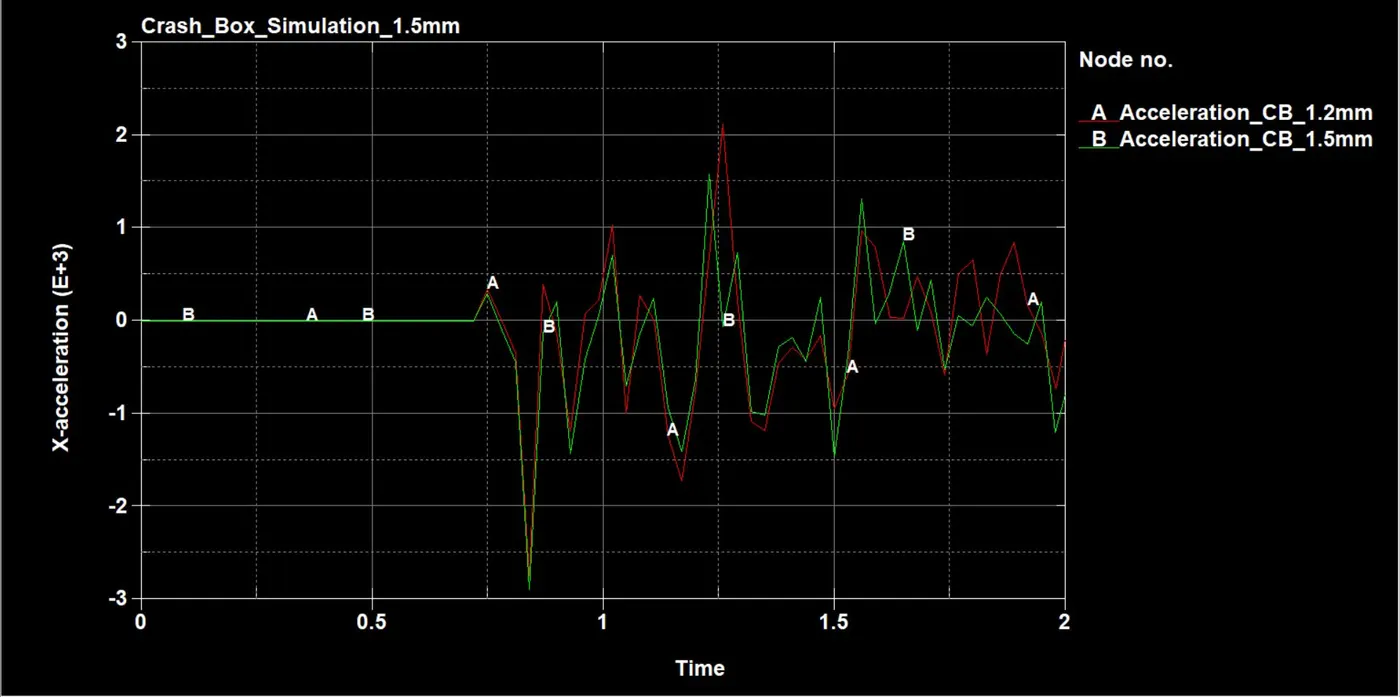
Fig 15:- Acceleration comparison
From the plot, it can be analyzed that the acceleration is almost the same for both the crash box but after impact, the deacceleration in the crash box of 1.5mm thickness is high due to high inertia. The value of the deceleration at the time 0.84ms is 2.74E+3 and 2.89E+3 for 1.2mm and 1.5mm thick crash box respectively.
CONCLUSION:-
From the analysis, we can conclude that the crash box having different thickness will not affect the value of stress and strain considerably. So instead of using a 1.5mm thick crash box, we can go with the 1.2mm.