Week - 4 - Crash Box Simulation
Week 4 Challenge: Crash BoxSimulation Challenge
Course: LS-DYNA for Structural Mechanics/ FEA
Submitted by: Amanpreet Singh Whan
Supervisor: Tholkappiyan D
July 9, 2021
Table of Contents
1 Introduction
LS-DYNA is an advanced general-purpose multiphysics simulation software package developed by the former Livermore Software Technology Corporation (LSTC), which was acquired by Ansys in 2019. While the package continues to contain more and more possibilities for the calculation of many complex real-world problems, its origins and core competency lie in highly nonlinear transient dynamic finite element analysis (FEA) using explicit time integration. LS-DYNA is used by the automobile, aerospace, construction and civil engineering, military, manufacturing, and bioengineering industries.
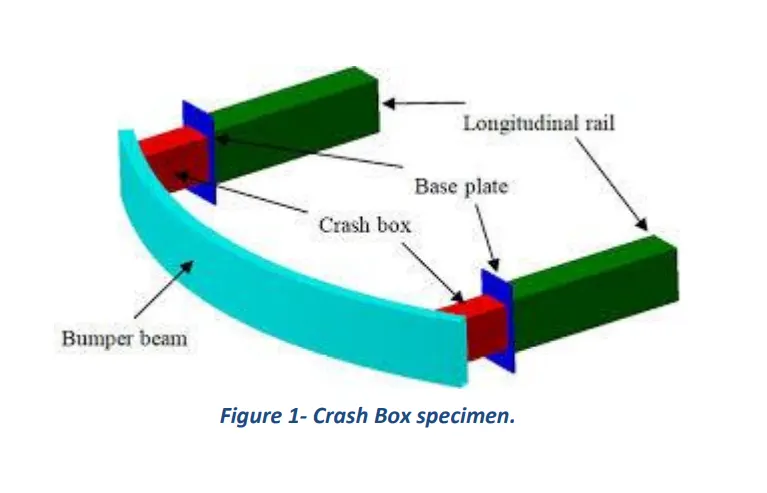
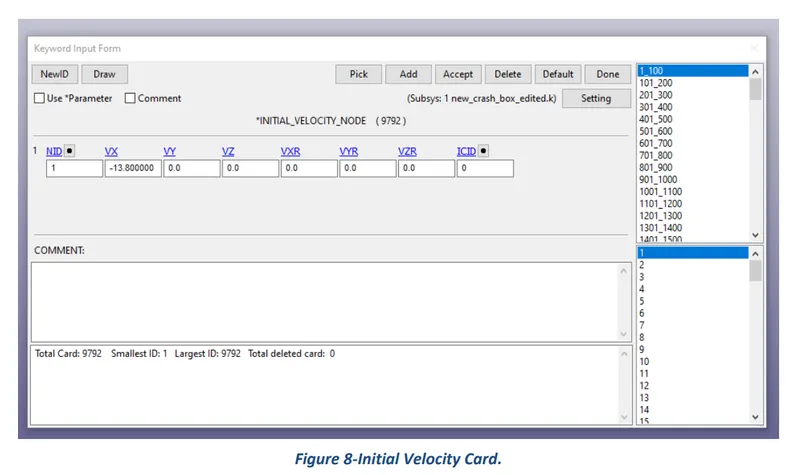
During a light collision between two vehicles or a vehicle and an obstacle, the internal structure of the car is irrecoverably damaged. In order to limit as much as possible, the body in white defacement the new vehicles are equipped with so-called crash boxes situated in front and rear of the car. The purpose of the challenge is to perform a crash test of the rectangular crash box having an initial velocity of 50 km/hr (13.8 mm/ms) and analyze how the crash box behaves when it rebounds back and when it buckles & folds in the axial direction as soon as meets the rigid wall.
2 Aims
- Create a simulation setup to perform the crash test of the crash box for two different scenarios, (a) It crashes onto the rigid wall and rebounds completely (b) it buckles and folds in the axial direction to come in self-contact.
- Analyze the Cross-sectional force, maximum directional stress, and strain, and other results obtained from the simulation while and after the crash box hits the wall.
- Compare the accelerations and stress-strain plots and other results of both 1.2 and 1.5 thick crash boxes.
3 Methodology
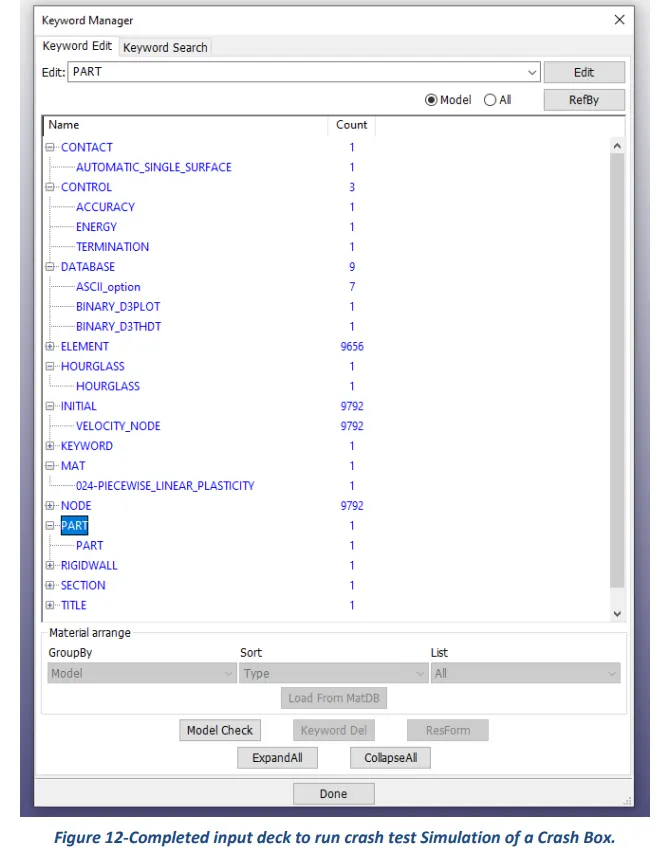
The section describes different stages that were performed to set up the simulation file using an engineering tool LS-DYNA for the completion of the Week 4 Challenge task. These stages can be broadly categorized into creating an input deck containing different cards such as contact, control, database, element, hourglass, initial (velocity), keyword, MAT, node, part, section, and title.
Since LS-DYNA does not have a default system of units, therefore, the user needs to input material properties and physical dimensions according to a consistent system of units as per their choice. Considering the challenge requirements of simulating a cell phone drop on a plate mimicking ground, g mm ms were assumed to be the most appropriate units.
What follows hereafter is the set of images representing the process followed to create different cards and values assigned to their key parameters.
Contact:
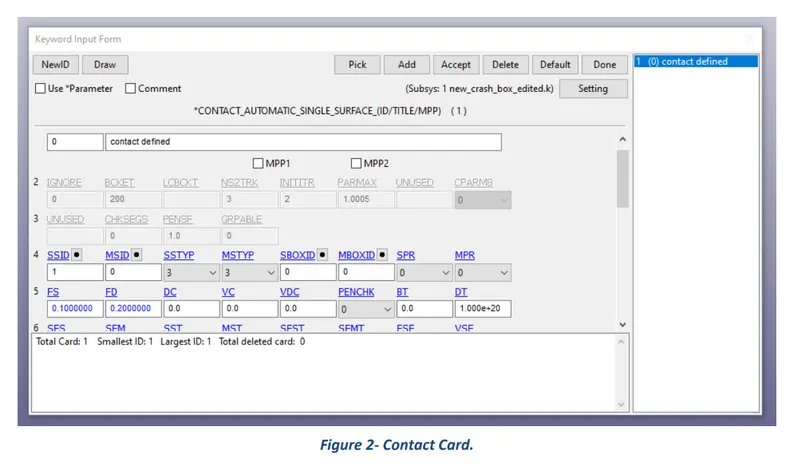
The keyword CONTACT provides a way of treating interaction between disjoint parts. Since there is only a single part present in the given CAD model, therefore, Automatic Single Surface Contact was defined for the simulation setup.
Control:
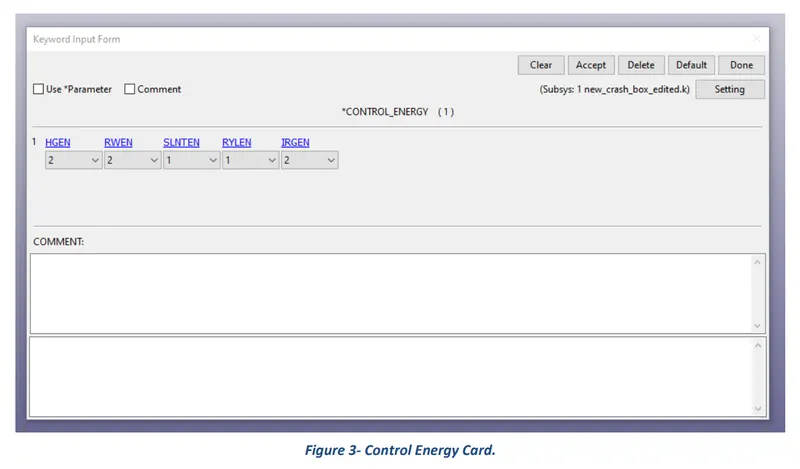
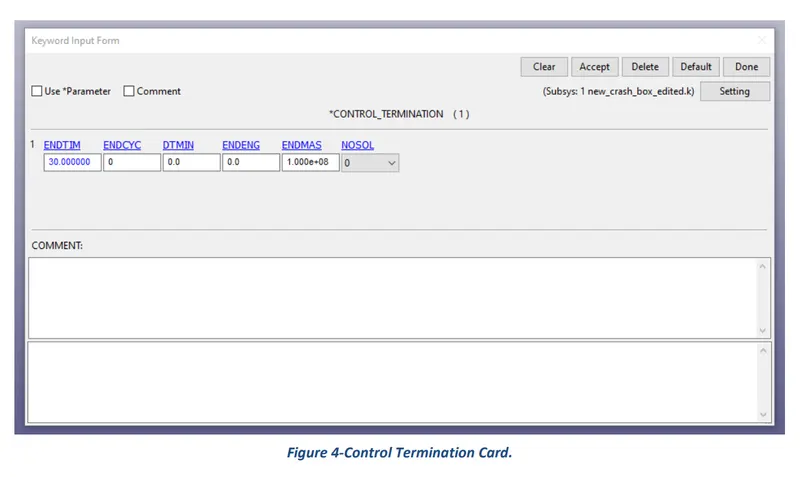
The keyword control cards can be used to change defaults. The control energy and control termination cards were created for the challenge purposes.
Database:
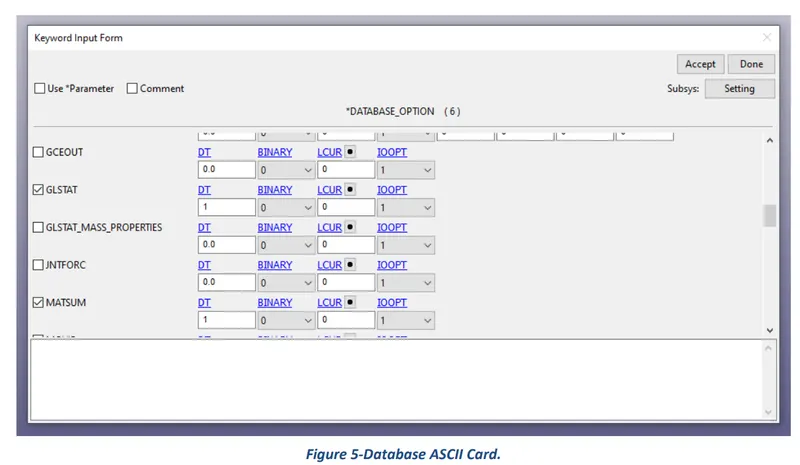
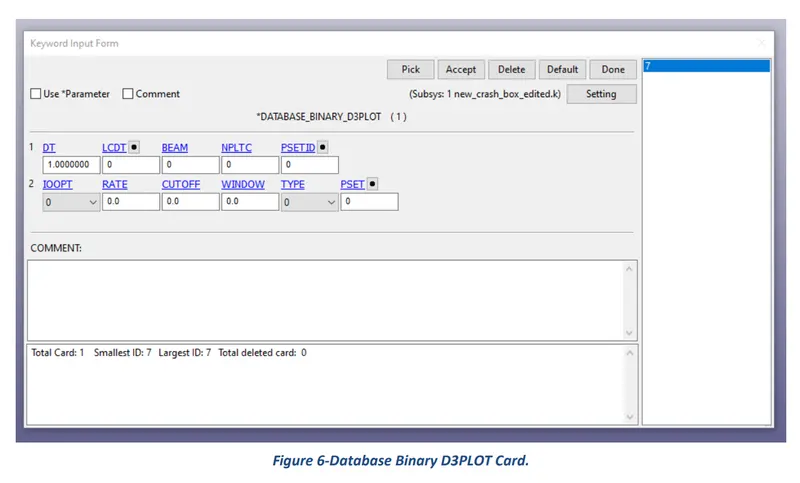
The database definitions are necessary to obtain output files containing results information. The binary D3Plot and ASCII options were selected for the challenge purposes.
Hourglass:
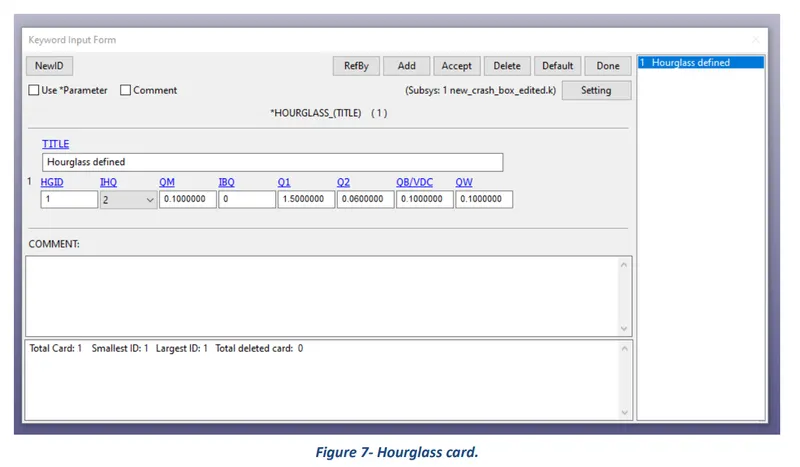
Hourglass (HG) modes are nonphysical, zero-energy modes of deformation that produce zero strain and no stress. Hourglass modes occur only in under-integrated (single integration point) solid, shell, and thick shell elements.
Initial:
The keyword INITIAL provides a way of initializing velocities and detonation points. The velocity node option was selected, and the assigned value of velocity is presented in the following card.
Mat:
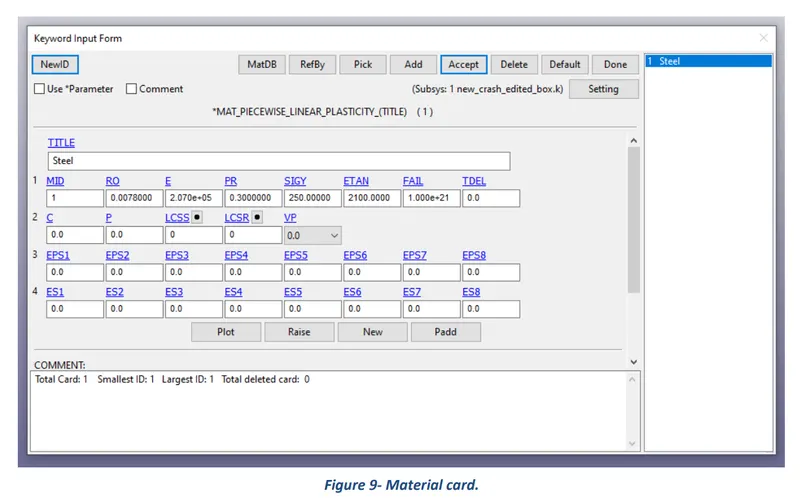
The keyword MAT helps in defining and assigning different types of materials to a part as per requirements. For this challenge MAT 024 (piecewise linear plasticity) was selected for the two different crash analyses as per requirements. The values assigned to material card parameters are presented in the following card.
Section:
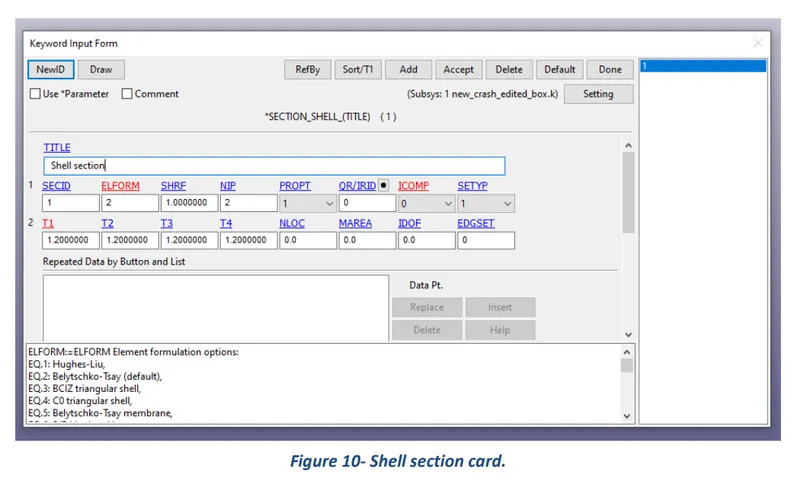
Under section, the element formulation, integration rule, nodal thicknesses, and cross-sectional properties are defined. Shell section was created and assigned values for its parameters are presented in the following picture.
Part:
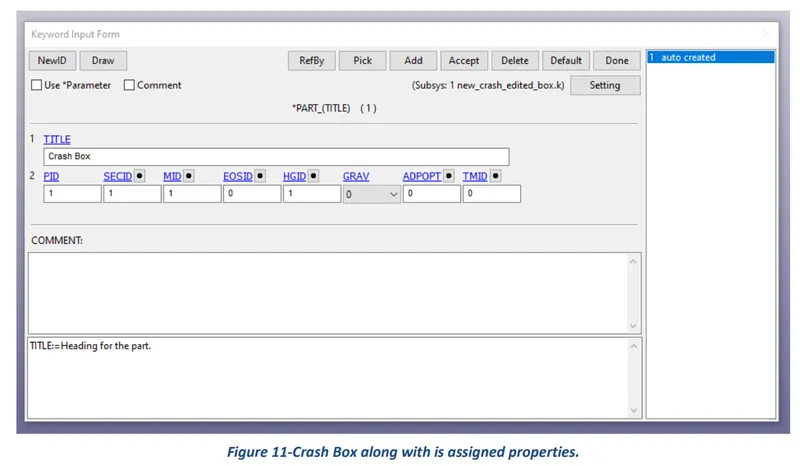
Here define combine material information, section properties, hourglass type, thermal properties, and a flag for part adaptivity.
4 Results
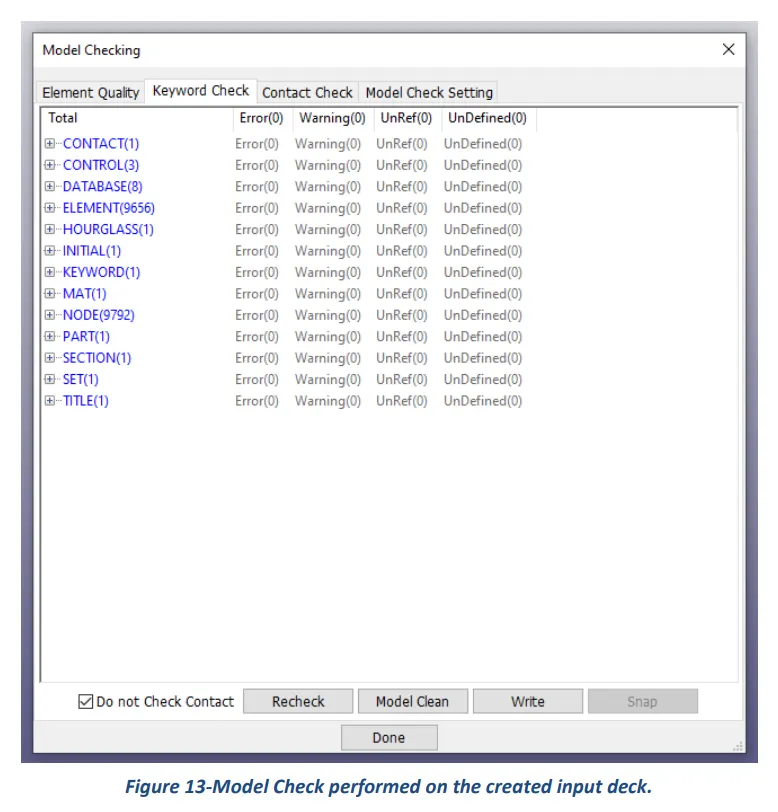
After setting up the input deck and saving the file. K format, the first and foremost step is to perform a model check and then run the simulation using LS-Run software. Once normal termination is achieved, the results can be viewed and analyzed using LS-PrePost software.
The following images representing the results of the crash analysis of the two different scenarios.
- Crash box of thickness 1.2mm hits rigid wall and rebounds back.
- Crash box of thickness 1.5mm hits rigid wall and rebounds back.
Results of the crash box having thickness 1.2 mm.
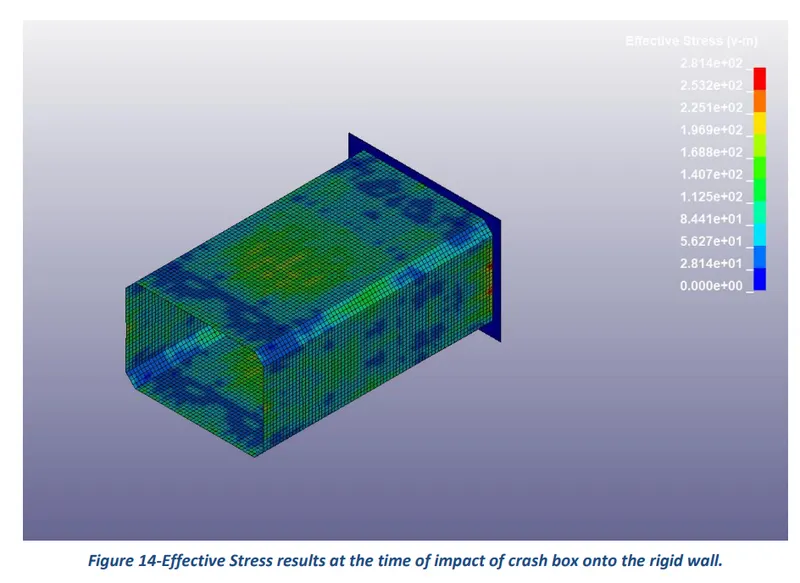
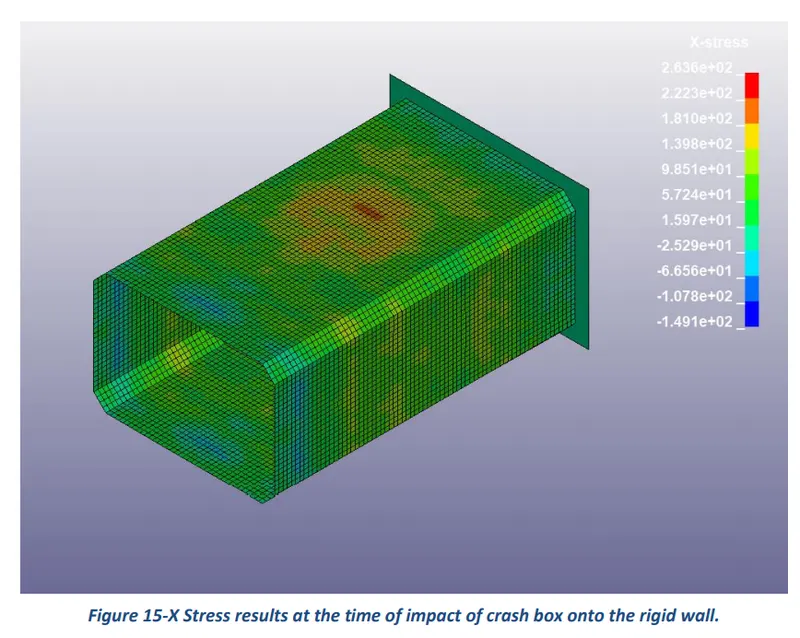
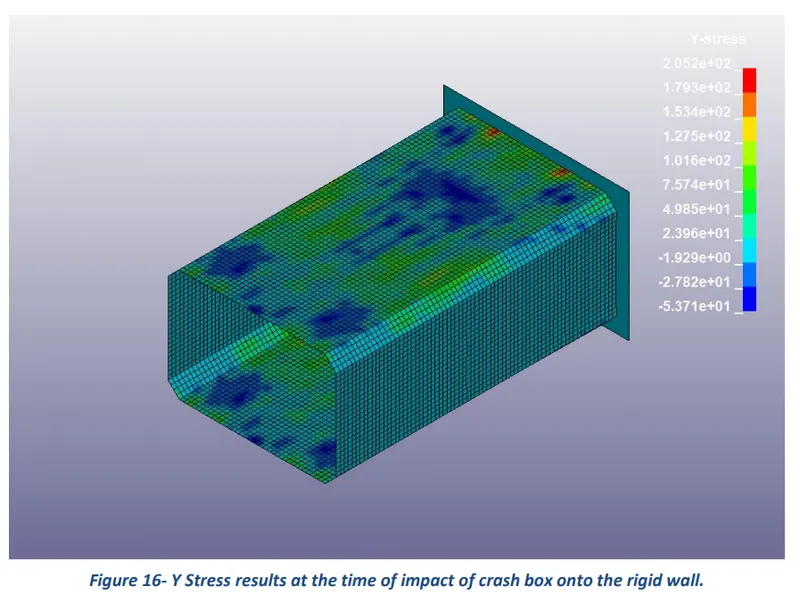
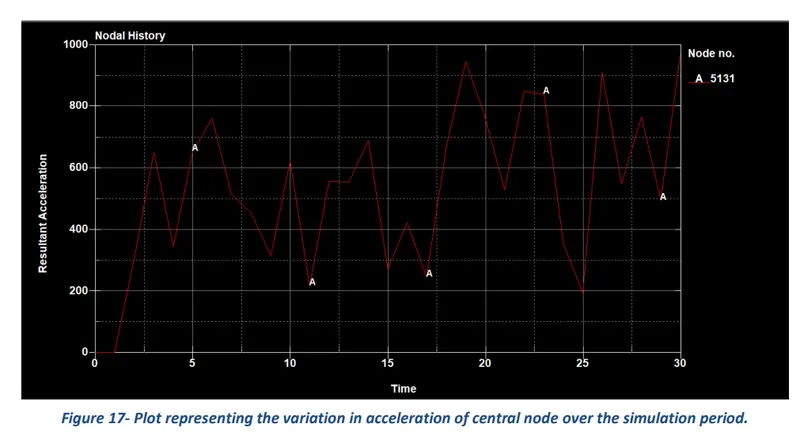
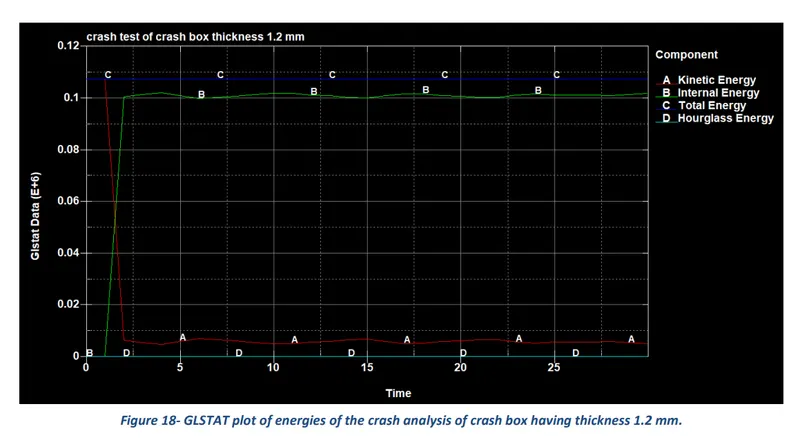
Figures 14-18 represents stresses, nodal acceleration, and energy plots of the crash analysis of a crash box having a thickness of 1.2 mm. The maximum effective stress, max x-stress, and max y-stress were found to be 281.4, 263.6, 205.2 g/(mm* ms^2) respectively. Figure 17 displays the variation in the acceleration of a central node over the entire period of simulation. From figure 18, it can be seen that when the crash box hits the rigid wall, there is a reduction in the kinetic energy of the box while there is an increment of the internal energy of the wall and after that both energies become constant. This validates the principle of conservation of energy which states that energy can neither be created nor destroyed but can be converted from one form of energy to another. Moreover, from the plot it can also be seen that the hourglass energy remains nearly 0 indicating a good selection of both the hourglass and element formulation for the simulation setup.
Results of the crash box having thickness 1.5 mm.
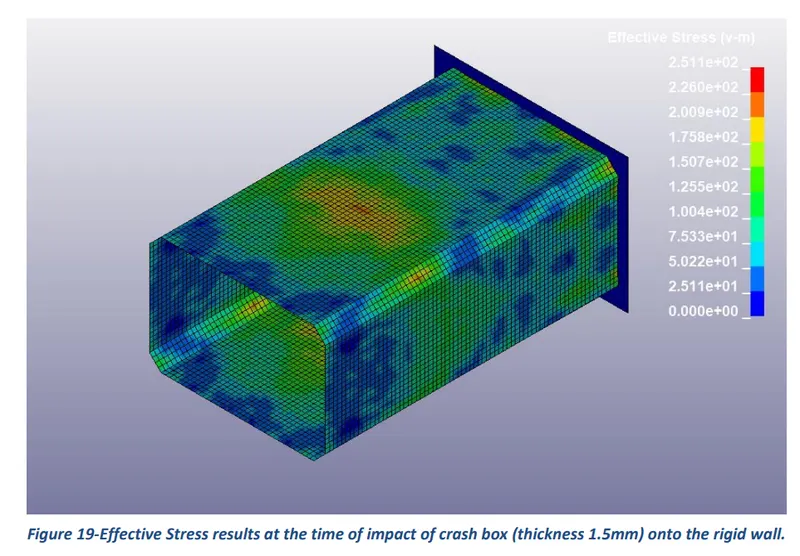
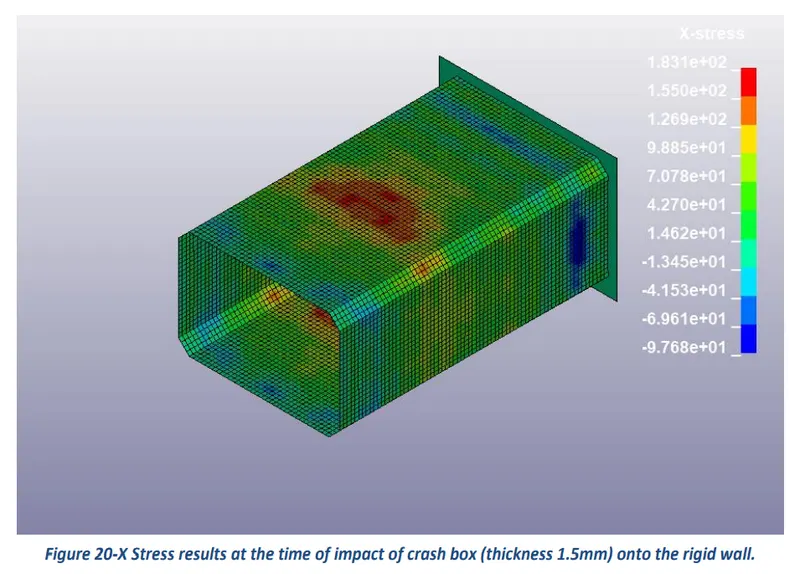
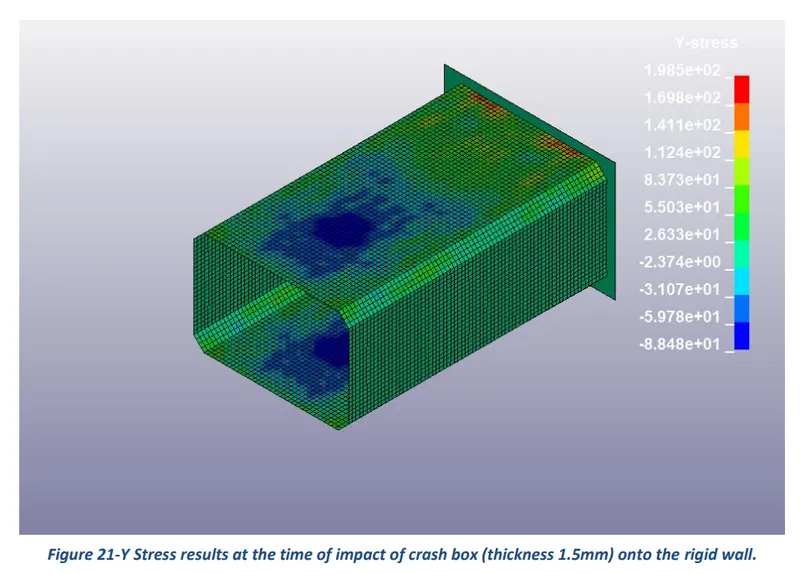
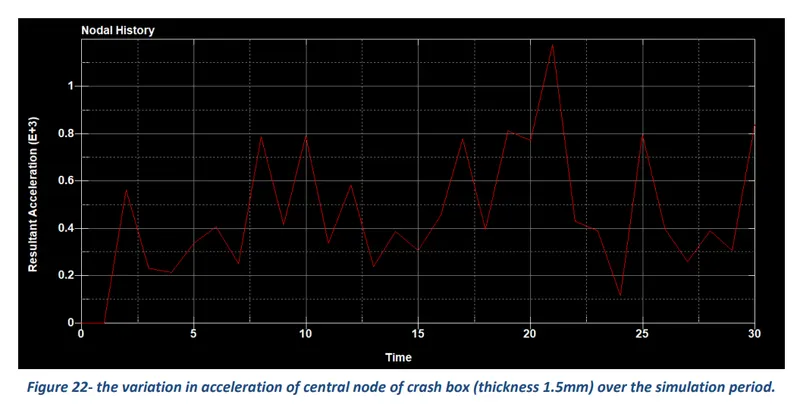
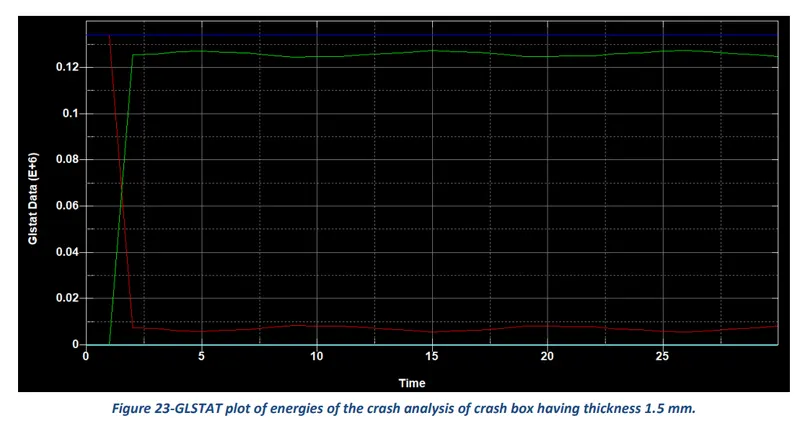
Figures 19-23 represents stresses, nodal acceleration, and energy plots of the crash analysis of a crash box having a thickness of 1.5 mm. The maximum effective stress, max x-stress, and max y-stress were found to be 251.1, 183.1, 198.5 g/(mm* ms^2) respectively. Figure 22 displays the variation in the acceleration of a central node over the entire period of simulation. From figure 23, it can be seen that when the crash box hits the rigid wall, there is a reduction in the kinetic energy of the box while there is an increment of the internal energy of the wall and after that both energies become constant. This validates the principle of conservation of energy which states that energy can neither be created nor destroyed but can be converted from one form of energy to another. Moreover, from the plot it can also be seen that the hourglass energy remains nearly 0 indicating a good selection of both the hourglass and element formulation for the simulation setup.
The following images representing the results of the crash analysis of the two different scenarios.
- Crash box of thickness 1.2mm hits rigid wall and buckles and folds in the axial direction.
- Crash box of thickness 1.5mm hits rigid wall and buckles and folds in the axial direction.
Folding results of the crash box having thickness 1.2 mm.
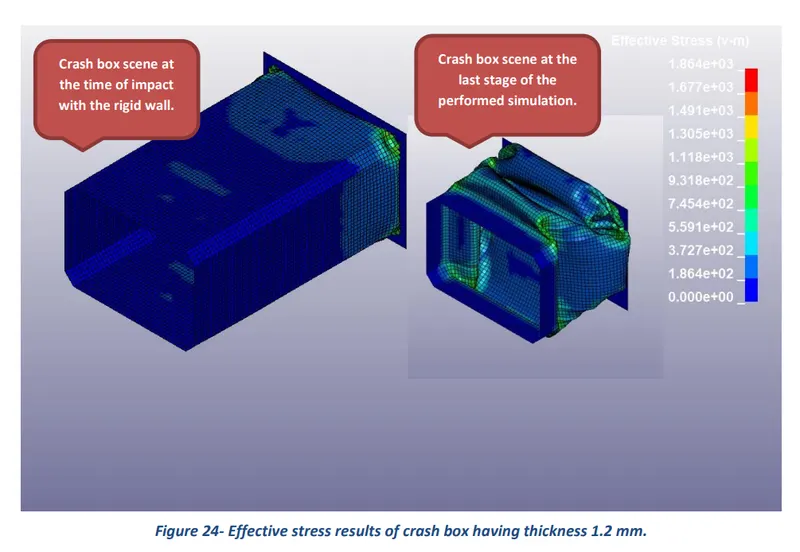
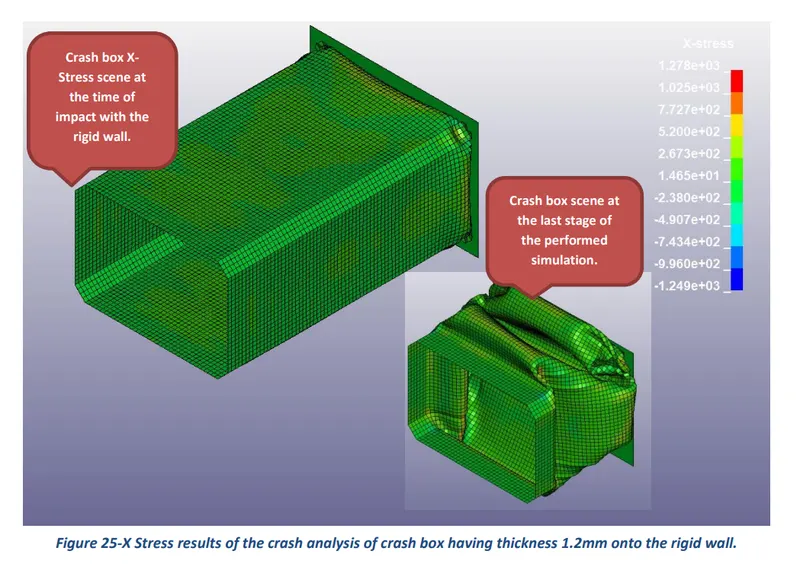
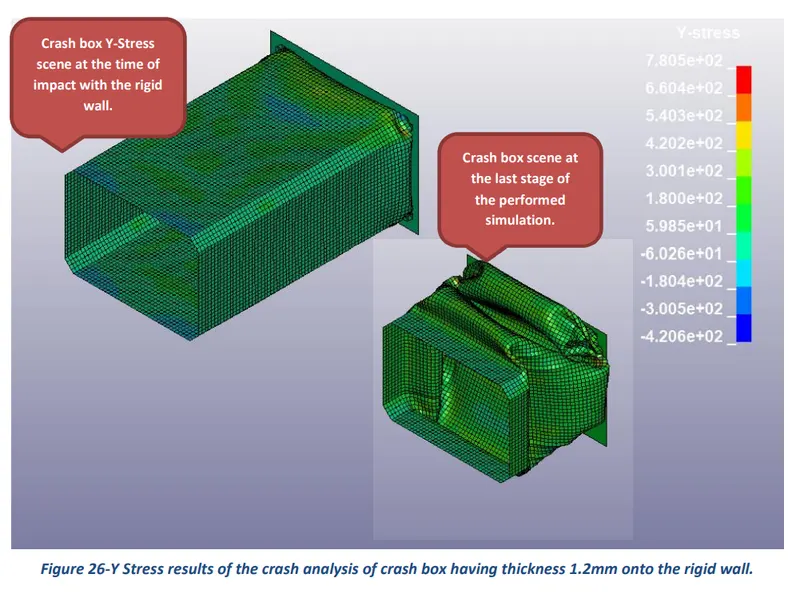
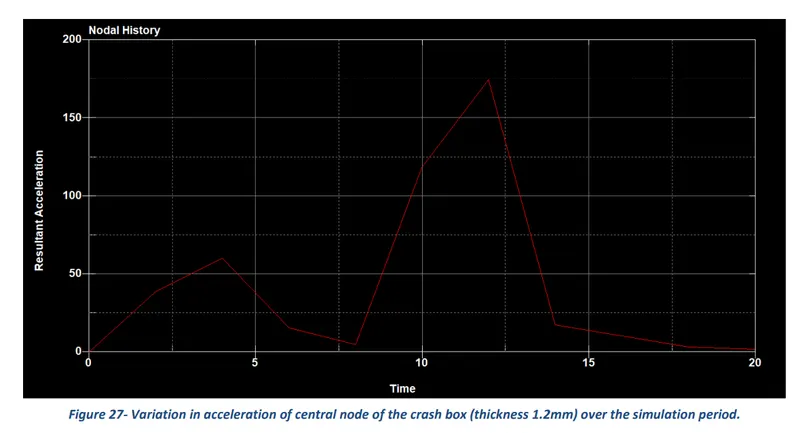
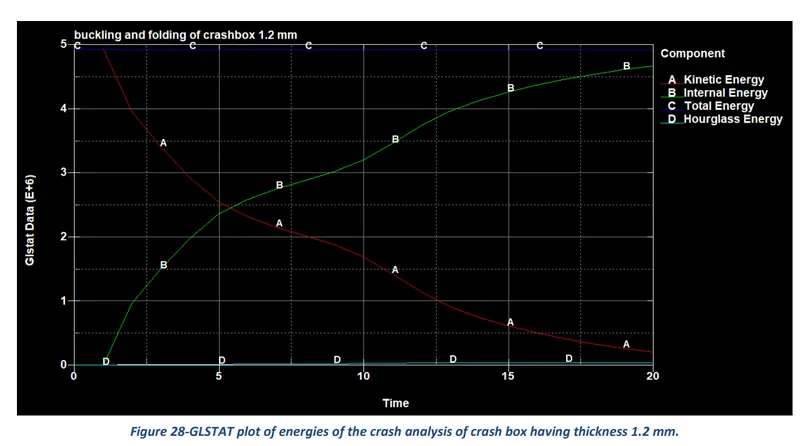
Figures 24-28 represents stresses, nodal acceleration, and energy plots of the crash analysis of a crash box having a thickness of 1.2 mm. The maximum effective stress, max x-stress, and max y-stress were found to be 1864, 1278, 780.5 g/(mm* ms^2) respectively. Figure 27 displays the variation in the acceleration of a central node over the entire period of simulation. From figure 28, it can be seen that when the crash box hits the rigid wall, there is a reduction in the kinetic energy of the box while there is an increment of the internal energy of the wall and after that both energies become constant. This validates the principle of conservation of energy which states that energy can neither be created nor destroyed but can be converted from one form of energy to another. Moreover, from the plot it can also be seen that the hourglass energy remains nearly 0 indicating a good selection of both the hourglass and element formulation for the simulation setup.
Folding results of the crash box having thickness 1.5 mm.
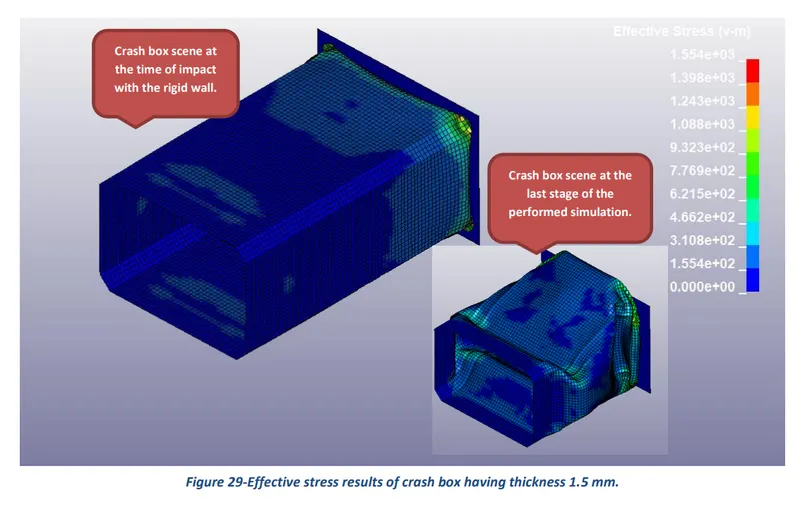
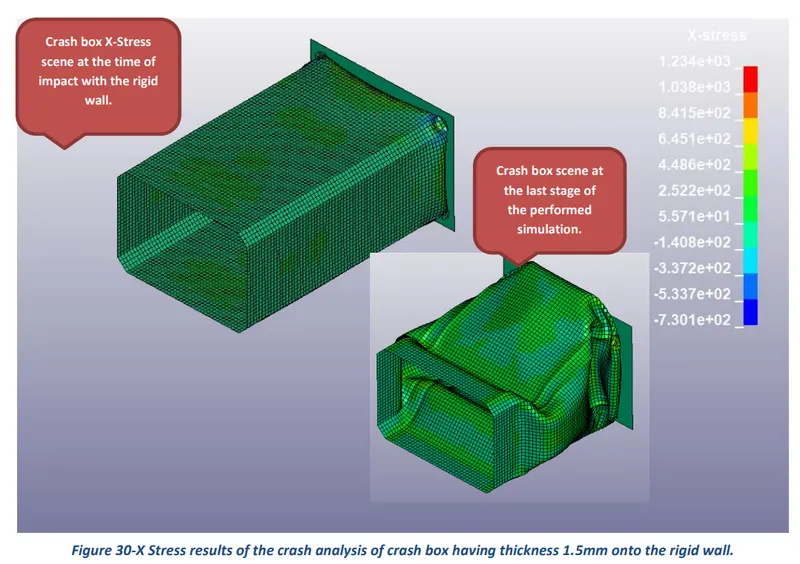
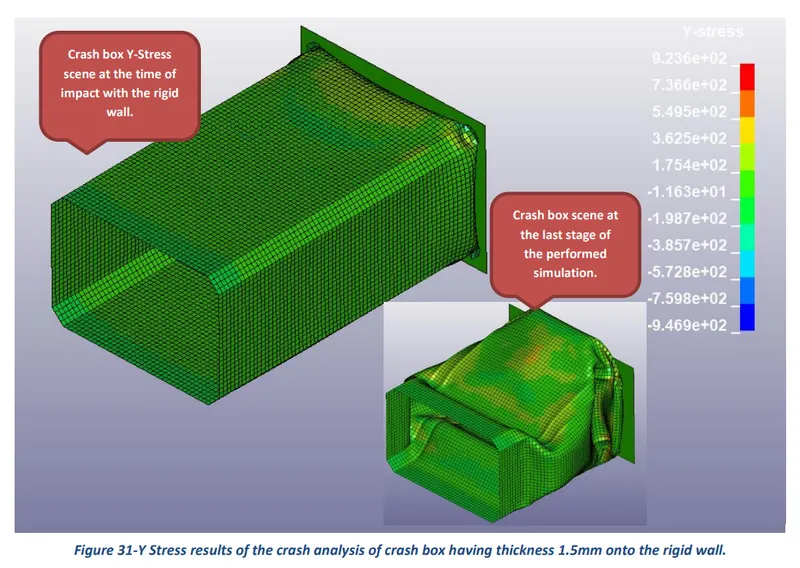
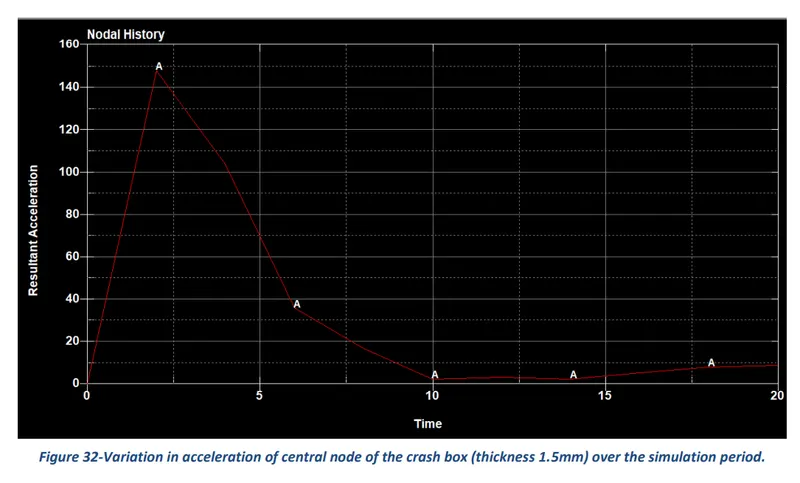
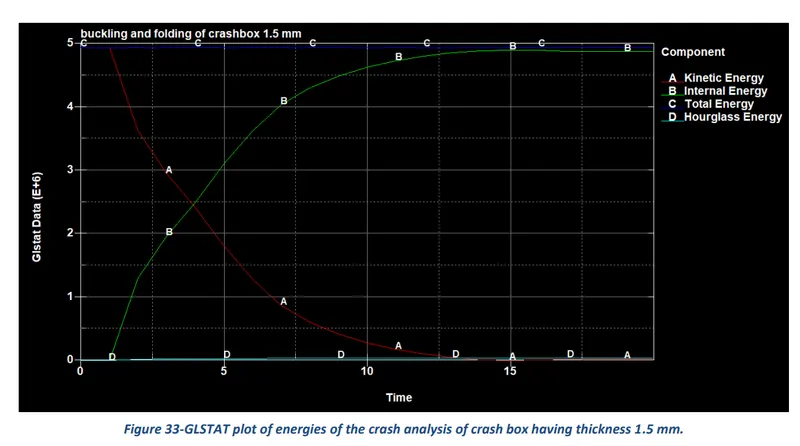
Figures 29-33 represents stresses, nodal acceleration, and energy plots of the crash analysis of a crash box having a thickness of 1.5 mm. The maximum effective stress, max x-stress, and max y-stress were found to be 1554, 1234, 923.6 g/(mm* ms^2) respectively. Figure 32 displays the variation in the acceleration of a central node over the entire period of simulation. From figure 33, it can be seen that when the crash box hits the rigid wall, there is a reduction in the kinetic energy of the box while there is an increment of the internal energy of the wall and after that both energies become constant. This validates the principle of conservation of energy which states that energy can neither be created nor destroyed but can be converted from one form of energy to another. Moreover, from the plot it can also be seen that the hourglass energy remains nearly 0 indicating a good selection of both the hourglass and element formulation for the simulation setup.
5 Conclusion
The main aim of the Week 4 challenge was to create an input deck or setup file to perform the crash analysis of crash boxes with different thicknesses using LS-DYNA software and analyze the behavior of stress-strain and other results while and after the crash boxes hit the rigid wall. The crash simulations of the boxes were performed for two different scenarios; the first case where the crash boxes hit rigid wall and rebounds back completely and the second case where boxes hit a rigid wall and then buckles and folds in the axial direction to come in self-contact. From the GLSTAT plots, it was found that the simulation setup follows and validates the principle of conservation of energy expressing loss of kinetic energy of crash boxes conversely leads to the gain of internal energy of the rigid wall.
6 Appendix
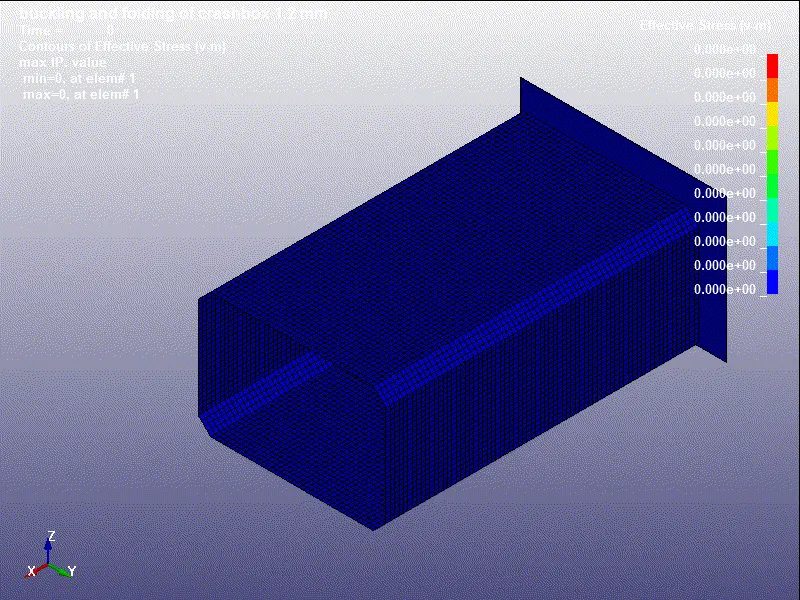
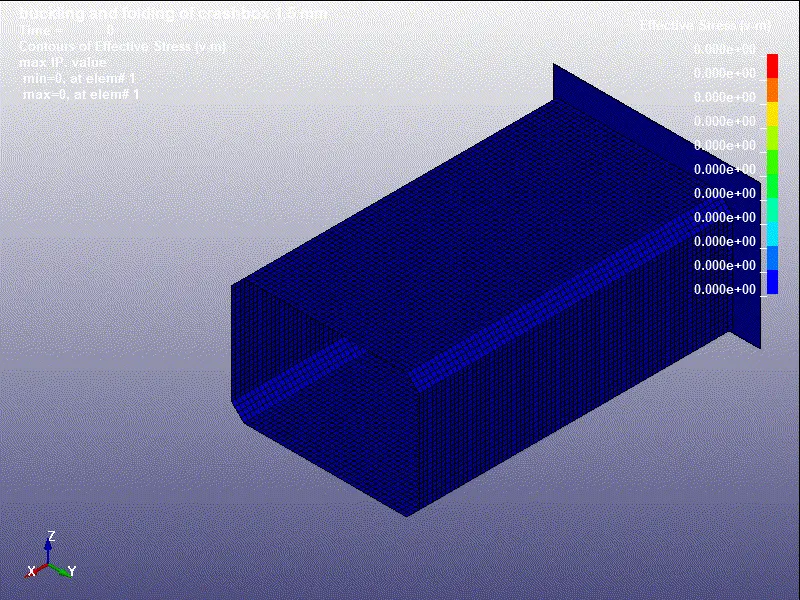
The following GIF files represent an example of the crash simulations performed for the crash boxes of thicknesses 1.2 mm and 1.5 mm respectively. From the following files, it can be clearly seen that the crash boxes hit the rigid wall and buckles and folds in the axial direction.