Week 4 - CHT Analysis on Exhaust port
Goal:
In this challenge
- We will give a brief description of why and where CHT analysis is used.
- We will simulate both fluid flow and heat transfer to the solid, i.e. CHT analysis at the exhaust port
- Then we calculate the heat transfer coefficient through the wall on the inner solid surface and show the velocity and temperature curves in the respective regions.
- Will we verify that HTC's predictions from the simulations are correct? And mention the factors on which the accuracy of the forecast depends.
Conjugate Heat Transfer (CHT) Analysis:
Conjugate heat transfer analysis allows the simulation of heat transfer between solid and fluid domains by the exchange of thermal energy at the interfaces between them and carried by conduction in the solids and additionally by convection in the fluid regions. Conjugate heat transfer analysis can accurately predict heat transfer by simultaneously solving all relevant solid and flow field heat transfer processes. Conjugate heat transfer corresponds to the combination of heat transfer in solids and heat transfer in fluids. Conduction is often dominant in solids, while convection is usually dominant in liquids. Conjugate heat transfer is observed in many situations, for example: conduction through solids, free and forced convection in gases/liquids, and thermal radiation.
Three main methods of heat transfer:
- Conduction is the transfer of heat that occurs when there is a temperature difference across a stationary medium.
- Convection is the transfer of heat between a surface and a moving fluid when there is a temperature difference between them.
- Radiation (thermal radiation) is the emission of energy in the form of electromagnetic waves. In the absence of an intervening medium, net heat transfer occurs by radiation between two surfaces at different temperatures.
Knowledge: - Conduction is the transfer of thermal energy through a solid or fluid by the translational, rotational and vibrational motion of atoms and molecules.
- Molecular collisions transfer energy from more energetic molecules to less energetic ones. Higher temperature = increased atomic/molecular motion
- Conduction occurs in all liquid and solid media.
- Due to the second law of thermodynamics, heat must always be conducted from higher temperatures to lower temperatures.
- Conductivity problems often involve fluid flows at solid boundaries that serve as a mechanism for heating or cooling the solid.
- Conduction is the transfer of energy from more energetic to less energetic particles of a substance through interactions between particles at the molecular level due to a temperature difference.
- The temperature at any point can be associated with the energy of random translational, internal rotational and vibrational motions of gas molecules.
- Molecular collisions transfer energy from more energetic molecules to less energetic ones.
- Higher molecular energies are associated with higher temperatures, and energy transfer always occurs in the direction of decreasing temperature in the presence of a temperature gradient.
- The conduction mechanism is the same for liquids because the molecules are close together and the molecular interactions are stronger and more frequent than gases.
- In the case of solids, conductivity is associated with atomic activity in the form of lattice vibrations. In the case of an electric conductor, the translational movement of free electrons is also involved in the transfer of energy.
- The heat transfer process can be quantified using appropriate rate equations that are used to calculate the amount of energy transferred per unit time.
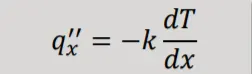
- In the case of heat conduction, the rate equation is Fourier's law. For a one-dimensional plane wall
this is expressed as
- Here,
‐ 𝑞_𝑥^′′(𝑊/𝑚^2) is the heat transfer rate per unit area in the x-direction.
‐ 𝑘 is the thermal conductivity (𝑊/𝑚𝐾) and is a characteristic of the wall material.
‐ The negative sign signifies the fact that the heat transfer is in the opposite direction of the temperature gradient
Convection:
- Convection is the transfer of heat by a combination of volumetric fluid motion and random molecular motion (diffusion).
- Heat is transferred to/from the fluid by conduction on the walls.
- The fluid transfers thermal energy to other parts of the system.
- Heat transfer due only to the mass movement of the fluid (without diffusion) is called advection.
Convection heat transfer can be divided into: - Forced Convection: Flow is caused by external means such as a fan, pump or atmospheric wind.
- Free (or natural) convection: Flow is induced by buoyancy forces, caused by density differences due to temperature changes in the fluid.
- Mixed (combined) coupling: Forced and natural convection can also exist if there are both external driving forces and buoyancy forces.
- Convection heat transfer is rooted in the idea that the rate of heat transfer is proportional to the temperature difference between the fluid and the heated/cooled body.
- This idea is called Newton's law of cooling. The parameter controlling the heat transfer rate is the heat transfer coefficient, usually denoted ℎ.

Here, 𝑞′′ = Convective heat flux
𝑇𝑠= Temperature of the solid surface
𝑇∞= Temperature of the fluid
Heat transfer by radiation:
- Heat transfer by thermal radiation is the emission of energy through electromagnetic waves.
- All matter at non-zero temperature emits thermal radiation.
- This emission is caused by changes in the electron configurations of atoms or molecules, and the energy is transported via electromagnetic waves (or photons).
- The intensity of radiation depends on body temperature and surface properties.
- Unlike conduction or convection, radiation does not require the presence of a material medium and can occur in a vacuum.
- Radiation is an important mode of heat transfer at high temperatures.
- It is also the only way to transfer heat in space, and that is how solar energy reaches the Earth.
- Heat transfer in solids and heat transfer in liquids are combined in most applications. This is because fluids flow around solids or between solid walls and because solids are usually immersed in a fluid. Accurate description of heat transfer regimes, material properties, flow regimes and geometric configurations enables the analysis of temperature fields and heat transfer. Such a description is also the starting point for a numerical simulation that can be used to predict the effects of conjugate heat transfer or to test different configurations to, for example, improve the thermal performance of a given application.
Introduction :
Here our goal is to simulate the flow through it, as the flow passes through the pipe it will exchange heat with the solid, we want to simulate this process. We're going to do this by initially assuming that the flow is coming through the exhaust, which is essentially through all four inlets, and we're going to assume, or we're going to assume that the fluid is really very hot, and that's going to heat the solid tube from the inside and the outside surface, we're going to assume that it is a certain heat transfer. real world scenario because your engine is air cooled because it is exposed to air and the air that is near the port has a special heat transfer coefficient and that would be provided as an input and that value depends on the external air number. We can simulate it and find the value, but here we just give the value as input, i.e. the heat transfer coefficient for the outer wall boundary condition. Then, taking these assumptions into account, we start the simulation.
Solution procedure :
-
We wil simulate both fluid flow and also the heat transfer to the solid i.e., CHT Analysis on an Exhaust port with the steady state .Then for solving we follow the below procedure :
1)Geometry setup
2)Meshing
3) Problem setup
4)Solving
5)Post processing
- Then we calculate the wall/surface heat transfer coefficient on the internal solid surface & show the velocity & temperature contours in appropriate areas.
Flow simulation using Steady case:
On the ANSYS desktop, we first open the module smoothly by dragging and dropping. We follow the above procedure
1) Geometry settings:
- In the fluid module, we need to open spaceClaim and import the geometry.
if you look closely at the geometry, it has a solid part. So first take the volume of liquid. That's what we have to go for
prepare -> extract volume -> select edge selection -> then select all input and output edges -> then click ok. The volume of fluid is created. - Then after creating the volume then in the design change the name of the components i.e. fluid volume to fluid and solid volume to solid.
- Then when you open the mesh and mesh you will see that the mesh is fine, but when you zoom in on the inputs or outputs you will see that the mesh is non-conforming, meaning that one particular solid part vertex is not exactly connected to a fluid vertex or feature. And if you have a conformal mesh, i.e. when the edges are precisely connected, then only heat will transfer smoothly. You can also see a physical gap if there is a non-compliant network. For CHT simulation we should not have such kind of meshes, we need to have both volumes perfectly overlapping to correct that we need to share topology.
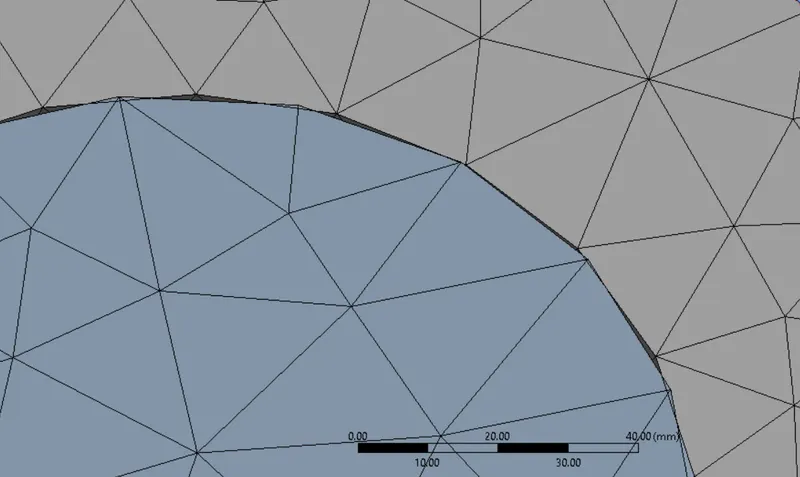
- To make it all work as a single component, we need to make sure that the sharing topology is set to sharing. Only then will these two individual blocks exchange information, i.e. the networking will be uniform and with perfect connectivity. need to fix it.
- To enable the properties to share for the sharing topology, but before that we need to do an important step that we will follow. We need to take two volumes and move to a new component, and this is the final geometry, which consists of a solid volume and a fluid volume, and then delete the old empty components. Now enable the sharing topology, and then go to the workbench and click on sharing. This it's very important if you don't do this step you won't see a single interface between them. So this particular step will take care of creating an interface so you will have a single interface between the solid volume or block and the fluid block. Once you've done that, you'll see pink circles on the interface that basically tell you where things are being shared. Basically, this means that you will have sharing between the inner wall of the solid and the outer layer of the liquid will have a common interface and the sharing boundary is one. This is only the interface you will see.
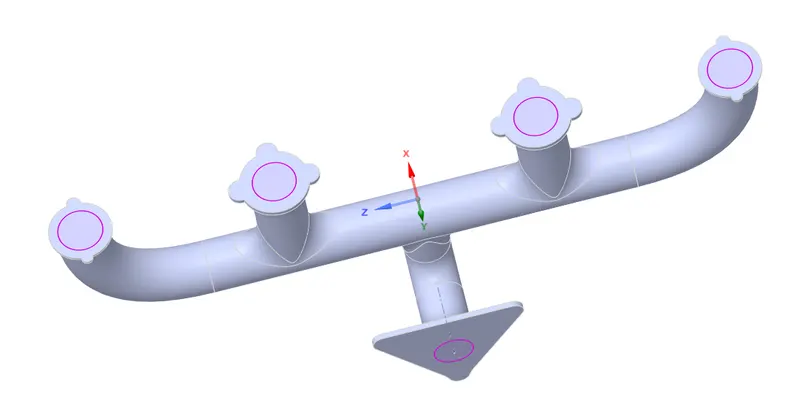
- Now when you open the networking and see that there is perfect network connectivity and the interface is perfectly shared. This is exactly how we need to create networks for CHT simulation.
This completes the creation of the geometry. Then we close the Claim space, the procedure is automatically saved.
2) Meshing
- For meshing, we open meshing where we mesh our model so we can use it to solve our model.
In general, it is always a good idea to name the surfaces before creating the mesh. So let's do it.
First we select an entity using entity selection using surfaces so we can enter a name for our entity selection.
steps : select the edge you want to name with edge selection -> then press N -> name the selection. - In a similar way we will name our inlets, outlets and for the outer wall just double click on the outer part anywhere and the ANSYS mesh will automatically select the walls we want and we will name it outer convection wall (because we will be using convective BC for that) and you can see the other walls, such as flanges that have not been selected you can name them or even if you don't what the ANSYS mesher will do is automatically import them into the seamless as a wall by default these walls will have adiabatic BCs which is exactly what we want.
Then the next thing you need to do is create a network. We click on the mesh option in the side window and create a baseline mesh. Then we refine the network. Let's make a mesh on the geometry. Once the network is done, we need to see what stuff we have. to specify. Let's elaborate one by one. Let's start by creating the inflation layer.
a) Inflation:
- The inflatable layer helps us create a body-conforming mesh. This means it will create a mesh layer the same as the geometry.
- Since this is very important at the interface and we want to calculate the heat transfer at this location, we need to take this area and create inflation layers so that the flow is accurately captured and the values are calculated accurately.
- To do this, we first select the fluid part and name it the inflatable layer.
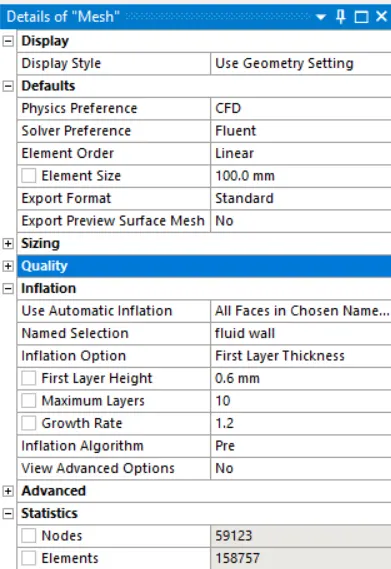
- In the global mesh select the inflation option and in that to use automatic inflation - select all faces in the selected named selection and for named selection - select the inflation layer we just named.
- And for the inflation option we use the thickness of the first layer and give it based on the y+ value and the turbulence model we are using. Here we are using the k-omega SST turbulence model, so y+ should be between 0.1 and 5. Let's calculate the thickness of the first layer.
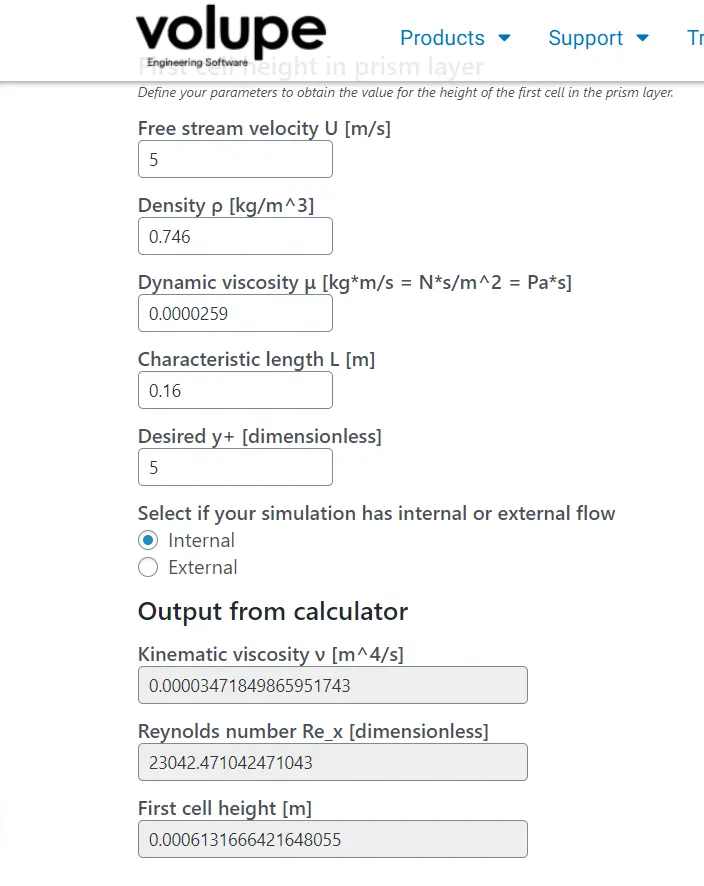
- Now we got the first layer thickness ,let us give the above first layer thickness and maximum of 10 growth layers and with a growth ratio of 1.2 for inflation layers.
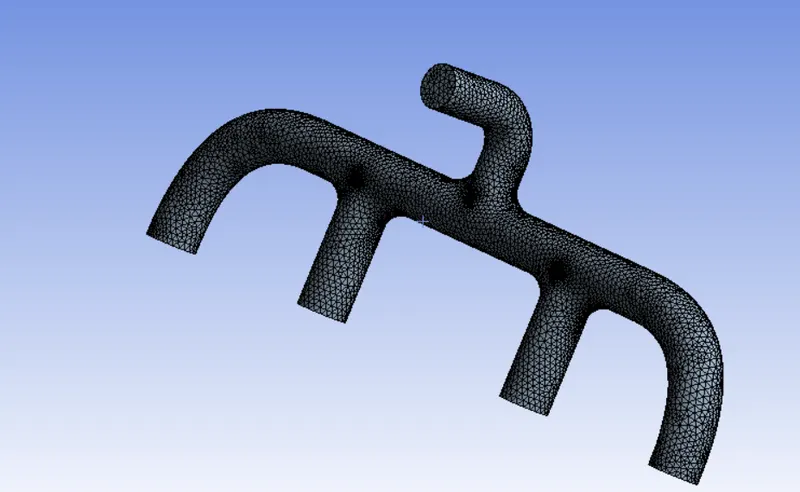
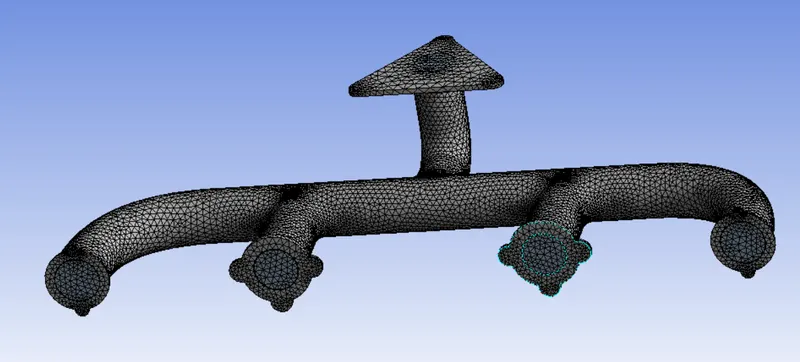
- Clear the generated data and we have to mesh again.By this we have completed the meshing process then we have to update or generate the mesh again.You can observe formation of inflation layers.
3) Problem Setup :
- To set up our problem we open Fluent and setup inital conditions , boundary conditions material etc.,
- We first start with checking the mesh quality using perform mesh check under domain.If no error is seen in console window then we can proceed further.
- Then we move move to setting up physics where we select the solver ,viscous model ,initial and boundary conditions etc.,
- We use a steady state pressure based solver to solve our model.
Physics :
General :
Solver type : pressure based
time : steady state
velocity formulation : absolute
models :
viscous model : k-omega SST
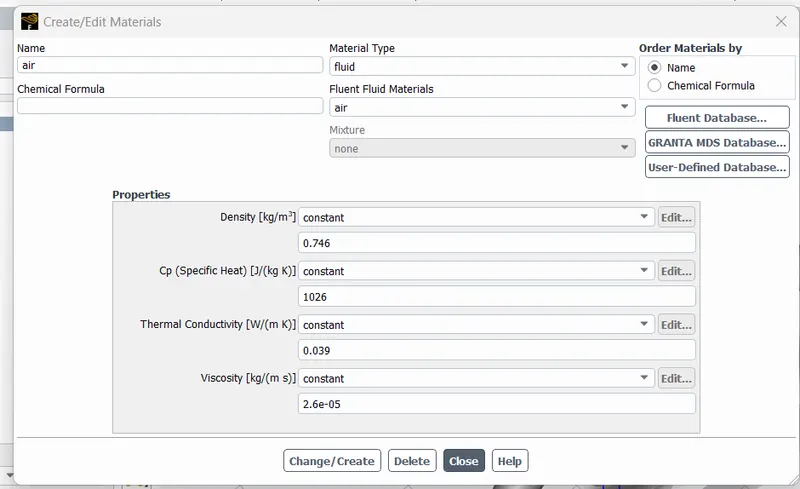
Material : Fluid : Air
Solid : aluminum
Zones :
Cell zone : In cell zones you will see fluid volume,it is of type fluid with material air and solid volume it is of type solid with material aluminum.
Boundary conditions :We will basically give our boundary conditions here such as inlet velocity and outlet conditions.
Inlet :
velocity : 5 m/sec
temperature : 700K
Outlet :
pressure outlet : gauge pressure = 0 pa
Outer wall convection :
type : wall
Theremal conditions => convection : Heat transfer coefficient = 20 W/m^2 K
4) Solving :
- Give number of iterations such that your solution is converged.
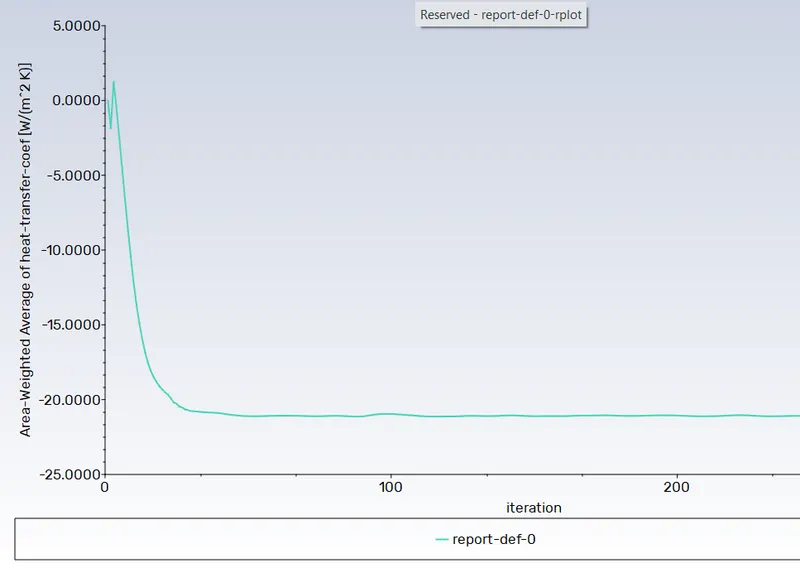
- Run the simulation until the steady state is reached. Lets run for 200 iterations ,we can find the solution is converged.
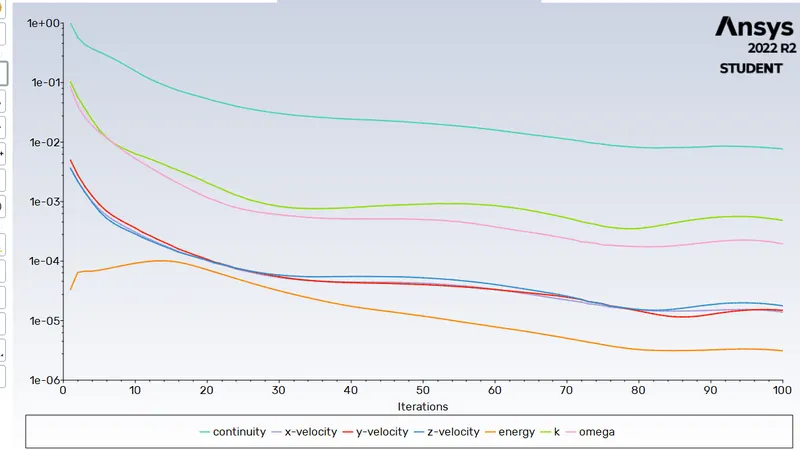
- Then we can see that in the residual plot that residuals dropping and reach a steady state after 100 iterations.
- Then we post process the results.
5)Post processing :
Residuals plot :
Heat transer coefficient plot
Temperature contour :
- The below plot is the temperature contour on exhaust port
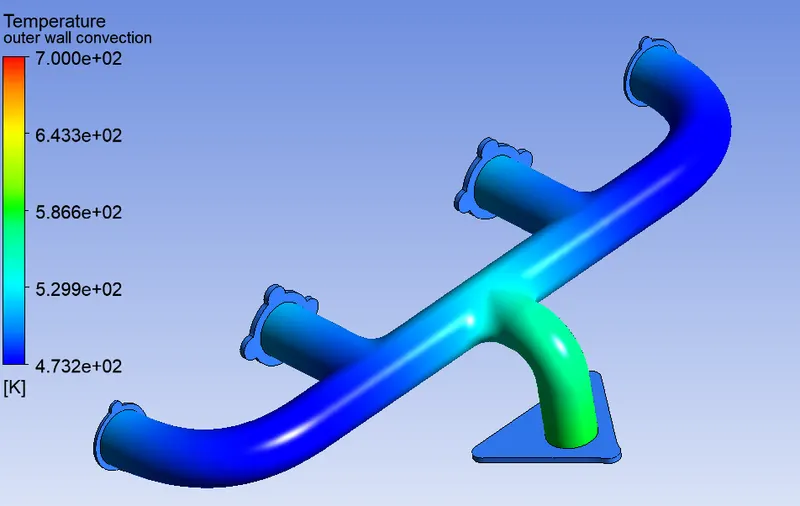
Then when you think about the results that we have, the idea is simple, there's hot exhaust coming in that's at a very high temperature of 700K, then if you look at the temperature of the solid metal near the inlets, the temperature is 474K, but if you check where all pipes meet around 557 K. Now you would assume that the temperature of the solid is high at the inlet because the liquid is entering there at a high temperature, but in fact it is not, the high temperature is at the outlet pipe because of convection. Use the streamlines to explain more about it.
Streamline plot :
- Here in the below streamline plot you can see that streamlines coloured with velocity.
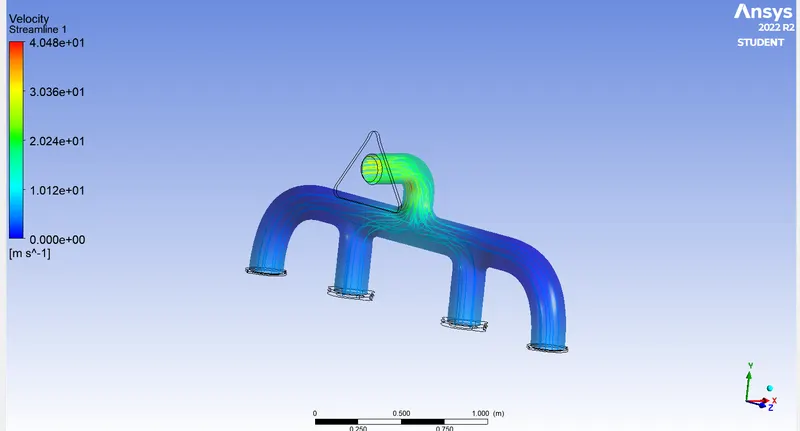
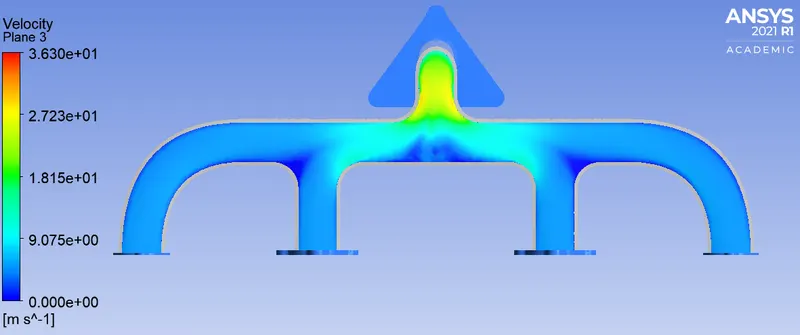
You can see that the velocity is low at the inlets compared to the outlet, this is due to conservation of mass, i.e. you have a specific mass flow rate at each inlet and all these inlet averages are very similar, so we can say that the velocity from all inlets is almost the same and since A*V is the volumetric flow rate and since there are four inlets and one outlet and all that incoming air has to flow out through one outlet, that means the air velocity is going to be very very high at the exit pipe and now because of that higher velocity the Reynolds number is going to be higher , which means a higher heat transfer coefficient, which means there will be a higher heat transfer from the fluid to the solid. and therefore the temperature of the solids at the outlet is higher.
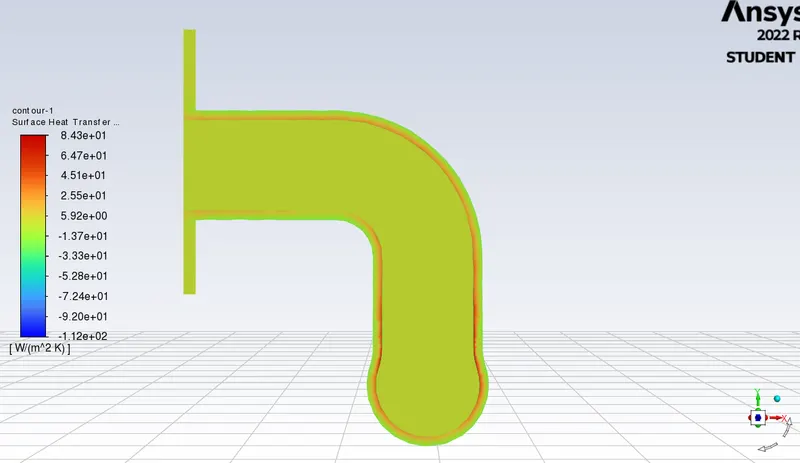
Now we put a plane on the outlet to represent the coefficient of heat transfer through the wall, i.e. it is a quantity that is calculated only on the outlet walls adjacent to the liquid, and if you see this contour in the figure below, you will see that the heat transfer is high in the curved part of the outlet tube , this is because where the velocity is also the highest, in other words, if we plot the velocity contour in the same plane of the section, you will see that the velocity is the highest in the curved part, so that is why the heat transfer coefficient is the highest at that point . Because the fluid is hot, this is where the maximum heat transfer from the fluid to the solid occurs, resulting in a higher temperature of the solid at that location.
Velocity contour :
- In the below contour you can see the velocity is higher in the outlet pipe than inlet pipe.
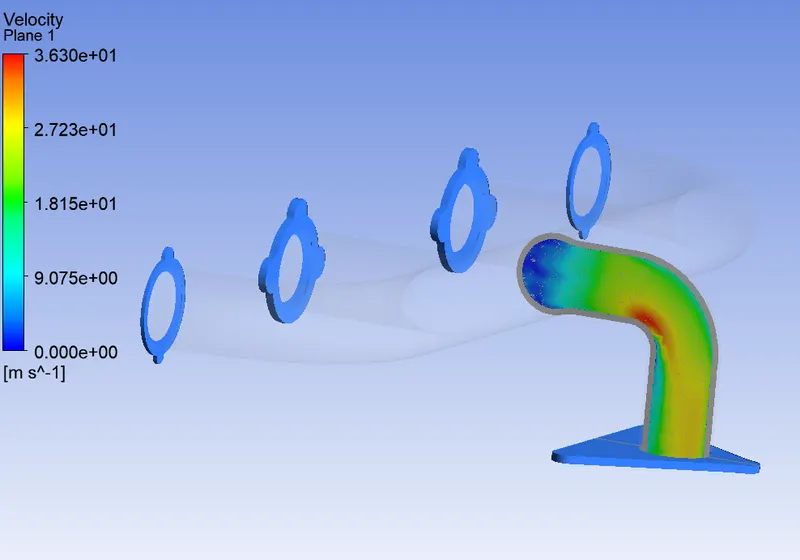
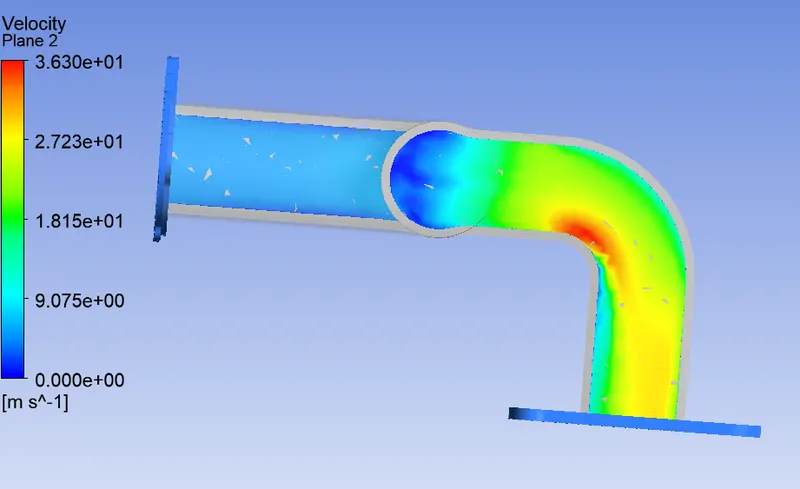
- In the below contour you can see clearly how the velocity is varying while fluid is approaching from inlet pipe to outlet pipe.
Surface Heat transfer coefficient contour :
- In the below contour you can see the heat transfer coefficient is high in the outlet pipe than in the inlet pipe,So thats the reason for high temperature in the outlet pipe than at the inlet.
Verifying the HTC predictions from the simulations :
- The Nusselt number is the ratio of convective to conductive heat transfer across a boundary.

- where h is the convective heat transfer coefficient of the flow, L is the characteristic length, k is the thermal conductivity of the fluid.
- Then this Nusselt number is related to Reynolds number i.e.,

- Where ,

and u is the flow speed (m/s)
So if you observe that the heat transfer coefficient is directly proportional to the Reynolds number (also velocity). Therefore, if you increase the speed, the convection heat transfer coefficient will increase. That's what we've done above, and if you want, you can run another simulation by increasing the Reynolds number of the flow, then you'll see an increase in the overall heat transfer coefficient by convection or at a certain location than at the previous low Reynolds number. simulation.
Factors on which the accuracy of the forecast depends:
- The factors on which the accuracy of the forecast depends are
We need to make sure that the sharing topology is set to sharing. Only in this way will the networking be uniform and with perfect connectivity. - We need to choose an accurate turbulence model. Since this is a wall-bounded flow, k-omega SST will be very suitable. And when choosing a turbulence model, it is also important to choose the exact value of Y+.
- We need to enable desktop sharing (preparing to share) and click sharing. This is very important, if you do not do this step, you will not see a single interface between them. So this particular step takes care of creating the interface so you will have one interface between the solid volume or block and the fluid block.
- We need to enter the exact heat transfer coefficient for the outer boundary. Only then will we get the overall exact solution.
- When entering values, such as for inflation layers or any other values with decimal values, be sure to specify the exact values or it may result in a rounding error.
- Because it is very important at the interface, because we want to calculate the heat transfer at this place, we need to take this area and create inflation layers so that the flow is accurately captured and the values are calculated accurately.
Discussion:
In the third and fourth images of the speed distribution, the maximum speed can be seen in red near Turin, where the pressure dropped due to the sudden turn of the airfoil and a low pressure area formed after the maximum speed area.
In a similar way, in the first picture, the low pressure area was seen in dark blue between the ports and the low temperature can be seen in the same place in the temperature distribution graph. The temperature begins to drop towards the outlet of the exhaust port as heat is transferred from the walls of the exhaust port as well as air from low pressure areas in the exhaust port where the cooler air mixes with the hot air.
The last figure show the heat transfer coefficient. The heat transfer coefficient is visible only in the first layer of inflatable layers. This is why in the second image the area has been zoomed in to make it visible.