Week 6 - Data analysis
I.AIM:
WRITING A PYTHON PROGRAM TO READ THE MOTOR PARAMETER DATA FILE AND EXECUTE
MANDATORY OBJECTIVES
II.OBJECTIVE:
1. Reading data from the given data file.
2. To take a file name as input from the user and check if the file is present or not.
3. Draw a graph between 2 parameters given by the user as input.
4. Perform a basic power calculation by calculating the area under the P-V diagram, the power of this engine and the specific fuel consumption.
III. PROBLEM STATEMENT :
Read the data from the given file named 'engine_data.out' using python, plot the curve between 2 engine parameters (parameters given by the user as input) and do a basic power calculation by calculating the area under the P-V diagram, the power output of that engine (assume that the rpm is 1500) and the specific fuel consumption (the engine consumed 20 micrograms of fuel (per 1 stroke cycle)).
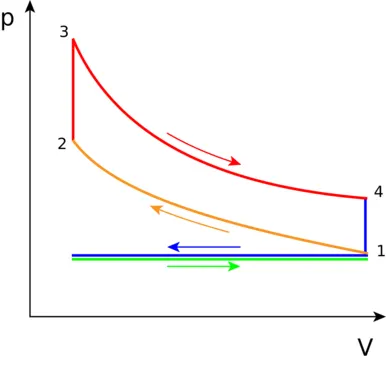
The various processes seen above can be combined to create cycles found in most internal and external combustion engines. These diagrams are showing how pistons in engines (powered by fuel) or the various processes in a power plant, change the volume and pressure of a working fluid (ex. steam water for turbines, fuel-air mixture for engines) to create work. Then this work can be used to create electricity or move a vehicle. The work done would be calculated by finding the area inside the closed cycle (ex. the yellow shaded area of the Rankine cycle below).
Formulae
WORKDONE=area under the curve of PV diagram
Power=area⋅n⋅Power=area⋅n⋅10^6WW
where,
n=speed of the engine`=(N/(2*60))` for 4-stroke engine
n=`=(N/(60))` for 2-stroke engine
Specific Fuel Consumption(SFC)=`(Fuel consmed kg/hr)/(power output kW)`
IV. METHOD:
*Initially, we will import the "matplotlib.pyplot" and "numpy" libraries to plot the graph and calculate the values.
*To resolve the above issue, follow these steps:
*Using the python program, initially the name of the data file is taken as input from the user and checked whether the file is present or not, if the file is not present, the program exits.
*Then the file is opened and the data is read line by line and saved.
*The names of the parameters, their units and their number of columns are stored as arrays and displayed in the form of a table so that the user can select the required columns.
*Then column no for independent parameter (x-axis) and dependent parameter (y-axis) is taken from the user and the values of these columns are extracted from the data file and further plotted.
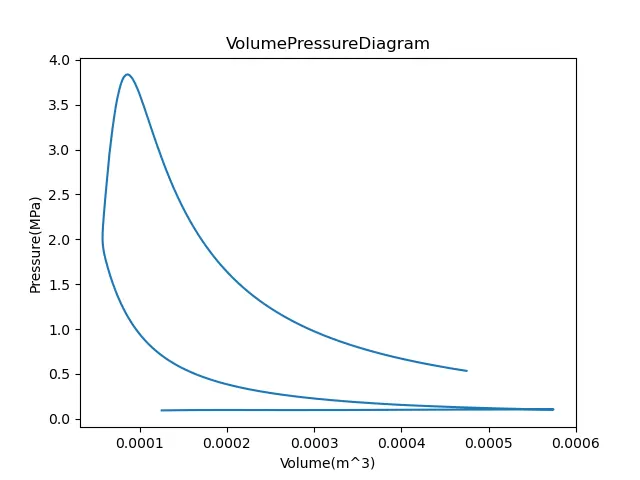
From PV diagram Area under P-V curve is calculated using trapezoidal rule As we know Area under P-V diagram is equal to work done
*In the next step, work was done, which is calculated and used to calculate power
Power = Work *Speed
Specific fuel consumption = weight of fuel consumption per hour/power developed in kW
"""
data analysis programe
by shiek hafeez
"""


# IMPORTING IMP MODULE
import math
import numpy as np
import matplotlib.pyplot as plt

#Taking inputs from user
file_name=input("Enter file name :")
print('file_name')
#checking for valid file
if file_name == 'engine_data.out':
    print('File found succesfully!! you may continue...n')
else:
    print('File not recognized. Please provide a valid CONVERGE output file')
    exit()


print('Information about input parameters')


pressure=[]
temperature=[]
volume=[]
column_name=[]
column_units=[]

#data parsing
count_data=1
for line in open('engine_data.out'):

    if '#' not in line:

        count_data=count_data+1


    else:
        count_data=count_data+1
        if count_data == 4:

            column_name=line.split()
            print(column_name)
        elif count_data==5:
            coulumn_units=line.split()


#inputs
nx = int(input("Please enter the x-axis data of column(1-17) 1.Crank to 17.Dynamic Viscosity"))
print(nx-1)

ny = int(input("Please enter the y-axis data of column(1-17) 1.Crank to 17.Dynamic Viscosity"))
print(ny-1)

print('the plot is',column_name[ny],"vs",column_name[nx])
data_array_x=[]
data_array_y=[]


for line in open('engine_data.out'):

    if '#' not in line:

        data_array_x.append(float(line.split()[nx-1]))
#print(data_array_x)


for line in open('engine_data.out'):

    if '#' not in line:

        data_array_y.append(float(line.split()[ny-1]))
#print(data_array_y)


#plotting the data
plt.plot(data_array_x,data_array_y)
plt.xlabel(column_name[nx]+coulumn_units[nx])
plt.ylabel(column_name[ny]+coulumn_units[ny])
plt.title(column_name[nx]+column_name[ny]+'Diagram')
plt.savefig(column_name[nx]+'VS'+column_name[ny]+'.png')
plt.show()


for line in open('engine_data.out'):

    if '#' not in line:

        pressure.append(float(line.split()[1]))
        volume.append(float(line.split()[7]))

#calculating area under the pv curve
work=[]
for i in range(0,8664):
    work.append((volume[i+1]-volume[i])*(pressure[i+1]+pressure[i])*0.5)

work_done=0
for j in range(0,len(work)):
    work_done=work_done+work[j]
    work_done1=work_done*1*1e6
print('Workdone is',work_done1,'j')


area=np.trapz(pressure,volume)
#print('the total area under the curve is',area,'m^2')

#calculating power output of the engine
rpm=1500
power=area*1e+06*rpm/9550
print('The power output of the engine is',power,'KW')

#calculating Specific fuel consumption
fps=20*1e-06
mass_flow_rate=2.99*1e-10
SFC=mass_flow_rate*36000/power
print('The specific Fuel Consumption is',SFC,'g/KW hr')
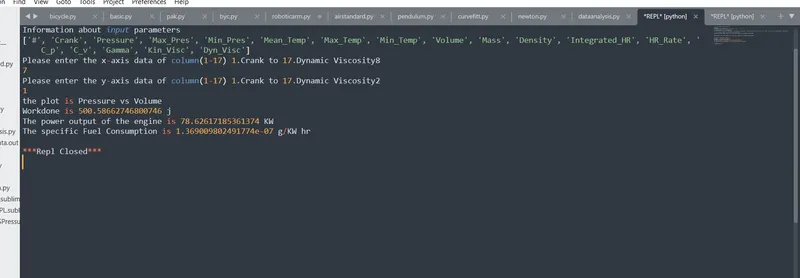
output:-

PLOTS
PV diagram
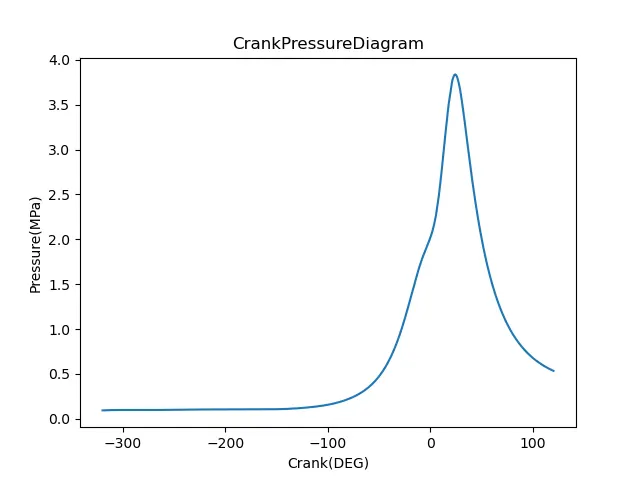
crank pressure diagram
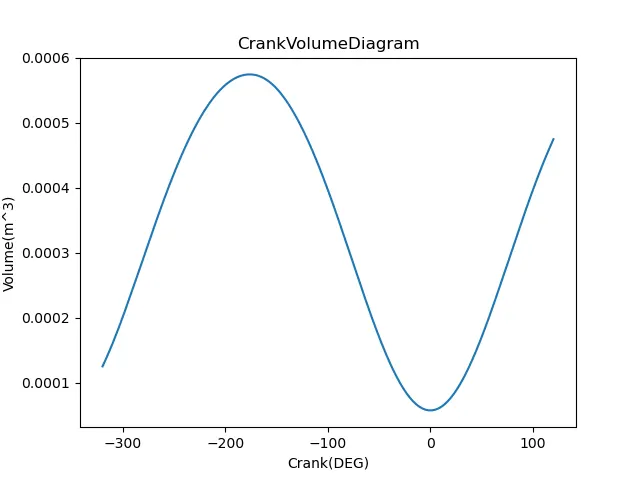
crank volume diagram
crank mean temp diagram
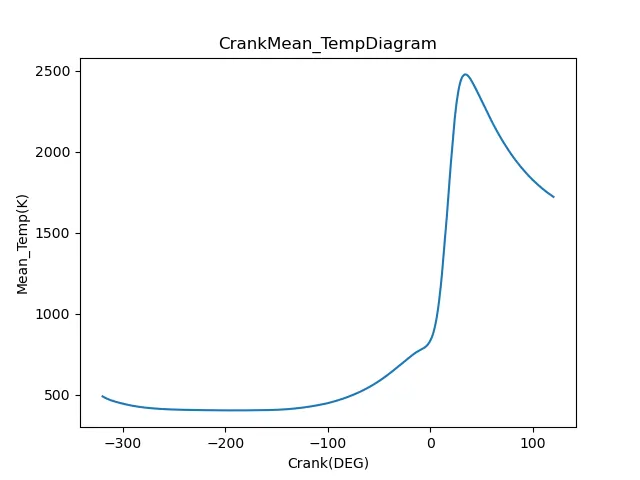
Result window
CONCLUSIONS
The area under the curve of the PV diagram is calculated. We know that the area under the pv diagram is complete.
Specific fuel consumption (SFC) and engine power were also calculated.
The data visualization appears in the output window.