Week-4 Challenge WOT Condition Part-2
Q.1:What is the difference between mapped and dynamic model of engine, motor and generator? How can you change model type?
| Mapped Model | Dynamic Model |
|
Implementation: Model uses a set of steady-state lookup tables to characterize engine performance. The tables provide overall engine characteristics, including actual torque, fuel flow rate, BSFC, and engine-out exhaust emissions. |
Implementation: Model decomposes the engine behavior into engine characteristics that are separated into lower-level components. By combining components in this way, the models capture the dynamic effects. |
|
When to Use:
|
When to Use:
|
To change model type:
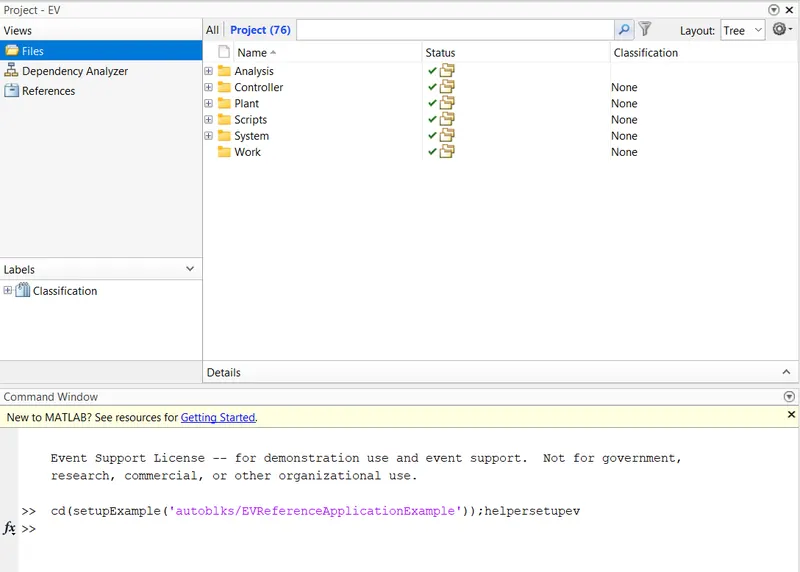
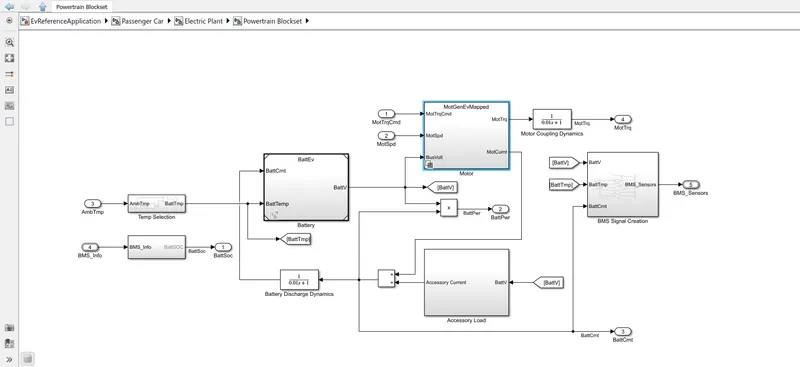
Opening EVReferenceApplication.
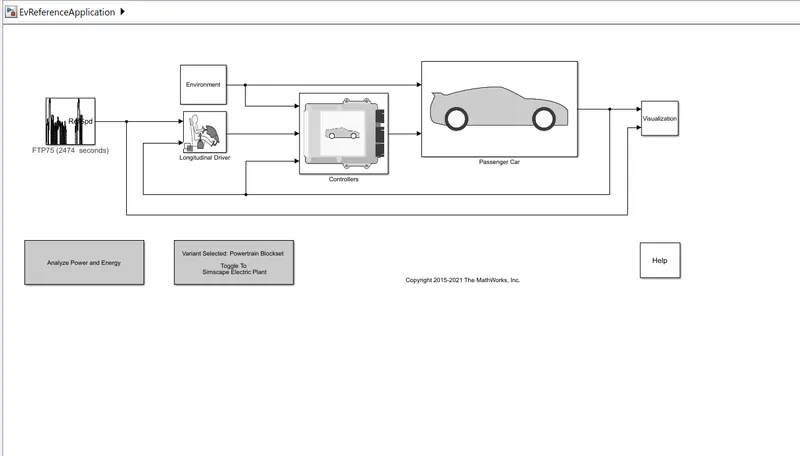
Opening Passenger Car.
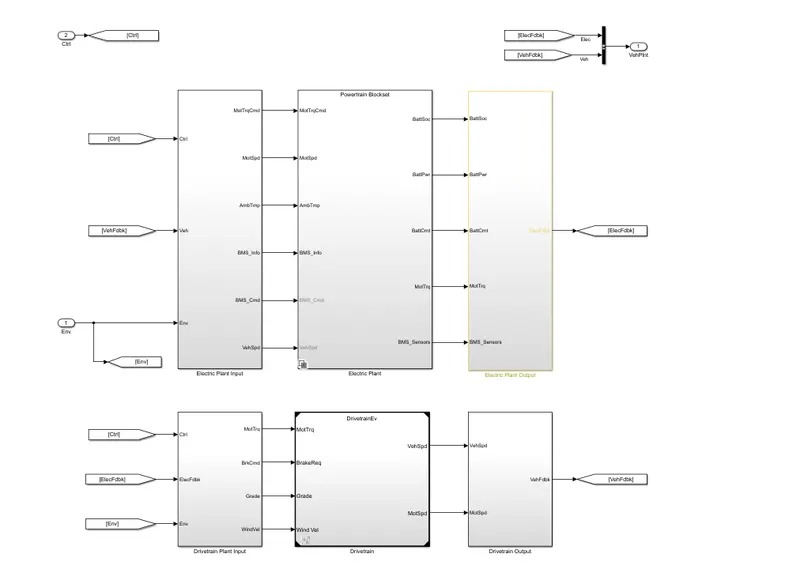
Opening Electric Plant.
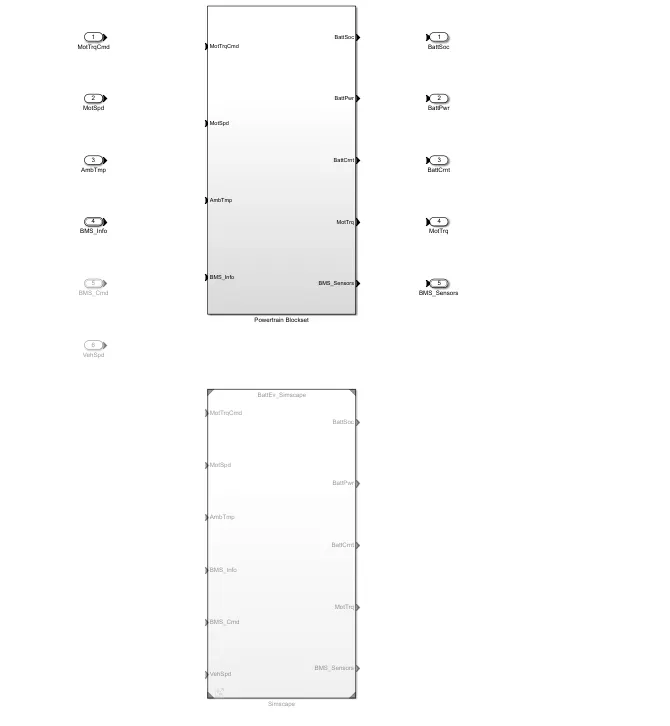
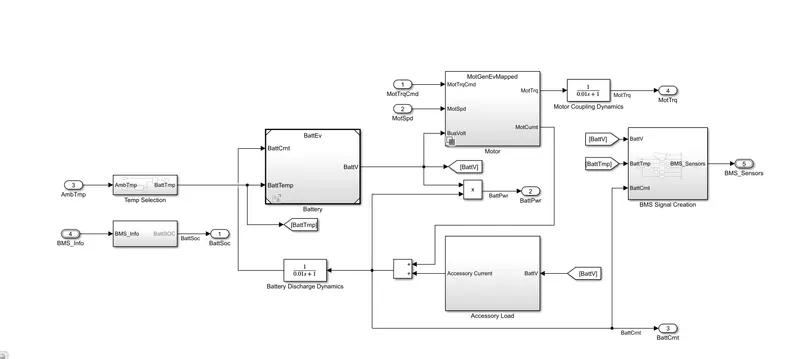
Opening Motor.
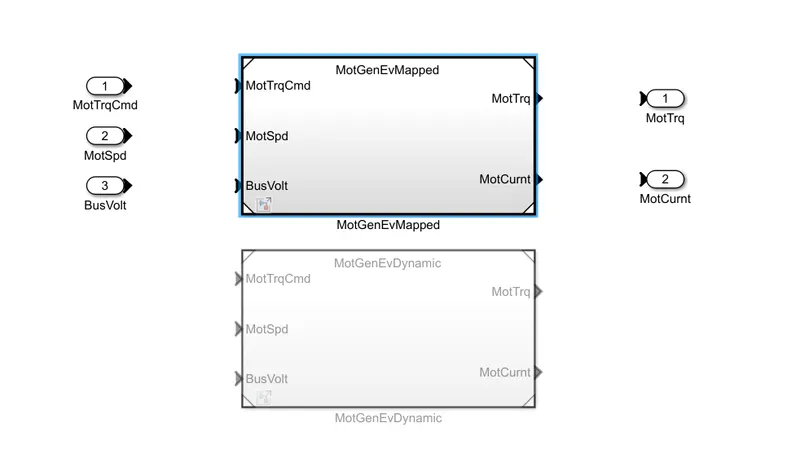
Right Click on MotGenEVMapped.
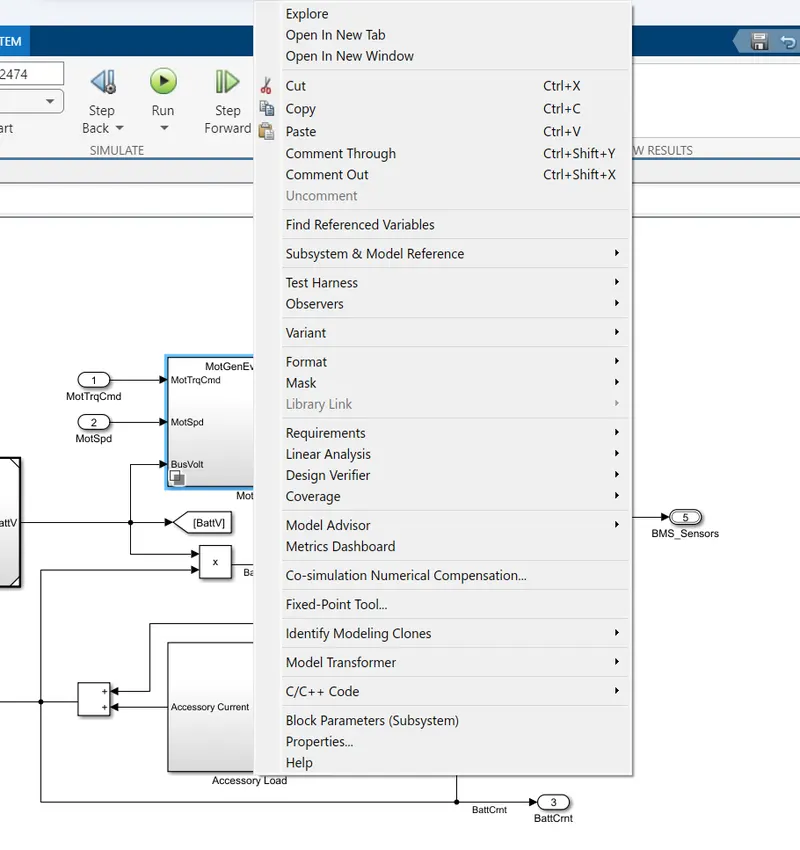
Open Block Parameters (Subsystem).
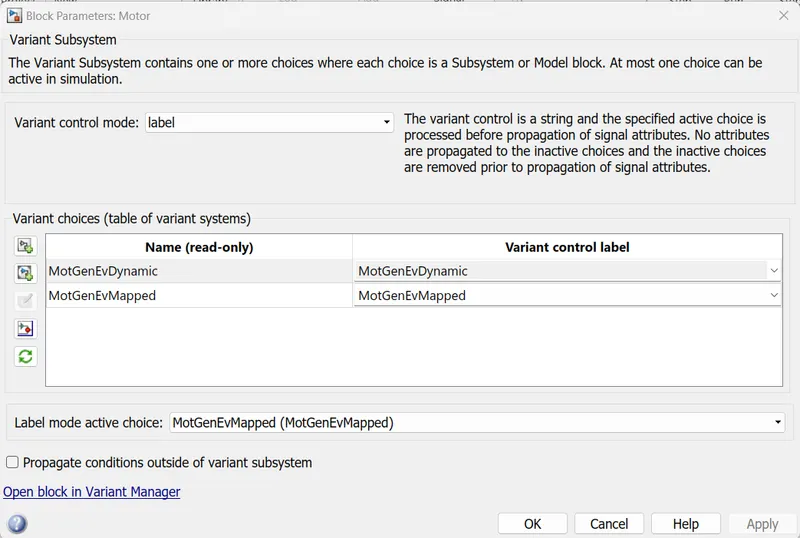
Select in Label mode active choice.
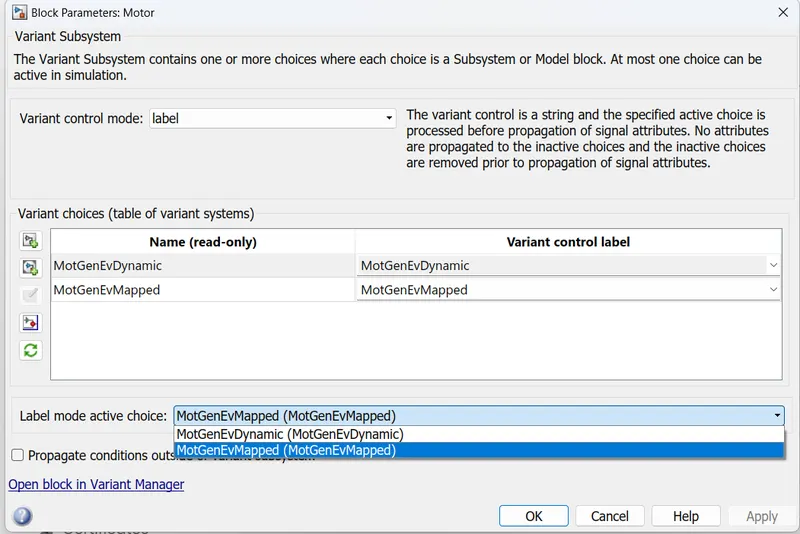
Apply.
Q.2:How does the model calculate miles per gallon? Which factors are considered to model fuel flow?
Opening Visualization.
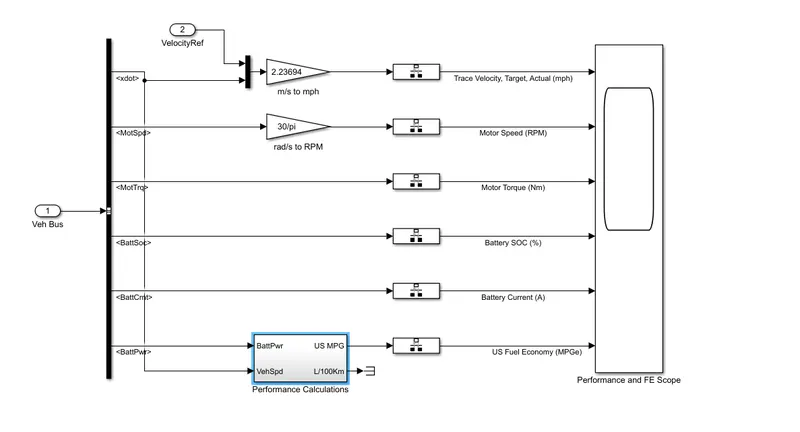
Opening Performance Calculations.
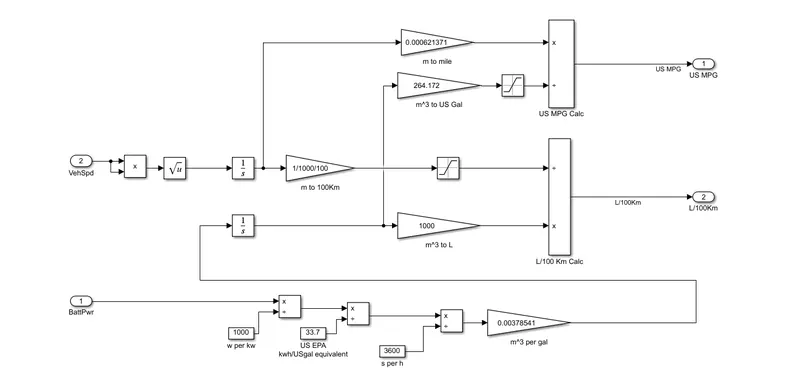
We can see that Battery Power is taken as input and converted to KW by using division block with 1000 as other input. And then this is converted to US gallon equivalent by dividing by 33.7 using division block. This is fed to division block with 3600 to convert to per hour. And this output is fed to gain block with constant 0.00378541 to get volume in m^3 per gallon. This is integrated and multiplied with gain of 264.172 to get m^3 per US gallon. This is divided by another output obtained by root of vehicle speed integrated and multiplied by gain to obtain meters to mile conversion to finally obtain the output of US Miles per gallon.
Q.3:Run the HEV ReferenceApplication with WOT drive cycle. Change the grade and wind velocity in the environment block. Comment on the results.
Opening HEV ReferenceApplication.
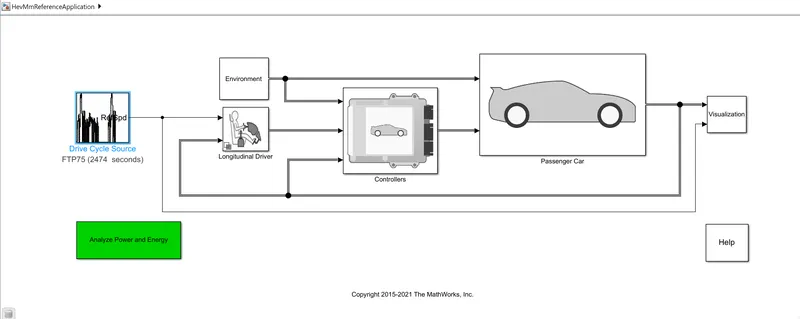
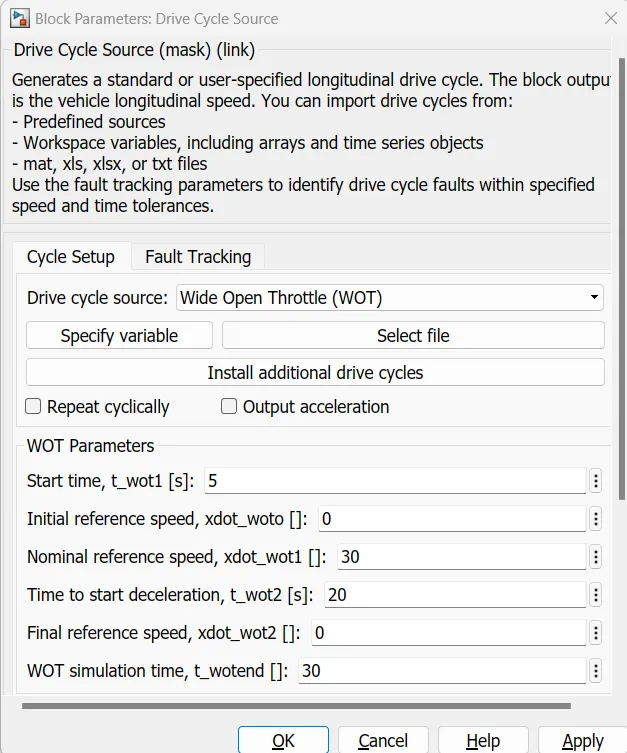
Opening Drive cycle Source and changing to Wide Open Throttle(WOT).
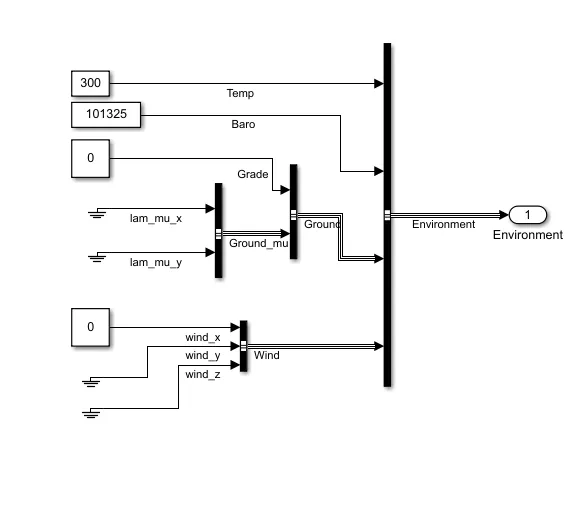
Opening the Environment block and keep all parameters in default.
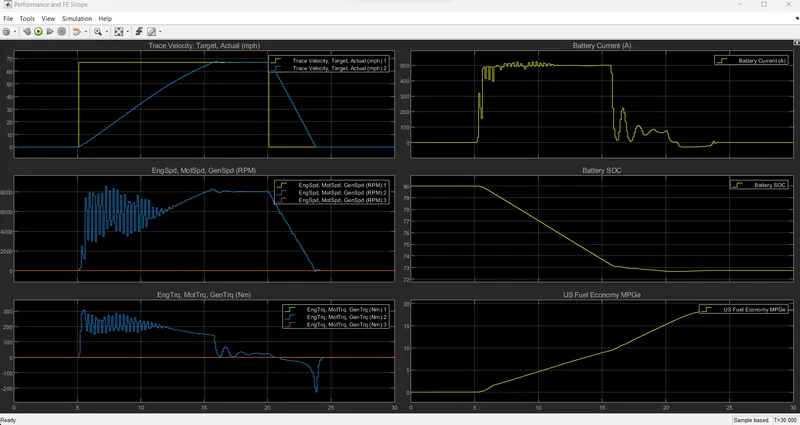
OUTPUT:
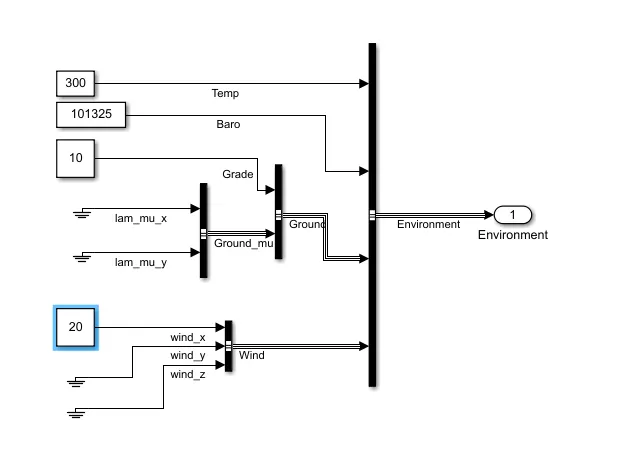
Changing the parameters Grade as 10 and Wind to 20.
OUTPUT:
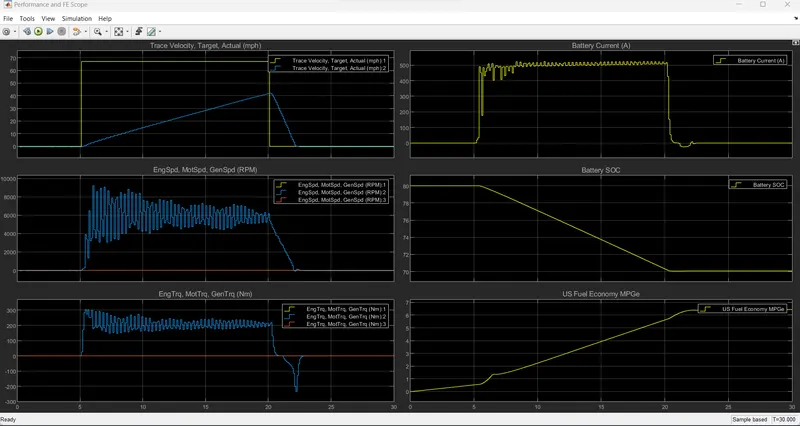
Comparing the outputs,
TraceVelocity, Target, Actual: We can see that velocity decreases with change in the grade and wind. Also the time required to reach peak is higher.
Engine, Motor, Generator Speed: We can see that speed also decreases with change in the grade and wind.
Engine, Motor, Generator Torque: We can see that torque decreases faster in first case which means maximum velocity is reached sooner. In second case torques takes longer to reach steady state.
Battery Current, Battery SOC, US Fuel Economy MPGe: Almost similar results.
Q.4:Keeping all other parameters same, compare the simulated results of hybrid and pure electric powertrains.
Opening HEV ReferenceApplication.
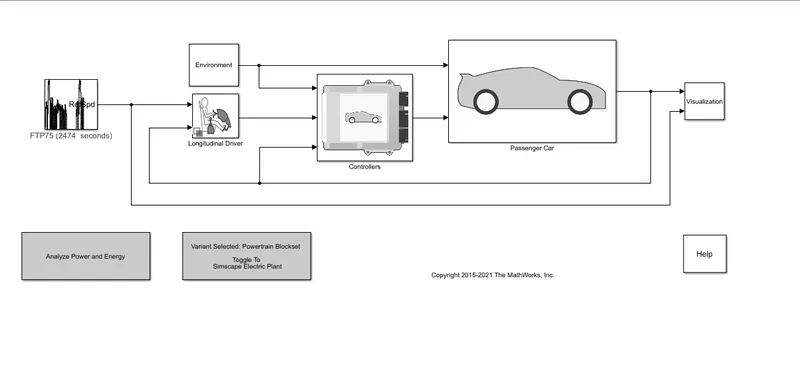
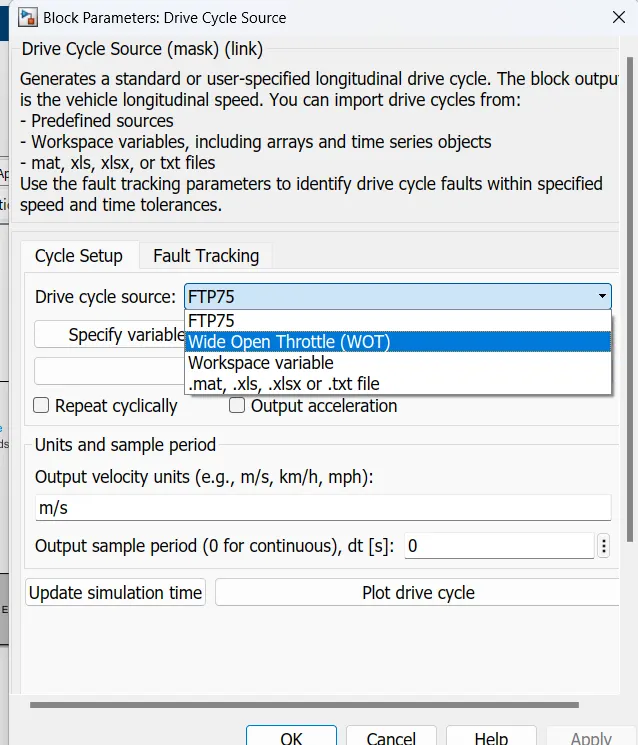
Opening Drive cycle Source and changing to Wide Open Throttle(WOT).
Opening the Environment block and Changing the parameters Grade as 10 and Wind to 20.
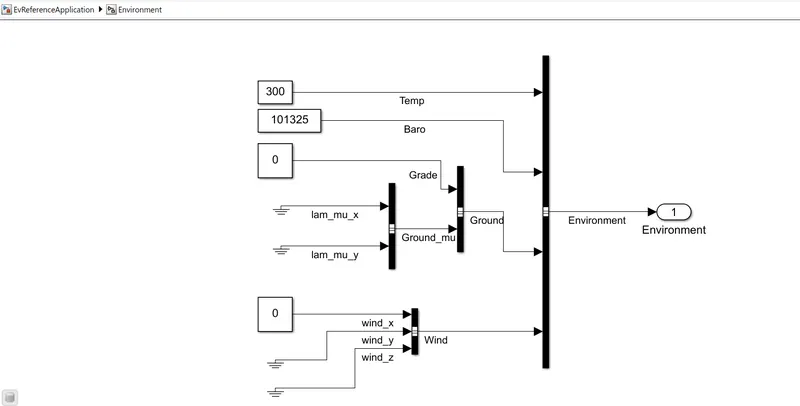
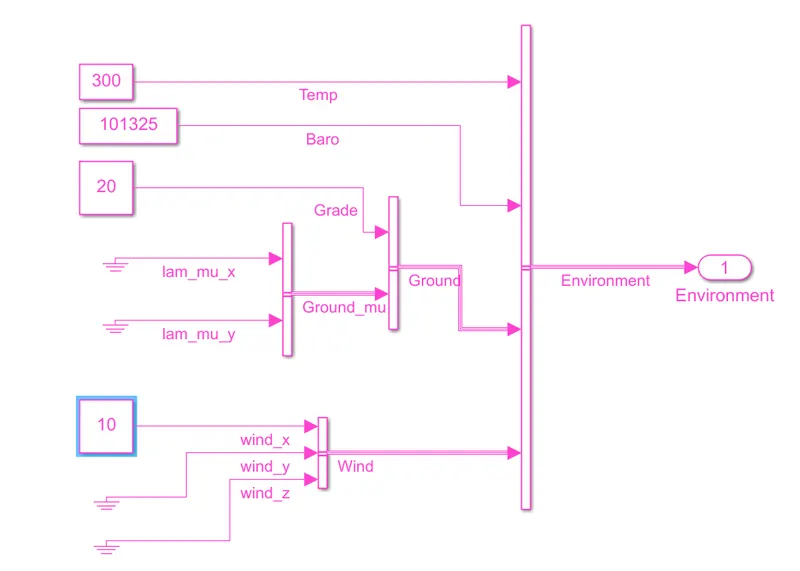
OUTPUT:
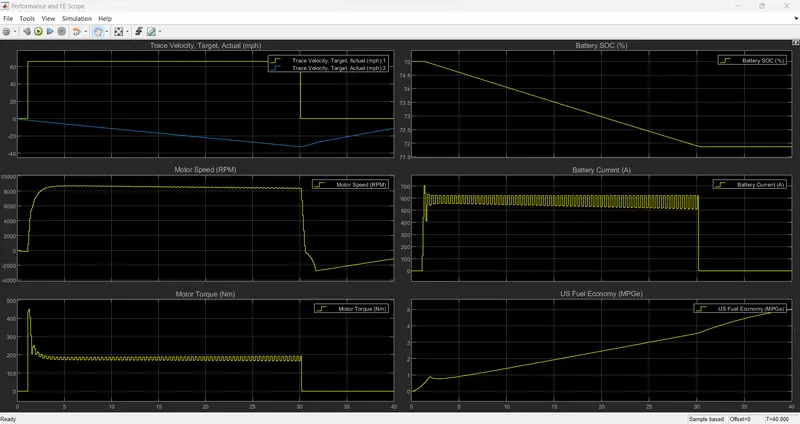
Comparing HEV and EV output,
HEV velocity is higher than EV.
Motor speed is less for EV than HEV.
Motor Torque is higher for EV than HEV.
Battery usage is higher in EV than HEV.
Battery SOC is higher in EV than HEV.
US Fuel Economy MPGe is higher in HEV than EV.