Week-4 Challenge WOT Condition Part-2
Q1)
To find difference between mapped and dynamic model of engine, motor and generator.
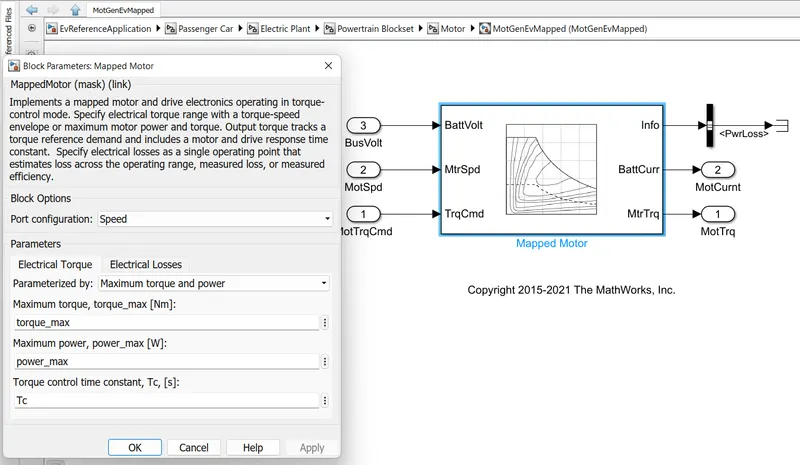
In mapped model, we use lookup table for analysis of performance. The simulation time required for this is less as compared to dynamic model. That is, it is faster. The below figure shows the mapped model of EV motor/generator.
Dynamic model have detailed analysis. Here instead of using look table , it uses components. Simulation time for this more as compared mapped. The figure below shows the dynamic motor/generator
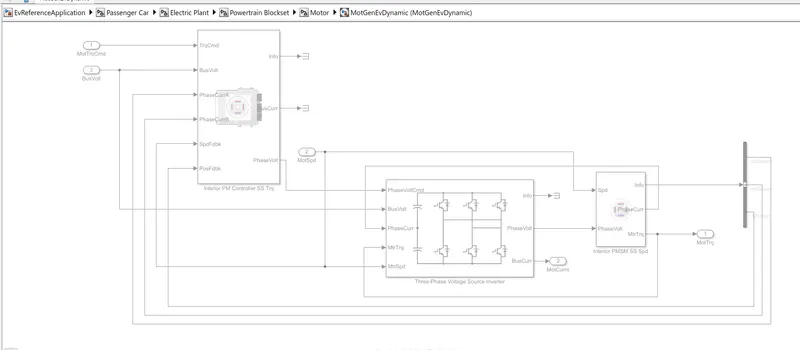
To change model, the steps is given below
Go to modelling --->select variant manager--->here in case of motor, select the model you want and right click----> the choose set as Label mode active choice.
Q2)
The fiqure below shows how model calculate the miles per gallon.
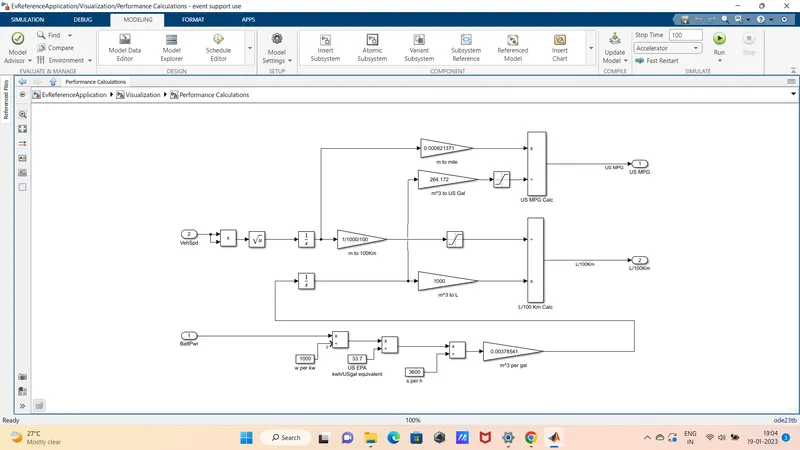
- Here from vehicle speed, the distance is calculated, which is then converted to miles
- From battery power data, power in kwh is calculated and it is then converted into US gal equivalent by dividing with 33.7
- Then it is converted into cubic meter per gal which is then converter into US gal
- Then after dividing the distance in miles with gallons we obtain US MPG
The factors considered for fuel flow model is
- Vehicle speed
- Battery power
Q3) Aim
To analyse the result of HEV ReferenceApplication with WOT drive cycle by changing the grade and wind velocity in the environment block
Solution:
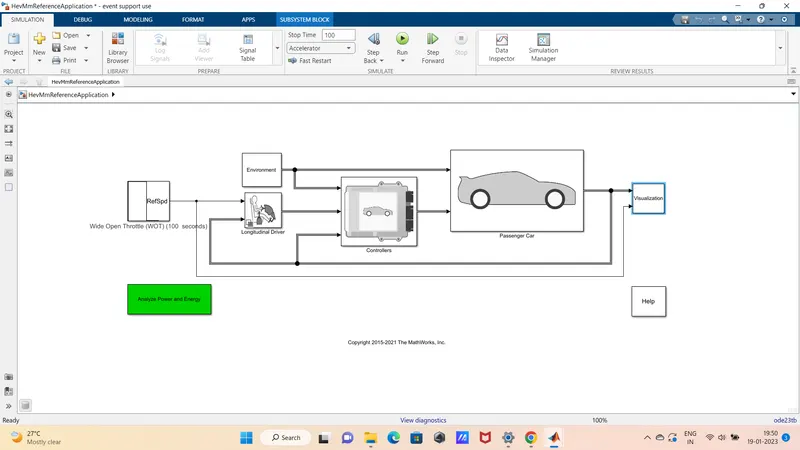
The figure below shows the model of HEV in power trainblock set
Case- 1
Grade = 0
Wind velocity = 0
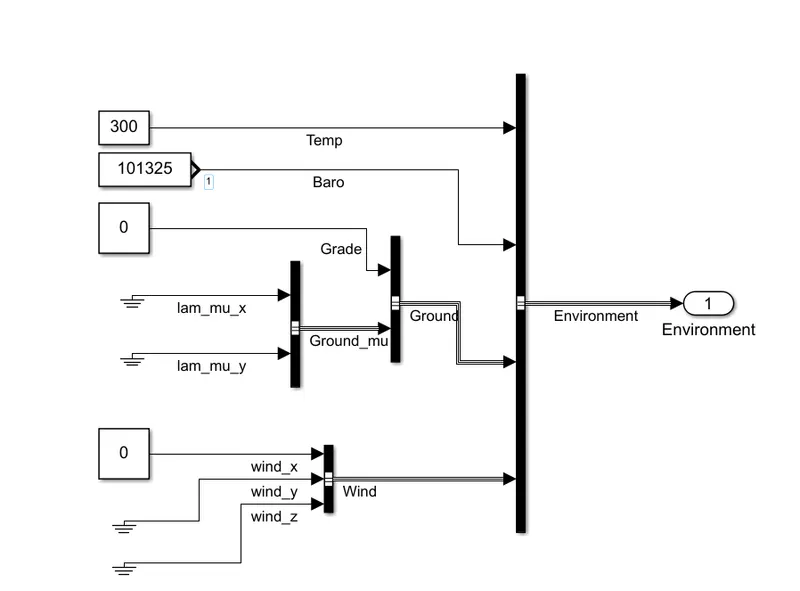
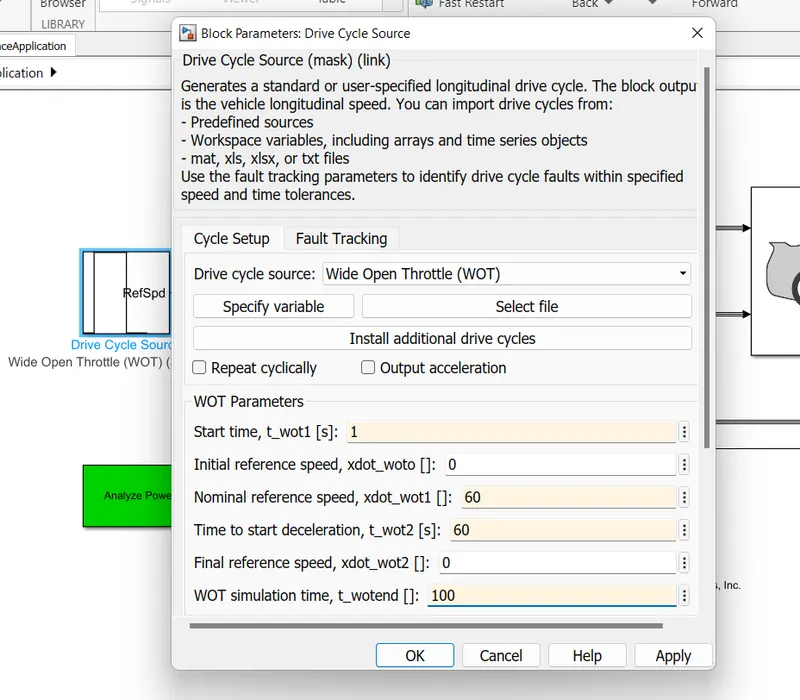
WOT drive cycle is given below
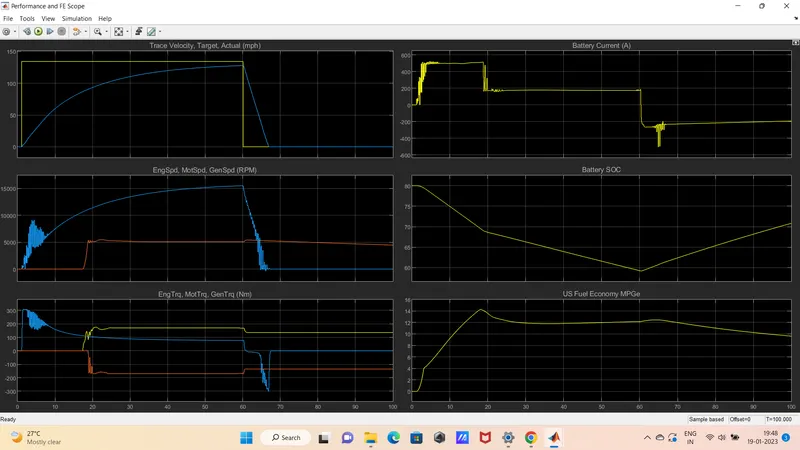
Result
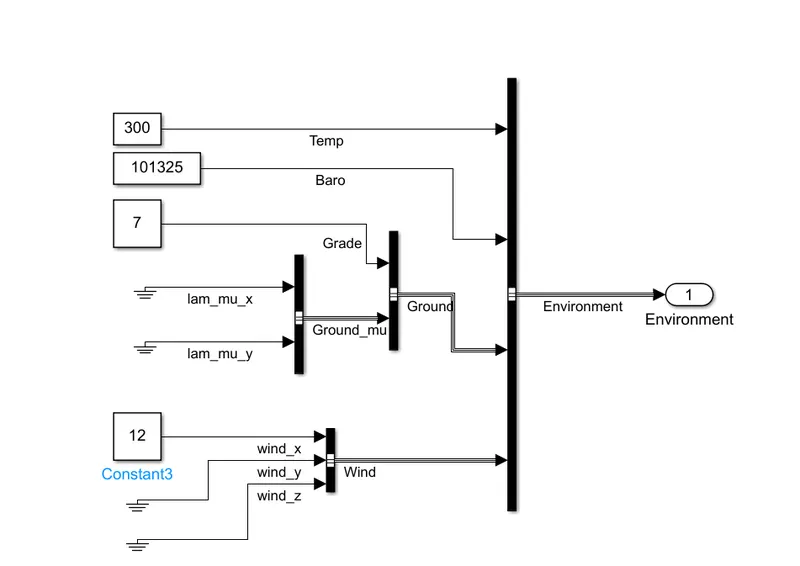
Case- 2
Grade = 7
Wind Velocity = 12
WOT drive cycle is given below
Result
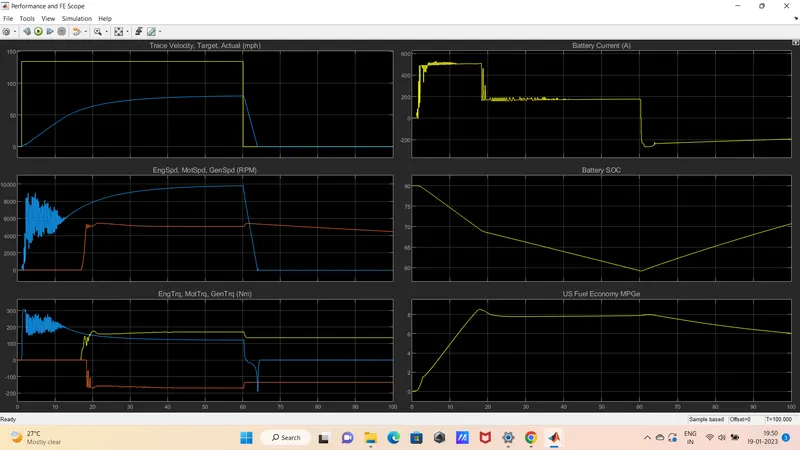
Observation
By analysing the Case-1 and Case-2 we understood that
- Top speed acheived by the vehicle is reduced after grade and wind velocity taken into consideration
- Fuel efficiency is reduced after grade and wind velocity taken into consideration
- Decelaration time is reduced, so battery recharging capability reduced
Q4) Aim:
To compare the simulated results of hybrid and pure electric powertrains by keeping all other parameters same.
solution:
The parameters shown below is same for both hybrid and pure electric powertrains
Simulation done using WOT drive for 100 sec.
The drive cycle parameters is shown below
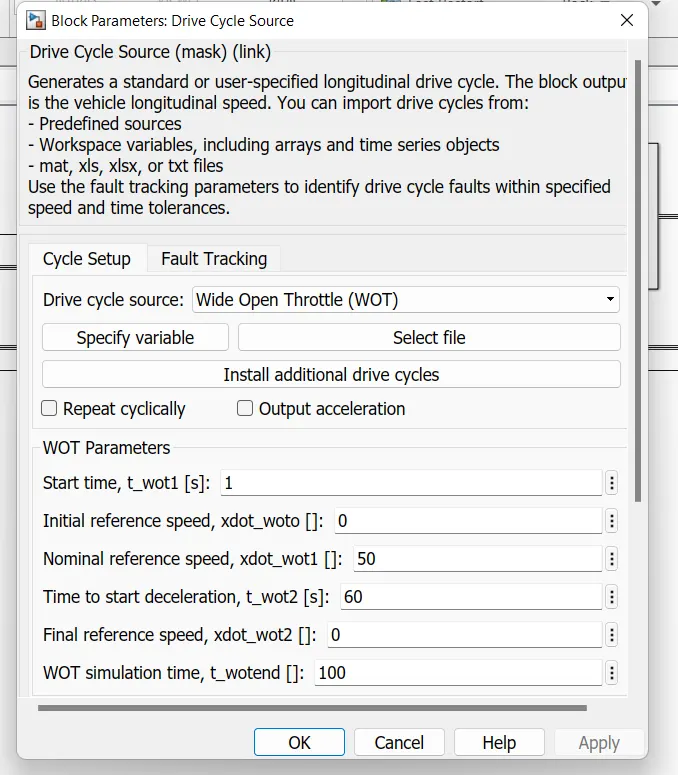
Grade and wind velocity is taken as zero
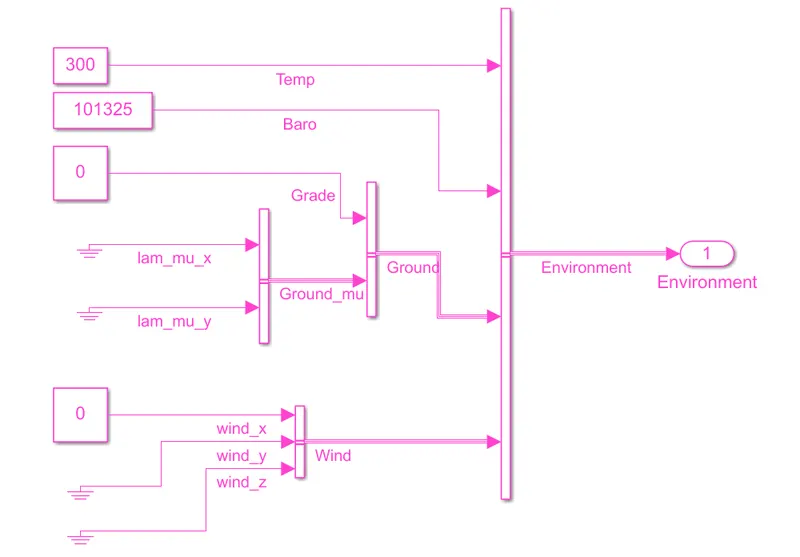
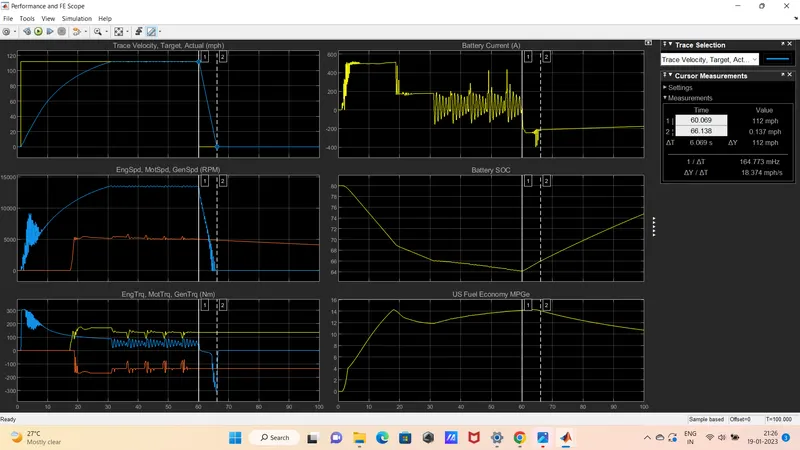
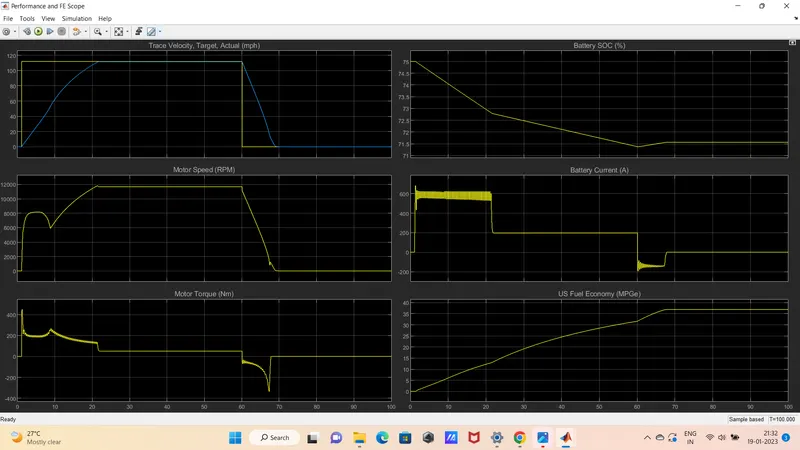
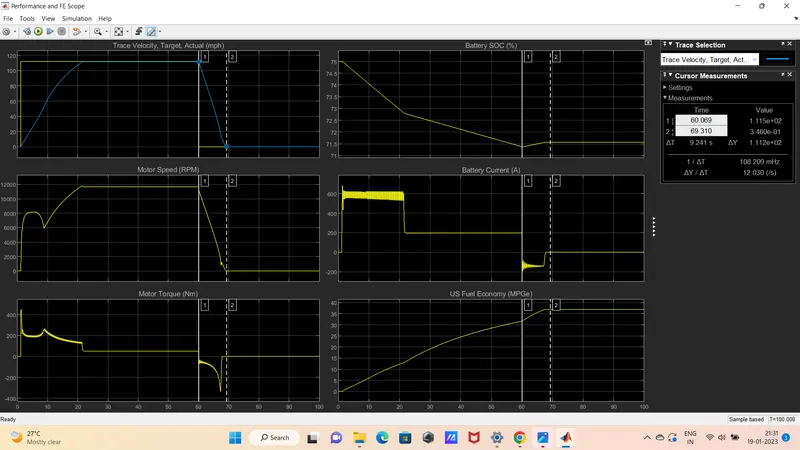
The figure below shows the simulation result of Hybrid and EV model
Hybrid Electric powertrain
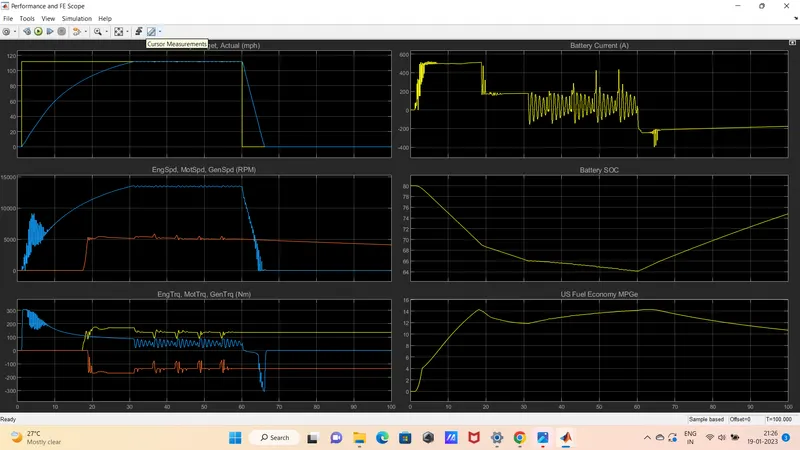
Pure EV power train
Observation
By observing above cases we can conclude that
- Fuel economy in EV is high as compared to HEV
- Time taken to reach the top speed less in EV as compared to HEV
- Decelaration time less in HEV as compared to Ev
- The reduction in battery SOC of HEV(20%) is high as compared to EV(4.8%)
- Battery current is negative for less duration during regenerative braking for EV as compared to HEV