Week-4 Challenge WOT Condition Part-2
Q.1)What is the difference between mapped and dynamic model of engine, motor and generator? How can you change model type?
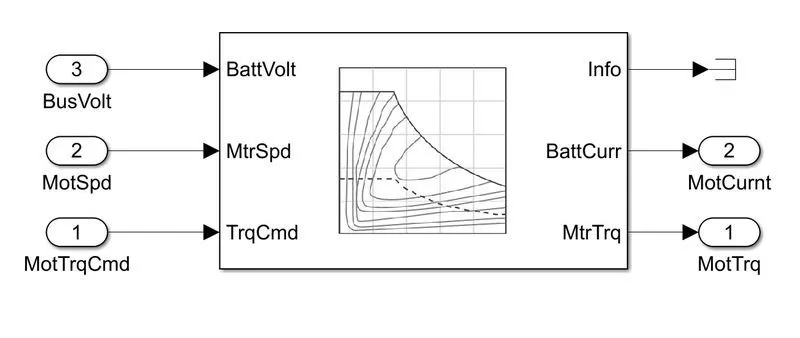
MAPPED MOTOR:-
- It makes use of lookup tables and the values should be pre defined.
- Simulation time is less.
- The results obtained will not resemble the actual result.
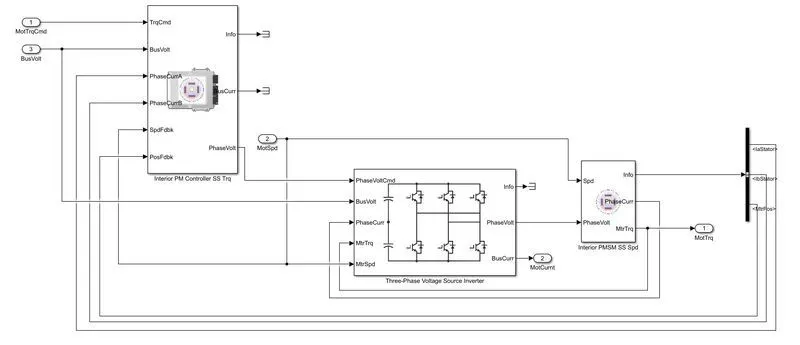
- DYNAMIC MOTOR:-
- The values of inputs are used for calculation using simulink blocks so that the values resemble the actual case.
- The simulation time is more.
- The results obtained using the model will resemble the actual results.
THE MAPPED MODEL
- The simulation of the powertrain block set model consists of data that is prebuilt in the lookup table is dealing with mapped data or mapped model.
- The mapped model calculation is very fast.
- Mapped engine is the default settings in powertrain blockset.it used to measure performance parameters of the vehicle bu using lookup tables which are prefed to the system.
- The lookup tables value are based on the values of brake torque,commanded torque and engine speed.
THE DYNAMIC MODEL
- The simulation of the powertrain block set model consists of data that is not prebuilt but it takes the real-time data by calculating every small individual like the movement of vehicle, drag, speed, velocity, wheel braking, etc. which is dynamic data or dynamic model for engine system or motor system or generator system.
- The dynamic model calculation is a time taken for a very long time for calculating every data.
- This type of model uses real time data fed by the user at run time for modelling.This model is more accurate than mapped model.
* HOW TO CHANGE THE MAPPED SYSTEM TO DYNAMIC SYSTEM OR DYNAMIC SYSTEM TO MAPPED SYSTEM:-
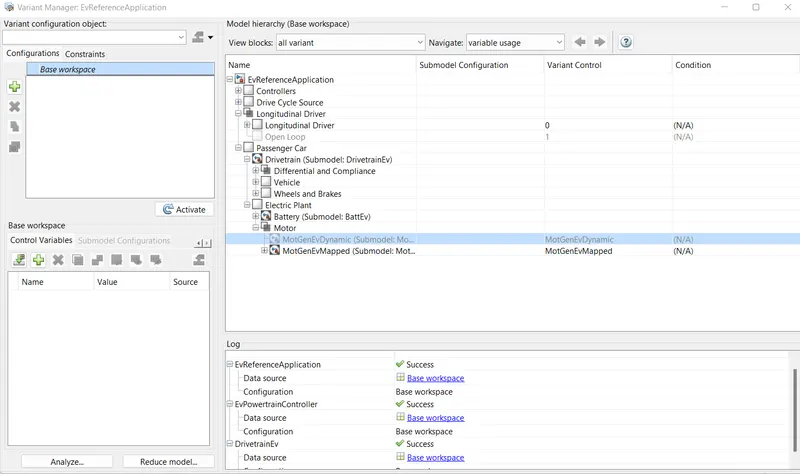
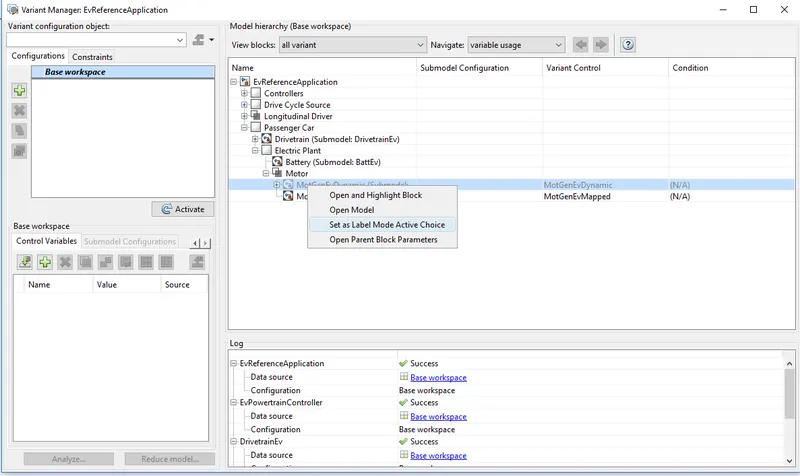
- As shown in above figure,we are using variant manager tool from modelling section for changing of mapped to dynamic of motor block.
- As shown in above, in variant manager window we have to select the path passenger car-electric plant-motor.
- In motor part we can see two options are there (1) mapped,(2) dynamic.
- Here, we can see mapped motor is selected by default.
- For changing the model type we have to right click on dynamic part and select label mode active choice.
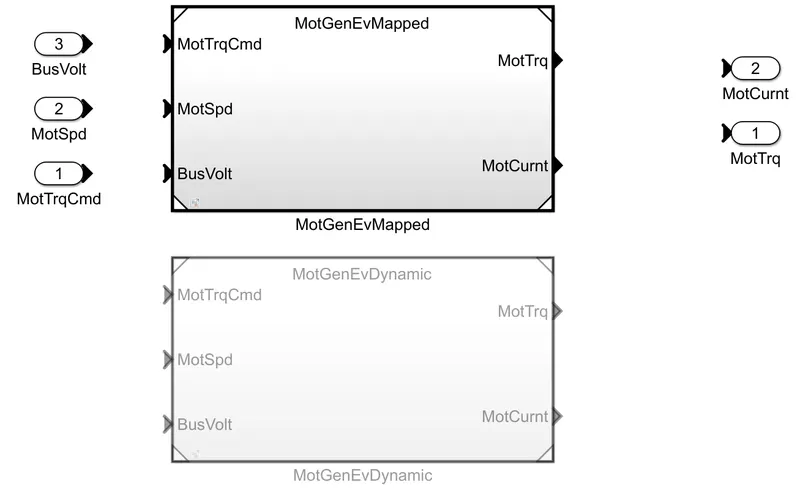
* It looks like this when the mapped data is active
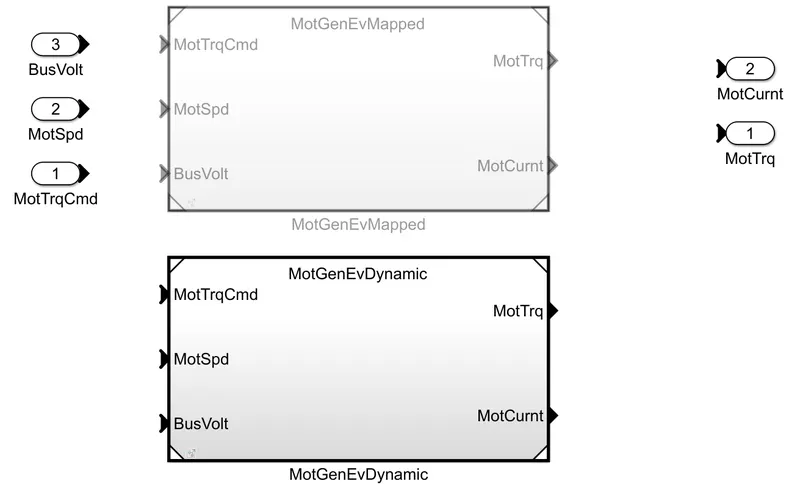
* It changes like this when dynamic data is active.
- To verify whether it is changed or not just go to passenger car-electric plant-motor.
- As shown in above,we can see that it is changed to dynamic part of motor.
Q-2) How does the model calculate miles per gallon? Which factors are considered to model fuel flow?
HEV
FUEL CONSUMPTION:
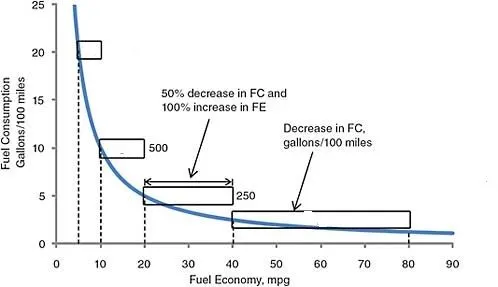
Fuel consumption is the inverse of fuel economy. It is the amount of fuel consumed in driving a given distance. Fuel consumption is a fundamental engineering measure that is directly related to fuel consumed per 100 miles and is useful because it can be employed as a direct measure of volumetric fuel savings.
There are other factors also involved in the flow of fuel in the models, they are
Mass of the vehicle,
The aerodynamic drag coefficient,
The vehicle frontal area,
The vehicle acceleration and speed,
The road gradient.
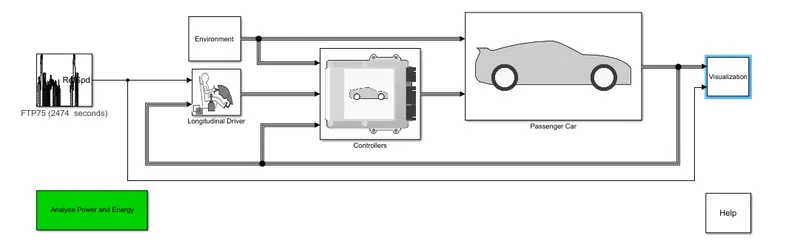
For this problem I have taken model Hybrid Electric Vehicle Input Power Split Reference and to understand how model calculates miles per gallon follow the path as shown in the figure given above .
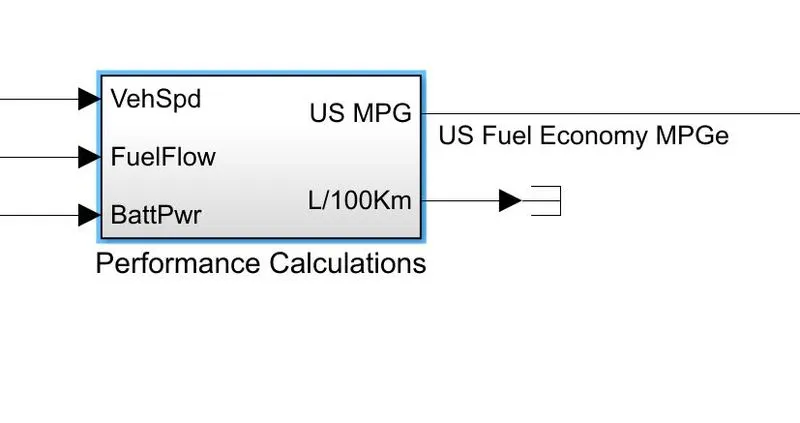
- As shown in above figure,it shows the fuel economy in miles per gallon using the vehicle speed,fuel flow velocity and the battery power.
- The HEVs uses both fuel and battery power.
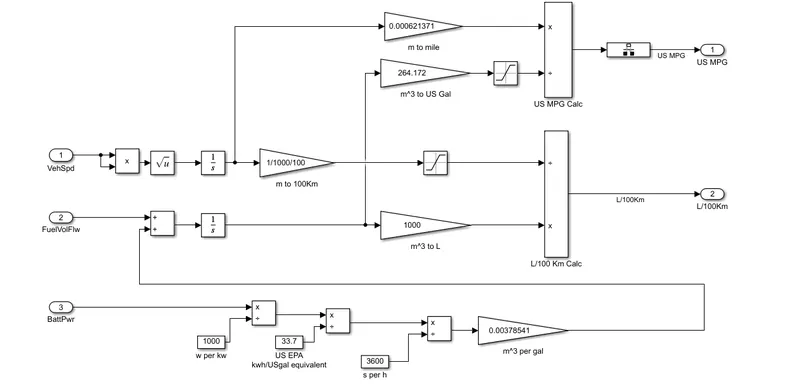
- In side the subsystem of performance Calculation, It explains the The model calculation of miles per gallon.The part of Red color flow deals with the Calculation of miles per gallon.
- The part of Green color flow deals with the Vehicle Speed.
- The part of Blue color flow deals with FuelFlow and Battery power.
- The part of Perple color flow deals with Battery power.
- The vehicle speed is integrated with time and converts distance from meters to miles by multiplying 0.000621371.
- The battery power is converted in kw by diving 1000 and then dividing by 33.7 to convert gal/hr.
- Now that value is again divide by 3600 to convert gal/sec.
- For conversion of gal/sec to m3/sec ,the value is multilpy by 0.00378541.
- That value is added with the fuel rate and integrated with respect to time to convert into m3.
- The value is multiply with 264.172 for conversion of m3 to US gallon.
- Finally,we divide US gallon value with miles we get Miles per gallon.
The following factors which are considered to model fuel flow:-
- Vehicle Speed ((m/s)
- Fuel Flow (kg/s)
- Battery power (W)
* Now, vehicle speed is converted into miles and divided by volume obtained by dividing the kg of fuel(California PhaseII Gasoline) with its density and then converted into gallons to obtain miles/gallon.
* Secondly, W is converted into equivalent kg/s of fuel and then added to actual fuel flow to obtain km/L.
* Factors that are considered for fuel flow includes vehicle velocity, fuel flow and battery power. Battery power is converted into equivalent gasoline flow and then the fuel flow is calculated.
Q-3) Run the HEV ReferenceApplication with WOT drive cycle. Change the grade and wind velocity in the environment block. Comment on the results.
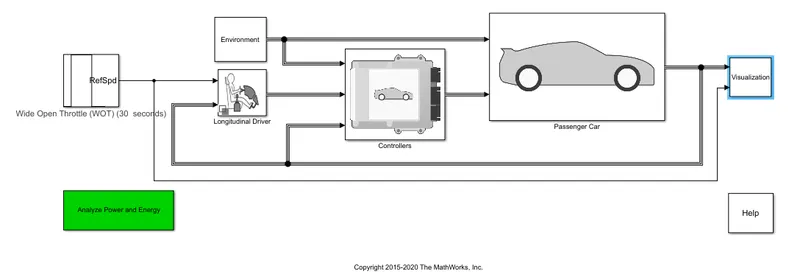
For this problem, Hybrid Electric Vehicle Multimode reference application is taken with WOT Drive Cylce as shown in the figure.
Now the simulation is run with first case
i) Grade = 0; ii) Wind Velocity = 0
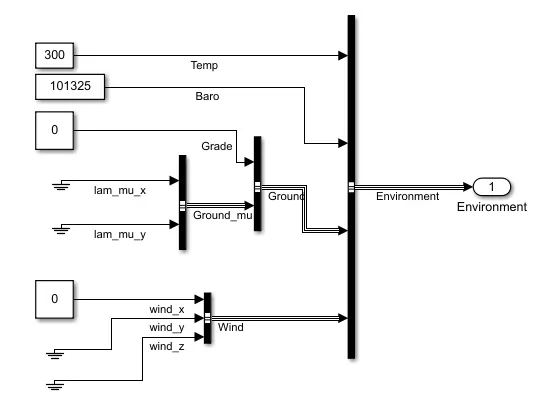
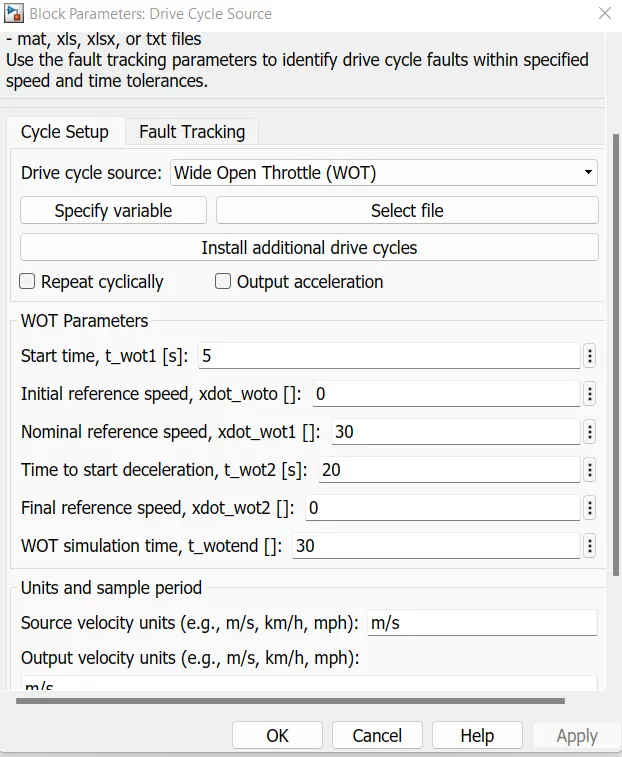
- All other parameters of wide open throttle are as shown in below the figure.
` 
* The results are as follows:-
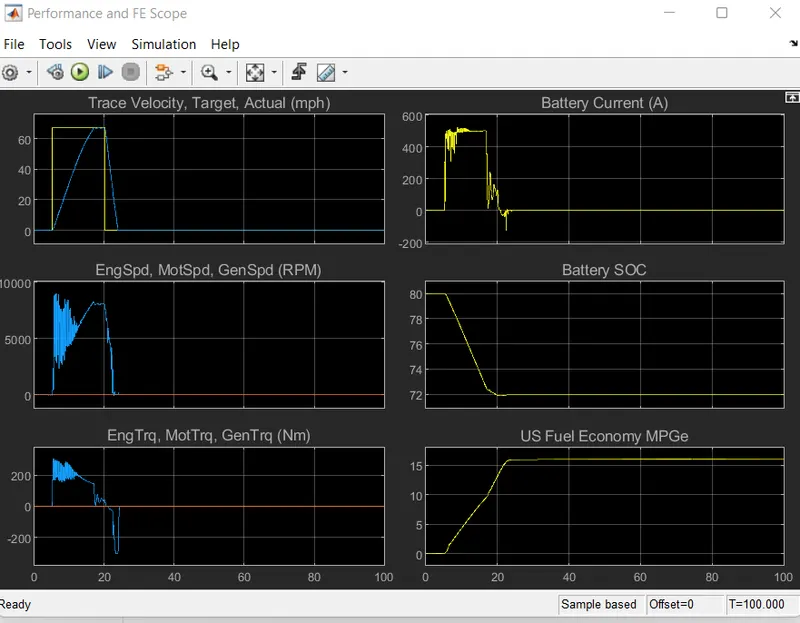
From the above figure we can see that, since no grade or wind velocity is present, vehicle is able to achieve its maximum speed with battery power itself. We can see that, the yellow line in Trace velocity curve represents wide open throttle but the velocity curve does not correspond to the curve and instead takes time to reach maximum speed. This is due to maximum motor power. Had the motor power been more, with more Ampere, maximum velocity would have been reached earlier.
- As shown in above,In the first graph blue curve is ideal WOT cycle and the red curve is actual WOT cycle obtained for the given parameters.
- In second graph, we can observe that the speed of the engine and generator are same throughout the drive cycle and rapid increase in motor speed can be obtained and reduces while decelerating.
- In third graph,we can see that torque of the motor is high for few seconds during full throttle and then gradually reduces and this is same for both motor and generator.
- In forth graph,The battery current is utilized till engine turn on when engine turn on vehicle runs with both motor as well as engine.
- In fifth graph,we can see that the SOC of battery reduces gradually when the vehicle runs on electric motor.from 32 to 50 sec of time interval,we can see that the SOC reduces slowly because the SOC is used to turn on the engine.
* Change the grade and wind velocity in the environment block. Comment on the results.
Now the simulation is run with 2nd case
i) Grade = 8; ii) Wind Velocity = 17
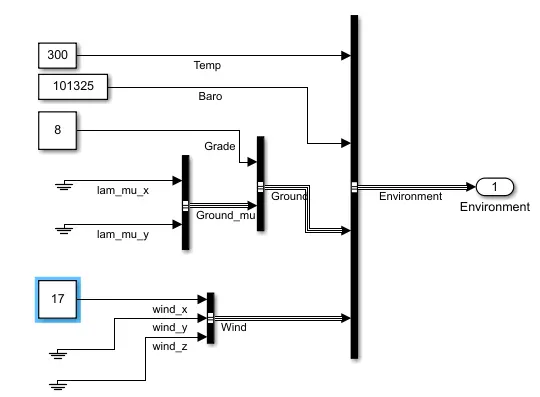
- All parameters and simulink model are kept same without any changes except wind velocity and grade in enviroment block.
- As shown in above figure,we are changing grade value to 8 and wind velocity to 17 ms.
* The results are as follows:-
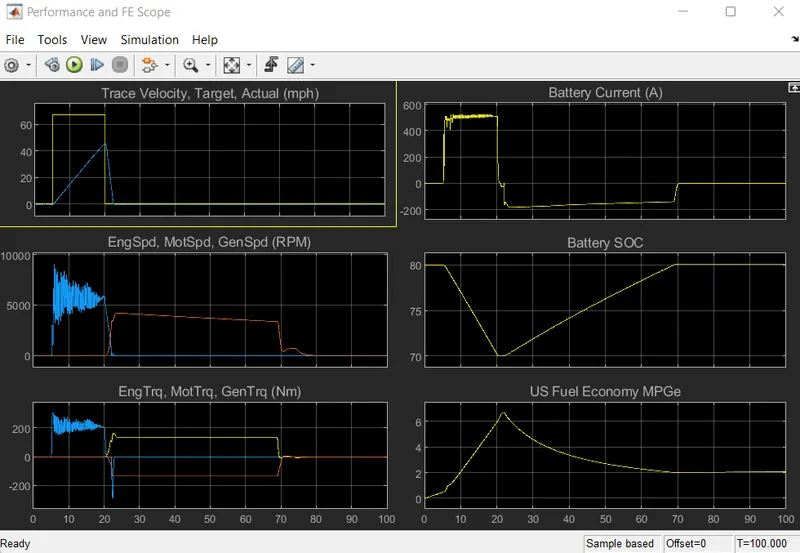
- As shown in above,In the first graph blue curve is ideal WOT cycle and the red curve is actual WOT cycle obtained for the given parameters.we can see that the actual WOT cycle peak value is less as compare to older one.
- In second graph,the motor speed is increasing for few second. but the diffence from older one is not getting constant speed during the drive cycle because of we are giving wind and grade inputs.
- in third curve, motor torque is increasing for few seconds.but here torque spikes are going less as time is go forward and torque is drastically goes down to zero as compare to older one.
- In forth curve,the battery current is less spikes because vehicle is not getting larger speed acceleration due to wind and grades are involved in simulink model.
- In fifth curve,Battery SOC is gradually decreasing as compare to older one.
Q-4) Keeping all other parameters same, compare the simulated results of hybrid and pure electric powertrains.
* SIMULINK MODEL OF HEV:-
* DRIVE CYCLE SOURCE BLOCK:-
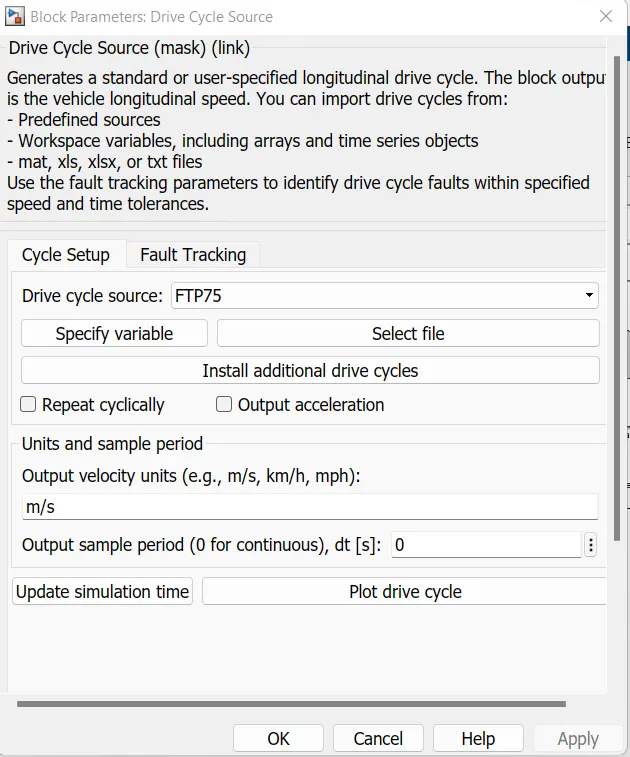
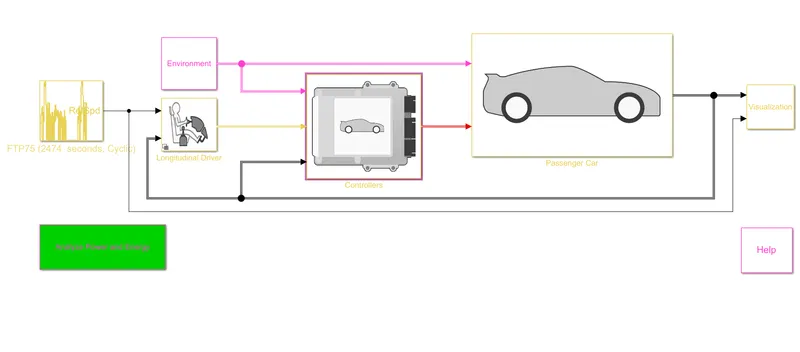
- As shown in above block, we are taking FTP75 drive cycle as input which is selected by default by the user.
* ENVIRONMENT SUBSYSTEM:-
- As shown in above,we are not doing any change in grade and wind value in environment block.
* OUTPUT:-
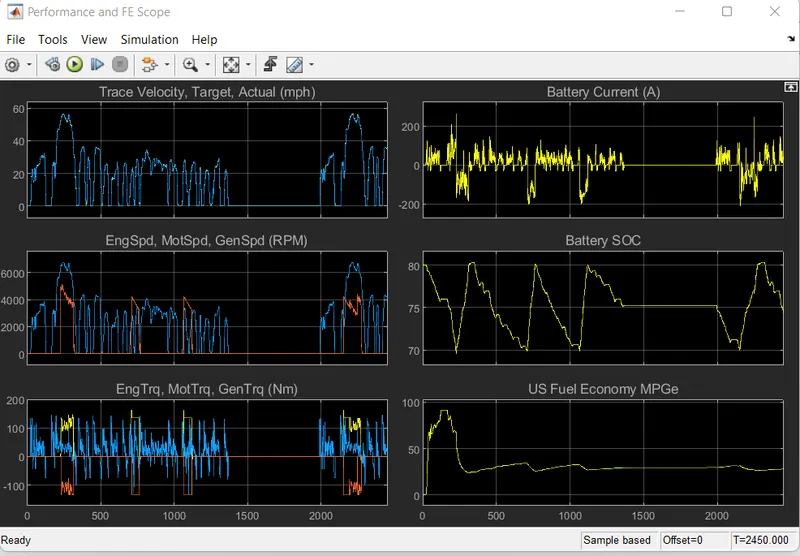
- The first graph shows the FTP75 standard drive cycle and the actual drive cycle,which are quite similar in nature.
- In second graph,the motor speed is varrying with according to the drive cycle.Simultaneously,the engine is turned on when SOC of battery tend to 70% and the engine is starts running on generator and battery is charged.
- In third graph,the torque of motor and engine is high during acceleration and low during deceleration.
- In forth graph,the battery current utilized by the motors will be more when the motor is at high acceleration.
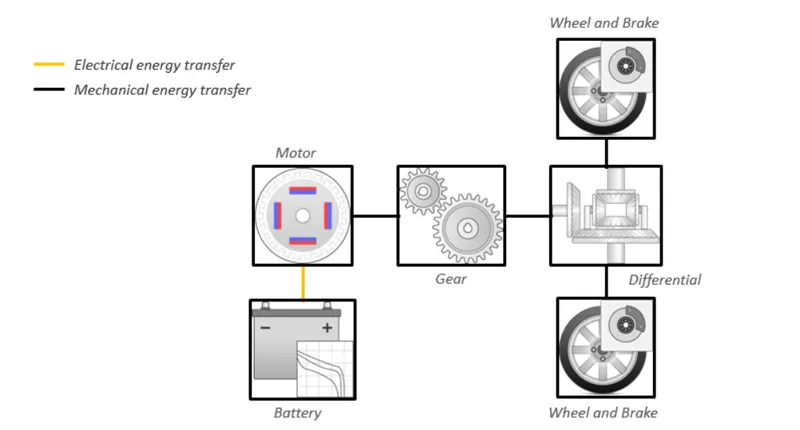
* SIMULINK MODEL OF EV:-
* DRIVE CYCLE SOURCE BLOCK:-
- As shown in above block, we are taking FTP75 drive cycle as input which is selected by default by the user.
* ENVIRONMENT SUBSYSTEM:-
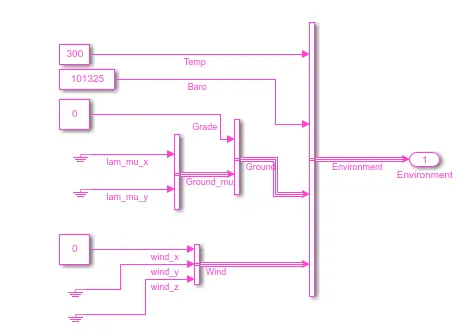
- As shown in above,we are not doing any change in grade and wind value in environment block.
* OUTPUT:-
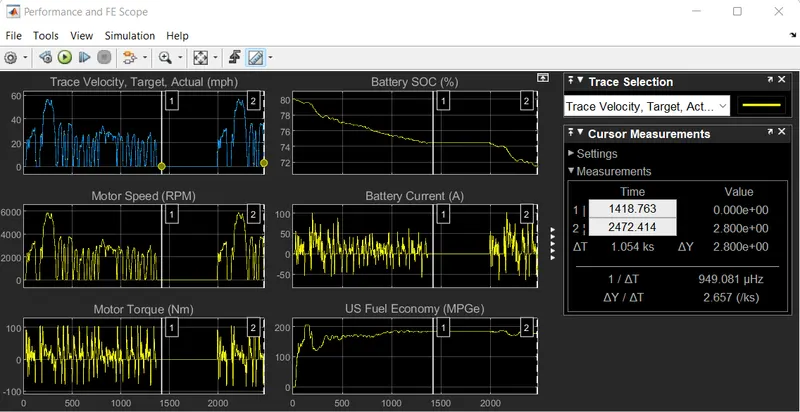
- As shown in first graph,we can see FTP75 standard drive cycle input is given to the model by user.
- In second graph,the motor speed is shown and it is varrying with change of drive cycle ups and falls.
- In third graph,The motor torque is goes high during acceleration and goes down during deceleration.
* COMPARISON:-
- EV runs only on motor alone if the battery charge is over then the vehicle is stop.but HEV runs on both motor and engine.So that the distance over by vehicle is high compare to EV.
- In EV model,SOC of battery cannot utilized within partipular limit but in HEV model ,We can set uper and lower limit of battery.If the SOC of battery is goes below the set value than motor stops and engine is turned on and battery gets charged.
- If the SOC of battety is equal to upper limit then engine turns off and vehicle runs on motor until the SOC decreases below the lower limit.