Project - Data Handling and Interpolation
Data Handling and Interpolation
Aim of objective:
In a laboratory experiment, data of voltage and current has been recorded and the same is attached in an excel file ( Click on this link VI.xlsx ). Read the excel file in the Matlab program and perform the interpolation in the range of -17.3:0.1:0.9. Generate the interactive plot for the interpolated data and store them in a text file.
Interpolation:
It is the method of using our function to predict the value of the dependent variable for an independent variable that lies within the data set.This works within the given data set. or Interpolation is a method of fitting the data points to represent the value of a function. It has a various number of applications in engineering and science, that are used to construct new data points within the range of a discrete data set of known data points or can be used for determining a formula of the function that will pass from the given set of points (x,y).
Used of matlab founction in interpolation:
vq=interp1(x,y,xq) returns interpolated values of a 1-D function at specific query points using linear interpolation. Vector x contains the sample points, and v contains the corresponding values, v(x). Vector xq contains the coordinates of the query points.If you have multiple sets of data that are sampled at the same point coordinates, then you can pass v as an array. Each column of array v contains a different set of 1-D sample values
Formula of interpolation:

y=Linear interpolation value
x=Independent variable
x1,y1=Values of the function at one point
x2,y2=Values of the function at another point
Matlab script:
f = xlsread('VI.xlsx');%Reading the xlsx file
V = f(:,1);%storing first column value of 'f' in 'V'
I = f(:,2);%storing second column value of 'f' in 'A'
Vinp = -17.3:0.1:0.9;% Creating Given Range of Voltage Data mentioned in problem
Iinp = interp1(V,I,Vinp,"spline");% Using 'interp1' function for calculating Current value for given %Voltage Range 'Vinp'
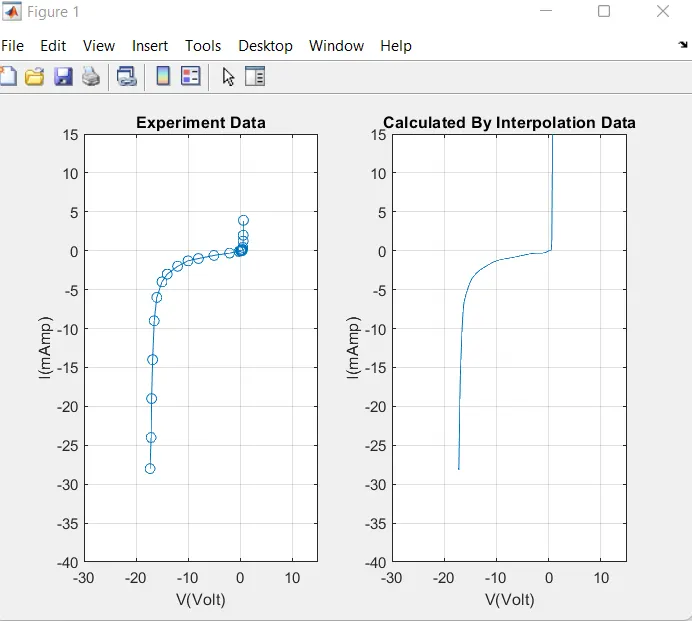
figure(1);
subplot(121)
plot(V,I,'-o');grid;% Ploting trig_function with time
title('Experiment Data');%giving title for the figure
ylabel('I(mAmp)');xlabel('V(Volt)');%giving lables to both the axis
axis([-30 15 -40 15]);%Defining axis limits
subplot(122)
plot(Vinp,Iinp);grid;% Ploting trig_function with time
title('Calculated By Interpolation Data');%giving title for the figure
ylabel('I(mAmp)');xlabel('V(Volt)');%giving lables to both the axis
axis([-30 15 -40 15]);%Defining axis limits
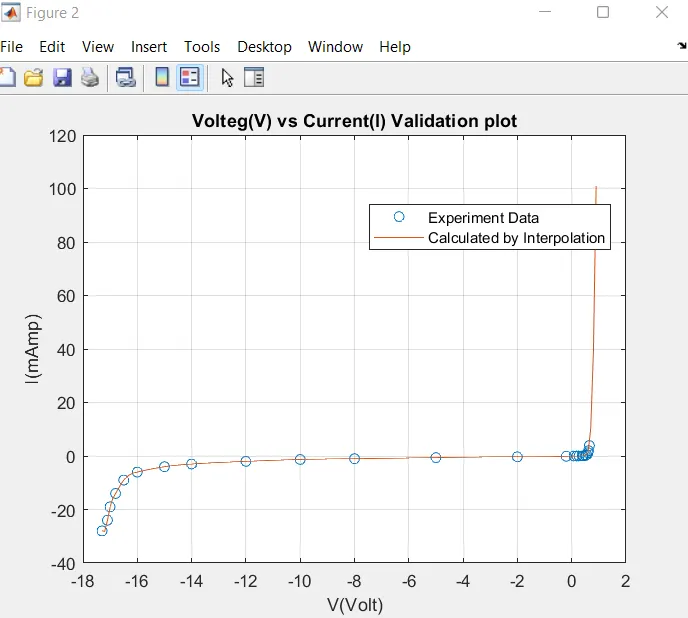
figure(2);
plot(V,I,'o',Vinp,Iinp);grid;%ploting the values
title('Volteg(V) vs Current(I) Validation plot');%giving title for the figure
xlabel('V(Volt)');ylabel('I(mAmp)');%labeling X and Y axis
legend('Experiment Data','Calculated by Interpolation','Location','best');% Showing legends
VV =[-17.2 -17.1 -16.5 -14.1 -13.1 -13.5 -13.0 -12.5 -11 -11.3 -10.5 -9 -8.2 -5.76 -6 -1 0.11 0.20 0.25 0.5 0.57 0.61];% Given Voltage Data IN %problem
VI = interp1(V,I,VV,"spline");% Using 'interp1' function for calculating Current value for given Voltage
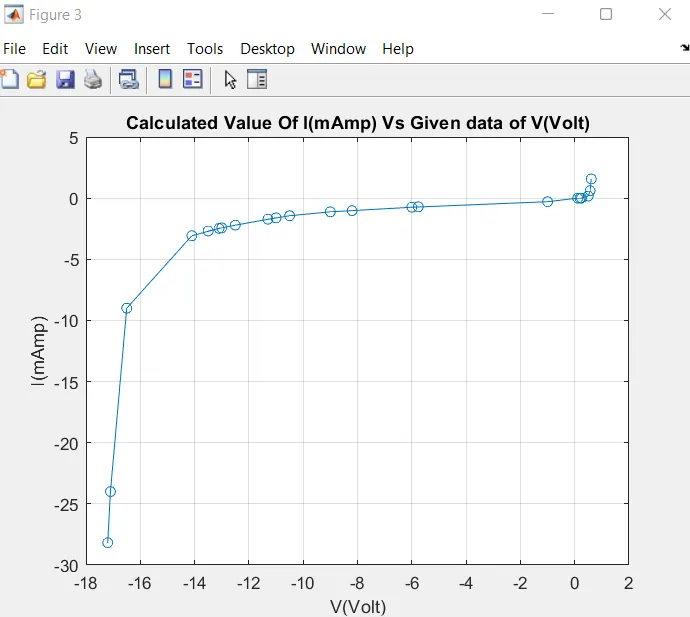
figure(3);
plot(VV,VI,'-o');grid;%ploting the values
title('Calculated Value Of I(mAmp) Vs Given data of V(Volt)');%giving title for the figure
xlabel('V(Volt)');ylabel('I(mAmp)');%labeling X and Y axis
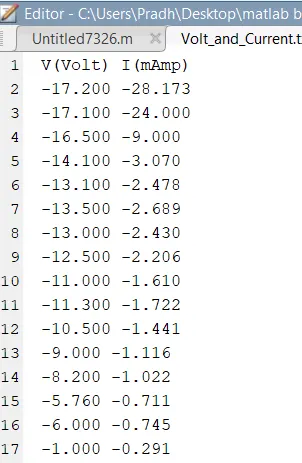
fid = fopen('Volt_and_Current.txt','w');% opening output file
fprintf(fid,'V(Volt) I(mAmp)\n');% storing value of variable x in file
for i = 1:length(VV)
fprintf(fid,'%.3f %.3f\n',VV(i),VI(i));% storing value of variable x in file
end
fclose(fid);% closing output file
Conclusion:
The excel file is read in the Matlab program and interpolation is performed for the range of [-17.3:0.1:0.9].