Week-4 Challenge WOT Condition Part-2
Aim 1 : What is the difference between mapped and dynamic model of engine, motor and generator? How can you change model type?
Theory : Tabular difference between mapped , dynamic , model of motor , generator, engine...
|
Sr no. : |
Mapped |
Dynamic |
|
1 : Motor |
The mapped motor works in torque control mode. This type of motor is used when the user requires a faster simulation and doesn't have the knowledge of motor parameters. The output torque and reference torque is compared and changes are made. Input torque or speed can be specified, electrical losses and maximum motor power and torque can be defined. |
In the dynamic motor a three phase interior permanent magnet synchronous motor (PMS) is used. The block uses three phase input voltages to regulate the individual phase currents, allowing control of the motor torque or speed. This block is used when the user knows what parameters are to be used in that particular simulation. This motor is more accurate. |
|
2:Generator |
The mapped generator block is also similar like other blocks. Most of the data required is taken from the lookup tables corresponding to the given input parameters. Its simulation time is less. |
The dynamic generator involves user entering the parameters manually during the run time for their particular applications. The results take time and are more accurate. |
|
3 : Engine |
Mapped Engine is the default settings in powertrain blockset. It is used to measure to measure performance parameters of the vehicle by using standard lookup tables which are prefed to the system. This type of modelling is less accurate. The lookup tables value are based on the values of brake torque, commanded torque and engine speed. If any other parameter like Input engine temperature is selected then lookup table values are also a function of the temperature parameter. |
This type of model uses real time data fed by the user at run time for modelling. This model is more accurate than mapped engine model. This type of model is used when the data of subsystems of a vehicle is required. We can calculate : Brake torque, fuel flow, port gas mass flow, exhaust temperature, exhaust mass flow rate and exhaust emissions. |
BElow are the steps to change the model type :-
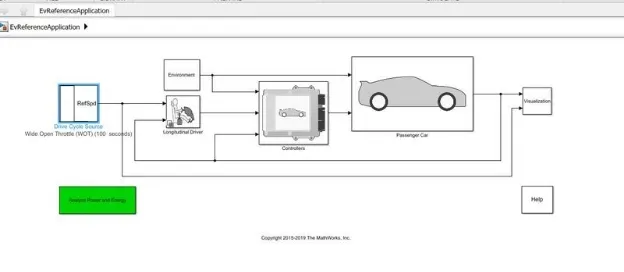
Step 1: Open the EV model file as seen below .
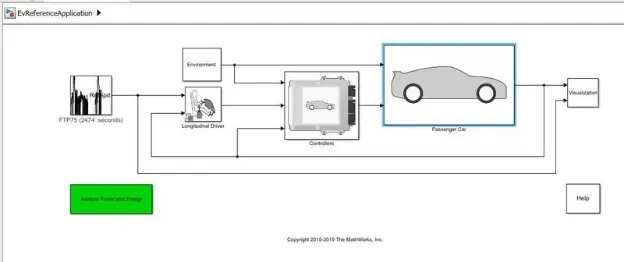
Step 2 : open passenger car block subsystem as shown below and then click Electric part
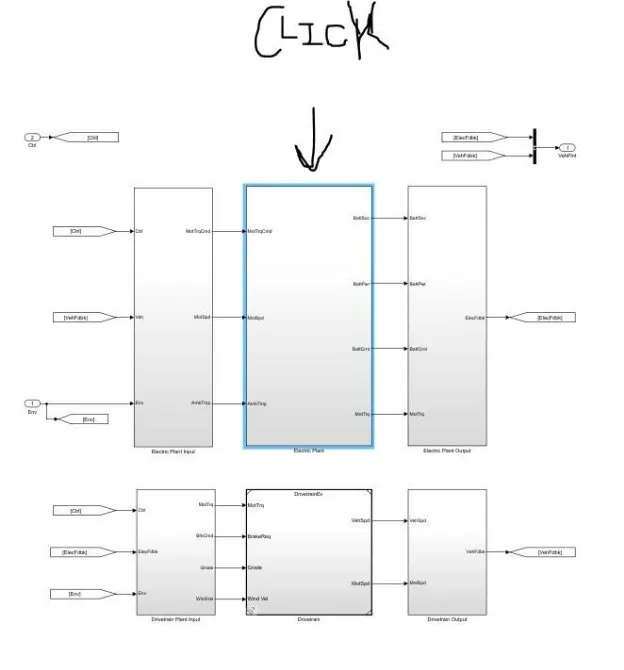
Step 3 : Now click motor section under the electirc part to see mapped type system
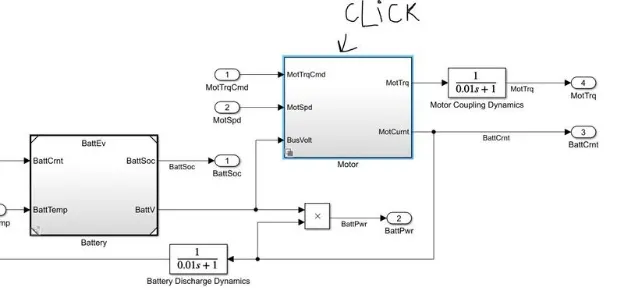
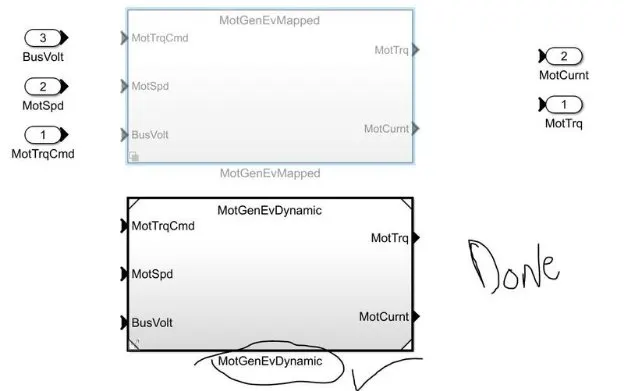
Step 4 : Right click on the MOt gen ev mapped block to change it to dynamic type

Step 5 : modeling top bar option where you can see the varient manager right click on that and choose
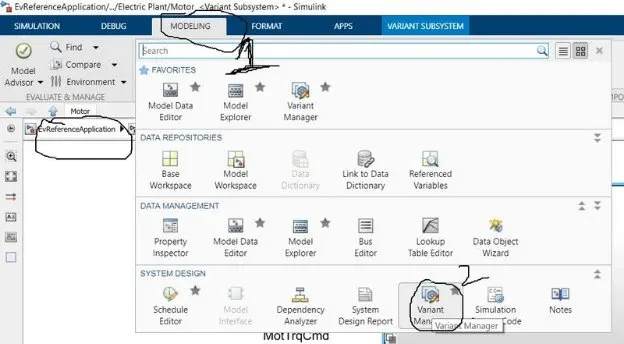
Step 6 : Click the model dynamic type and choose activate option

Step 7 : The varient has been now switched to dynamic from the mapped system .
============ ===== =====================================================================================
Aim 2 : How does the model calculate miles per gallon ? Which factors are considered to model fuel flow ?
Theory : The formula for MPGe can be calculated like this: 33.7 kWh of electricity = 1 gallon of gas. Some cars can get 100 MPGe. However, this can be misleading if you are looking at this number for how much money you will be spending on fill-ups.
When shopping for a hybrid or electric vehicle, you might also see efficiency displayed the other way around: kWh per 100 miles.
This measurement tells you how much electricity the car requires to travel 100 miles. The car with the MPGe of 60 would have a kWh per 100 miles rating of 56. That means the car would require 1.78kWh to travel one mile, or 56kWh of electricity to travel 100 miles.
When comparing MPGe, a higher number is better (more efficient). But when comparing ranges, the lower number is the more efficient range.
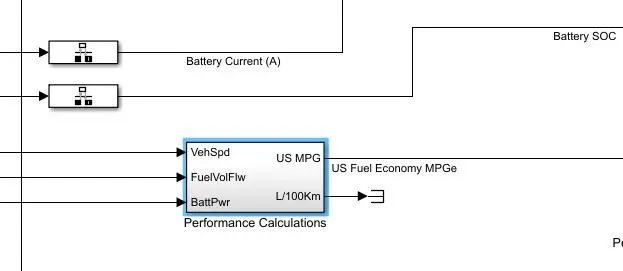
1 . Battery power is first converted into KW (W/1000) then its divides by 33.7 kwh.
2 . The fuel equivalent of battery is added to the fuel flow.
3 . Using the vehicle speed and time the distance of travel is calculated.
4 . Then distance is converted into miles by conversions.
5 . Then as we have the fuel flow in m^3 and distance in miles. We can calculate the fuel efficiency as
(. Distance covered in miles ÷ Fuel consumed in gallons ) = Fuel efficiency
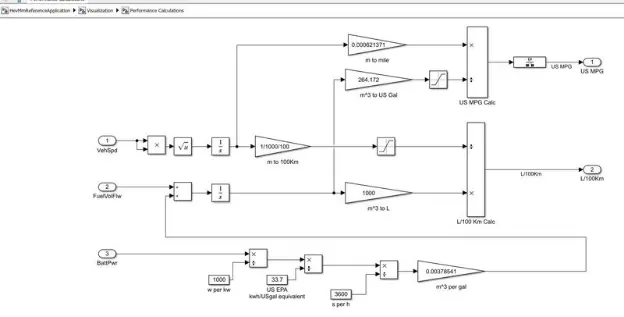
• The amount of Energy from battery power required to propel the vehicle Equivalent to that of the Engine is calculated here.
• The battery power is given in watts and it is converted to Kw by dividing with 1000.
• Then we convert the power into energy by multiplying with the time into KWh.
• Then we convert the Energy from kWh to equivalent energy in US gallon of automotive gasoline by dividing with 33.7. since we get the energy in US Gallons equal in KWh we are trying to get the energy of equivalent LIS Gallons per seconds and we do this by dividing with 3600 and we convert the hour to seconds.
• Then multiplying with 0.00378541 we convert the US Gallons per sec to the volume of the fuel flow in (mA3/ s) and then we multiply with 739 (California Phase Il Gasolinedensity) (i.e) mA3/s * kg/mA3 which gives the result as mass flow rate kg's.
• Then finally the Battery energy equivalent in kg/s is given as a input for the fuel flow parameter in order to find the equivalent US Gallons enegy and estimate the Miles per Gallons.
============ ===== =====================================================================================
Aim 3 : Run the HEV ReferenceApplication with WOT drive cycle. Change the grade and wind velocity in the environment block. Comment on the results.
Theory : A hybrid electric vehicle (HEV) is a type of vehicle that uses both an electric engine and a conventional internal combustion engine. This type of vehicle is considered to have better performance and fuel economy compared to a conventional one.
The advantages of HEVs include:
Oil consumption is less than that of conventional vehicles.
Carbon-based emission is lower, which makes HEVs more eco-friendly. This also helps conserve non-renewable resources like petroleum products.
Maintenance costs are lower than those of conventional vehicles.
With the electric motor taking charge of the engine during long travels, more mileage can be achieved with HEVs compared to other types of vehicles.
Diagram :
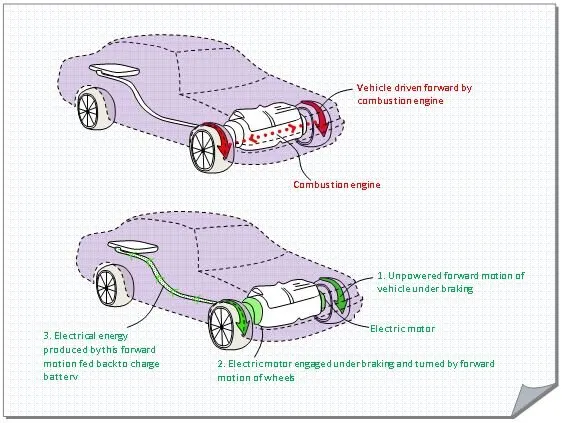
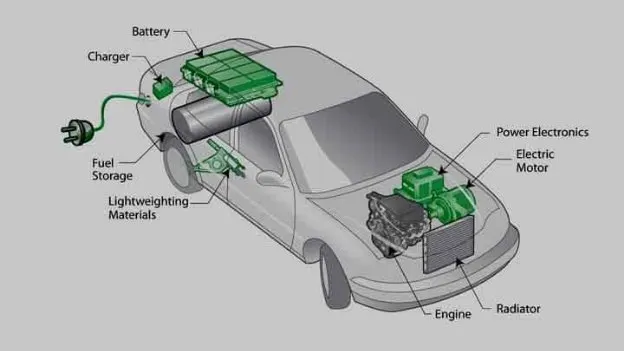
There are three main types of hybrid vehicle; full hybrids, mild hybrids and plug-in hybrids.
1 . A full hybrid (FHEV) can run on just the combustion engine (i.e. diesel/petrol), the electric engine (i.e. power from batteries), or a combination. The Toyota Prius is the
most commonly known example of this. A full hybrid is not plugged in to recharge; the battery is recharged by running the combustion engine.
2 . A mild hybrid has an electric motor and combustion engine which always work together. An example of this is the Honda Accord Hybrid. Mild hybrids cannot run in just
electric or just combustion engine mode; the engines/motors always work in parallel.
3 . A plug-in hybrid (PHEV), as the name suggests, requires plugging into the mains in order to fully recharge its battery. PHEVs can be run in just electric mode.
A hybrid car having IC engine and E motor both with fuel tank and battery bag both
Study of our case
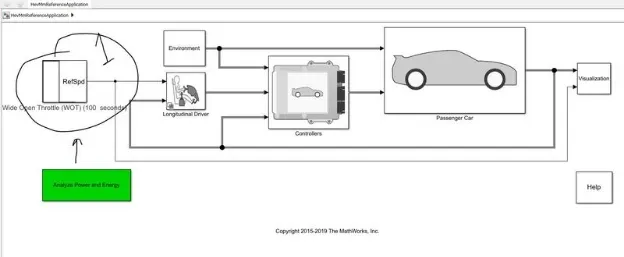
In the powertrain blockset we have selected the hybrid electric vehicle and thats the simulink reference model.
here we can run and select the input according to our wish and perform the simulation to check the results in below cases
Simulation condition required
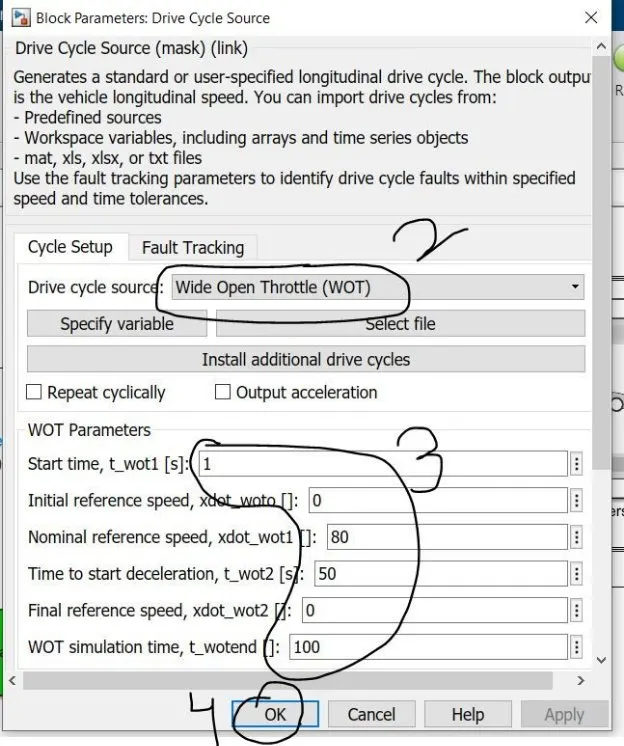
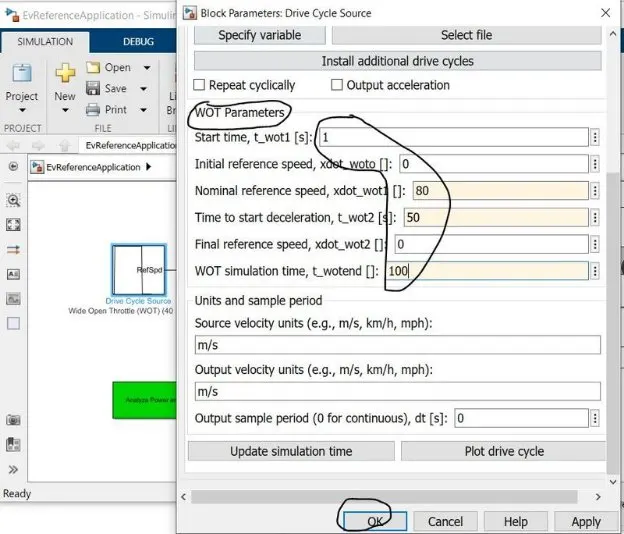
1. The total cycle time =100seconds for HEV with WOT drive cycle
2. Top speed = 80
3. Time of deaccelaration = 50 sec
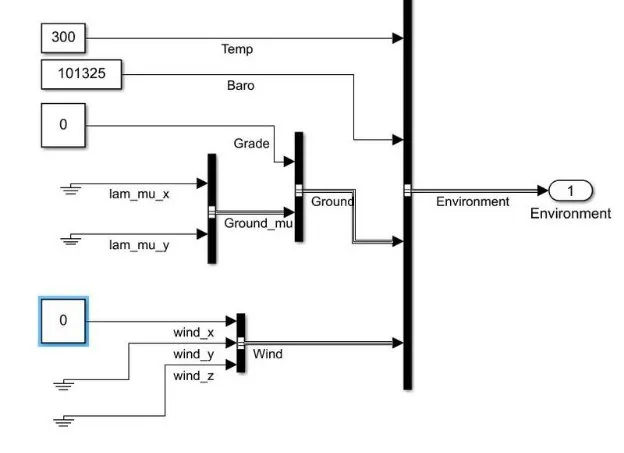
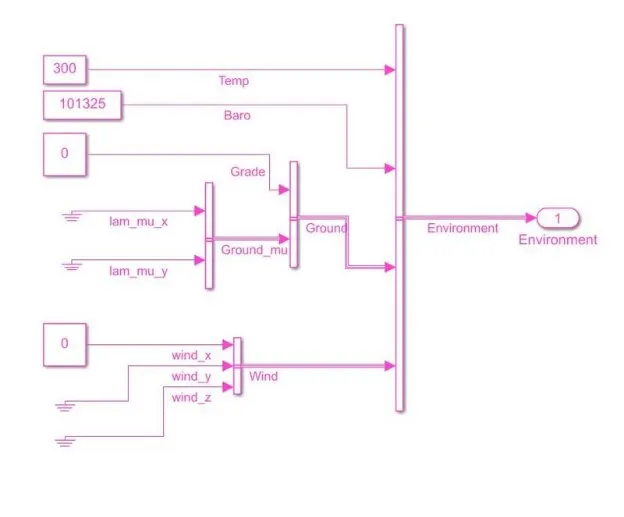
4. Grade Angle = 0degrees
5. Wind speed = 0 m/sec
Case 1 :
Step : 1 Select the block parameter by clicking the WOT block and enter the values
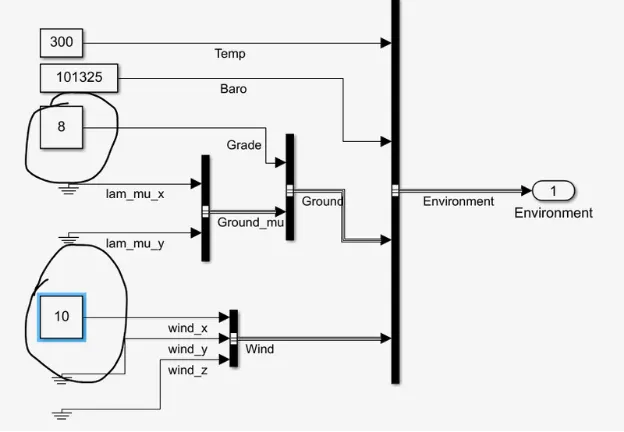
Step 2 : Click the Environment Block and enter the values in the Grade block And Wind block as our choice , here i choose (0,0) for initial comparison
Step 3 : Return Back and hit the Run button below the graph will appear after few seconds of waiting ..
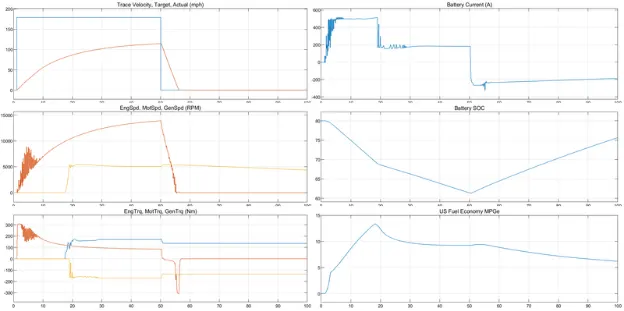
• The above figure shows the results for the simulation and there are totally six plots in them.
• Each plot shows a particular result and the plots are made in such a way that there is a cursor measurement and if we change the cursor on one plot the cursor moves on the otherplots too which paves way to study the result in a better way.
• The cursor enables us to study the behaviour of other result parameters corresponding to the acceleration of the vehicle.
plot 1:
Shows the velocity of the vehicle with respect to the Drive cycle data with the Time scale on the x axis.
The acceleration time to reach 80 mph - 16.7 seconds
The deceleration time from 80 to minimum = 6.2 seconds
plot 2:
Shows the changes in speed of the Engine,motor and Generator in Rpm throughout the drive cycle.
Peak Engine speed = 4780 Rpm
Peak Motor speed = 9497 Rpm
Peak Generator speed = 13690 Rpm
plot 3:
Shows the Torque characteristics and its changes of engine,motor and generator in (Nm) throughout the drive cycle.
Peak Engine torque = 138.7 Nm
Peak Motor torque = 206.7 Nm
Peak Generator torque = 42.2 Nm
plot 4:
Shows the Battery Current values (A) and its changes for various acceleration inputs as per the Drive cycle.
The peak current discharge from the battery = 163.5A
The peak current charging to the battery =-150.86 A
Plot 5:
Shows the Battery state of charge SOC (%) and its changes corresponding to the driving inputs.
The state of charge decreased from 60% to 39.8% of charge in a time period of 49.3 seconds, for the specified driving conditions.
Plot 6:
Shows the Fuel Economy as Mile per Gallons for the corresponding input driving conditions.
The maximum miles that the car can run per gallon of fuel equivalent = 46 Miles,for the given vehicle at the specified driving conditions.
Case 2 :
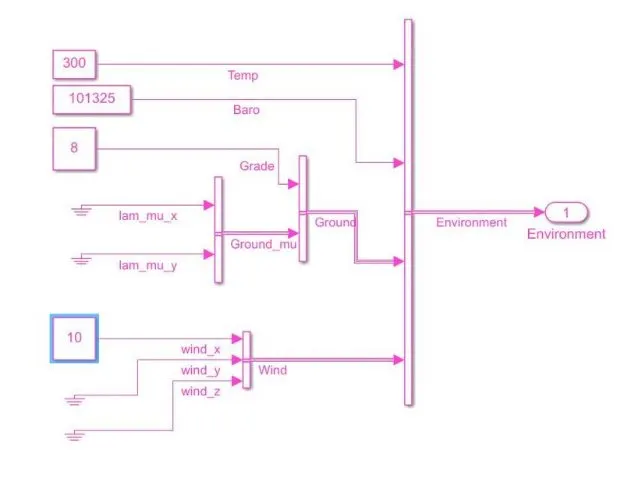
The Grade angle - 8 Degrees
The wind velocity = 10 m/s.
Graph
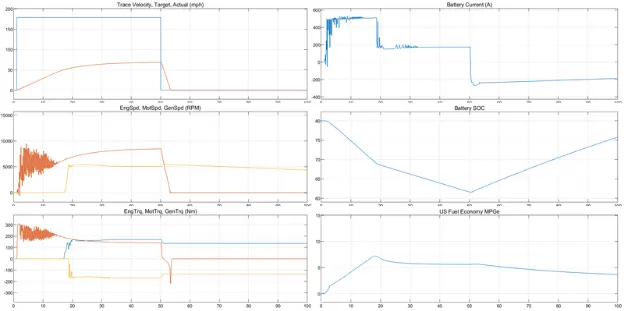
• In all the results we can observe some changes from the previous case
• Though the vehicle parameters and the drive cycle are the same here we have considered some changes in the environment blocks by adding some hill climb angles and wind velocity.
• The changes in the results are given below.
plot 1:
Shows the velocity of the vehicle with respect to the Drive cycle data with the Time scale on the x axis.
The top speed of 80 mph cannot be achieved as we have some additional forces acting and so the car can only run upto 67.2 mph
The acceleration time to reach top speed of 67.2 mph = 44.5 seconds
The deceleration time from 80 to minimum = 5.06 seconds
plot 2:
Shows the changes in speed of the Engine,motor and Generator in Rpm throughout the drive cycle.
Peak Engine speed = 4676 Rpm
Peak Motor speed = 8103.5 Rpm
Peak Generator speed = 12858.5 Rpm
plot 3:
Shows the Torque characteristics and its changes of engine,motor and generator in (Nm) throughout the drive cycle.
Peak Engine torque = 139.6 Nm; Peak Motor torque = 206.4 Nm
Peak Generator torque = 48.2 Nm
plot 4:
Shows the Battery Current values (A) and its changes for various acceleration inputs as per the Drive cycle.
The peak current discharge from the battery = 167.6A
The peak current charging to the battery =-152.46 A
Plot 5:
Shows the Battery state of charge SOC (%) and its changes corresponding to the driving inputs.
The state of charge decreased from 60% to 25.98 % of charge in a time period of 49.3 seconds, for the specified driving conditions.
Plot 6:
Shows the Fuel Economy as Mile per Gallons for the corresponding input driving conditions.
The maximum miles that the car can run per gallon of fuel equivalent = 17.93 Miles,for the given vehicle at the specified driving conditions
Observation:
• The simulation results for both the cases is found and we can see that the simulation 1 without the inclusion of hill climbing conditions and the wind drag velocity is much more efficient when compared to the simulation which includes the hill climbing conditions and the wind drag velocity.
• The vehicle was not able to achieve the required top speed though using the highest possible current discharge of that same battery used before.
• The state of charge also shows that the discharge is also high compared to the simulation 1
• The Fuel Economy is also down to half of the previous simulation.
• So one can say, it is evident that the efficiency of no load vehicle is high compared to the vehicle with additional loads acting on them and also we have visualized this using the Powertrain blockset.
============ ===== =====================================================================================
Aim : Keeping all other parameters same, compare the simulated results of hybrid and pure electric powertrains.
Theory : Electric powertrain systems include the main components that generate and deliver power to the road surface for fully electric, hybrid electric and plug
-in hybrid electric vehicle applications.
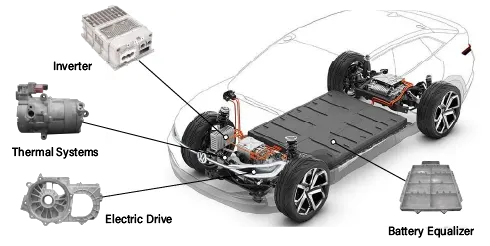
Pure Electic Vehicles (also know as battery electric vehicles) run off one power source only - the electric battery. There is no combustion engine present which means they are
the cleanest option and never produce tailpipe emissions and hence the most sustainable.
They do however have range anxiety, if you run out of electricity that’s it, just like if you ran out of petrol or diesel; hence there are some additional things you need to consider
before purchasing a pure electric vehicle.
Case 1
Simulation Condition:
The simulation is done for pure electric & Hybrid electric vehicle with Wide open Throttle (WOT) Drive cycle.
The Total cycle time = 100 seconds
The Top speed of this cycle = 80 mph
Time to start deceleration = 50 seconds
The Grade angle = 0 Degrees
The wind velocity =0 m/s.
plot 1:
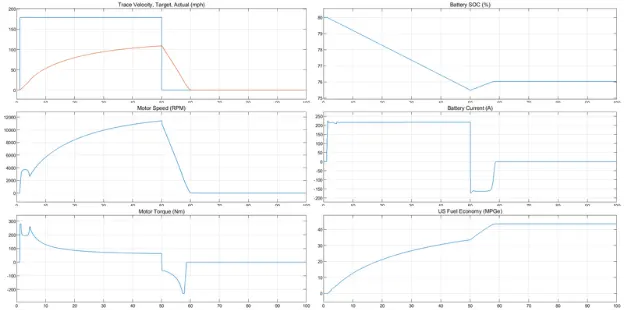
Shows the velocity of the vehicle with respect to the Drive cycle data with the Time scale on the x axis.
The top speed of 80 mph cannot be achieved as we have some additional forces acting and so the car can only run upto 1089mph
The acceleration time to reach top speed of 108.9 mph = 50.2 seconds
The deceleration time from 80 to minimum = 9.8 seconds
plot 2:
Shows the changes in speed of the Motor in Rpm throughout the drive cycle.
Peak Motor speed = 1123 Rpm
plot 3:
Shows the Torque characteristics and its changes of Motor in (Nm) throughout the drive cycle.
Peak Motor torque = 260 Nm
plot 4:
Shows the Battery Current values (A) and its changes for various acceleration inputs as per the Drive cycle.
The peak current discharge from the battery = 216.8 A
The peak current charging to the battery =-173.7 A
Plot 5:
Shows the Battery state of charge SOC (%) and its changes corresponding to the driving inputs.
The state of charge decreased from 80% to 75.5% of charge in a time period of 50.3 seconds , for the specified driving conditions.
Plot 6:
Shows the Equivalent Fuel Economy as Mile per Gallons for the corresponding input driving conditions Here there is no fuel in pure electri vehicle however this gives equivalent battery energy required that of the fuel energy, and calculates the Fuel efficiency.The maximum miles that the car can run per gallon of fuel equivalent = 20.45 Miles,for the given vehicle at the specified driving conditions.
Case2
Simulation Condition:
The simulation is done for pure electric & Hybrid electric vehicle with Wide open Throttle (WOT) Drive cycle.
The Total cycle time = 100 seconds
The Top speed of this cycle = 80 mph
Time to start deceleration = 50 seconds
The Grade angle = 8 Degrees
The wind velocity = 10 m/s.
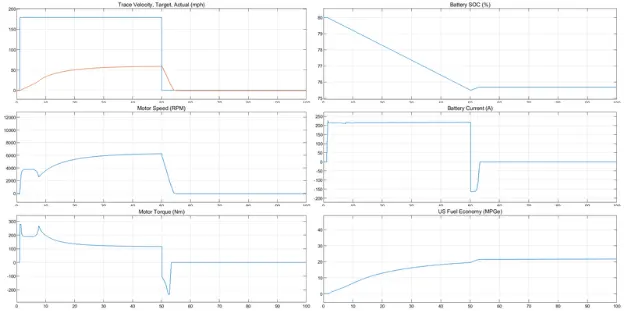
plot 1:
Shows the velocity of the vehicle with respect to the Drive cycle data with the Time scale on the x axis.
The top speed of 80 mph cannot be achieved as we have some additional forces acting and so the car can only run upto 58.9mph
The acceleration time to reach top speed of 58.9 mph = 48.8 seconds
The deceleration time from 80 to minimum = 4.63 seconds
plot 2:
Shows the changes in speed of the Motor in Rpm throughout the drive cycle.
Peak Motor speed = 6254 Rpm
plot 3:
Shows the Torque characteristics and its changes of Motor in (Nm) throughout the drive cycle.
Peak Motor torque = 280 Nm
plot 4:
Shows the Battery Current values (A) and its changes for various acceleration inputs as per the Drive cycle.
The peak current discharge from the battery =225.8 A
The peak current charging to the battery = -163.7 A
Plot 5:
Shows the Battery state of charge SOC (%) and its changes corresponding to the driving inputs.
The state of charge decreased from 80% to 75.5% of charge in a time period of 49 seconds, for the specified driving conditions.
Plot 6:
Shows the Equivalent Fuel Economy as Mile per Gallons for the corresponding input driving conditions Here there is no fuel in pure electric
vehicle however this gives equivalent battery energy required that of the fuel energy, and calculates the Fuel efficiency. The maximum miles that
the car can run per gallon of fuel equivalent = 21.45 Miles,for the given vehicle at the specified driving conditions.
Observation(Pure Electric VS Hybrid Vehicle With Same Load Conditions):
1. The electric vehicle when compared with hybrid electric vehicle with the same environmental and Drive cycle conditions results in less top speed achievement .
The electric vehicle produces more values of Motor speed and motor torque compared to the hybrid vehicle's motor alone,but hybrid vehicle when it combines the torque of
both motor and its engine it is higher than the electric vehicle's torque This is responsible to pull the Hybrid car at higher top speed compared to the pure electric.
2. As the pure electric car here uses Lithium-ion battery compared to the Nickel metal hydride battery the discharging capacity and the rate of charging is higher in
the pure electric car. As it is able to discharge in a fast rate the motor can produce high amount of torque instantly compared to the hybrid vehicle. Also the state of charge
shows the battery efficiency of the pure electric to be higher than the hybrid vehicle and this is also due to the battery type used in these cars.
3. The efficiency of the Electric car is higher than the hybrid car which is evident from the miles per gallon numbers of both of these cars.
4. Electric vehicle produces zero emissions whereas the hybrid one's produce waste gas emission.These are some of the observations from the comparision of the above
simulations using Powertrain Blockset.