Week-4 Challenge WOT Condition Part-2
Mapped Model and Dynamic Model:
Aim: To differentiate between mapped and dynamic model of engine, motor and generator.
Objective: To study the mapped and dynamic model of engine, motor and generator and Change the model type inside the powertrain blockset module.
Explanation:
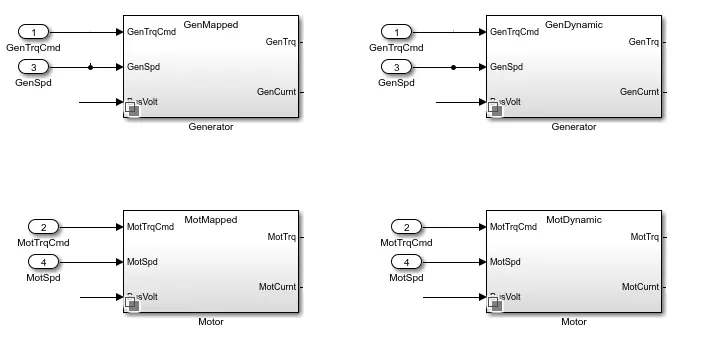
Mapped model:
Mapped engines represent macro engine behavior as a set of lookup tables (brake torque, fuel flow, air mass flow, exhaust temperature, efficiency, and emissions) as functions of commanded load and measured engine speed.
- Model decomposes the engine behavior into engine characteristics that are separated into lower-level components. By combining components in this way, the models capture the dynamic effects.
- Mapped engine models are suitable for analysis and design activities that do not require engine subsystem dynamic characteristics, for example, in engine and transmission powertrain matching analysis for fuel economy, emissions, and performance.
- Mapped model uses a set of steady-state lookup tables to characterize engine performance. The tables provide overall engine characteristics, including actual torque, fuel flow rate, and emissions.
- Mapped model is used for quasi steady-state engine simulations.
Dynamic Model:
- Dynamic engines decompose engine behavior into individual component models that account for engine dynamics, most notably intake airflow and turbocharger dynamics.
- Dynamic engine models are suitable for designing control, estimator, and diagnostic algorithms that depend on dynamic subsystem states.
- Dynamic models uses dynamic state or real time conditions to characterize the performance.
- Dynamic model is used to analyze the impact of individual engine components on the overall performance.
Changing the model type:
We can switch between engine, motor & generator model types based on the application. To change the model type,
- Open the model and select the Passenger block and explore it.
- Now select Electric Plant to make changes for Motor or generator to be Mapped or dynamic.
- Right click on either Motor or Generator then go to variant > Label mode active choice > Mapped or Dynamic mode.
For Engine Mode selection, open Engine plant instead of Electric plant and follow similar steps.
Conclusion:
By following the steps of changing the model type, we can switch between engine, motor & generator model types based on the application.
Miles per Gallon:
Aim: To study the Miles per Gallon(MPG) and fuel flow of the Model.
Objective: To understand the calculation of Miles per Gallon and the factors that are considered to model fuel flow.
Introduction:
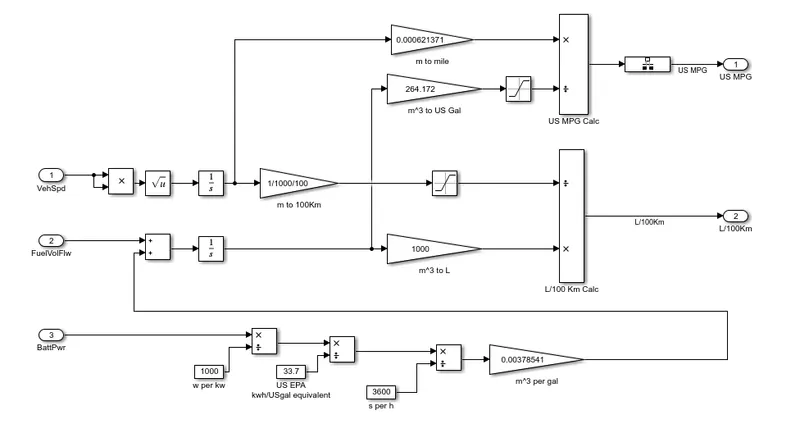
MPG, or miles per gallon, is the distance, measured in miles, that a car can travel per gallon of fuel. MPG is also the primary measurement of a car's fuel efficiency: The higher a car's MPG, the more fuel efficient it is.
Fuel flow of Model:
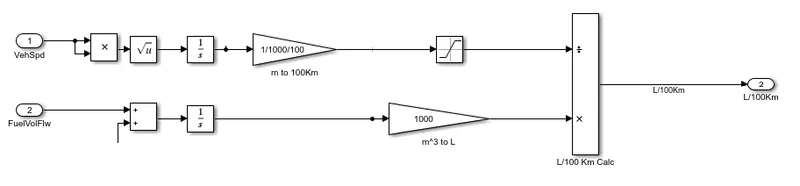
Input for the fuel is either petrol or diesel which is added along with the battery power in the HEV, the unit of flow of fuel is Kg/sec which is then integrated by the block to get volume(m^3). The volume is multiplied by 1000 to convert the volume in Litres.
Hence we can know that how many litres of fuel is consumed by the vehicle to cover a distance of 100 Km.
For IC Engine, only Fuel flow is considered for MPG Calculation and for HEV, fuel flow along with battery power is considered for MPG calculation.
Factors considered for model fuel flow are:
1.Fuel economy.
2.Fuel Consumption.
HEV Model with WOT:
Aim: To run the HEV Reference Application with WOT drive cycle.
Objective: To simulate the HEV Reference Application with WOT drive cycle and to observe the changes by changing the grade and wind velocity.
Model:
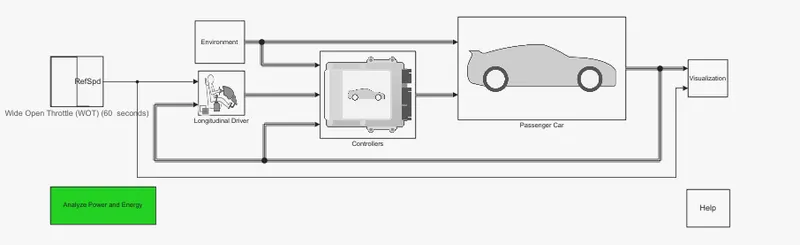
Without changing the environmental parameters:
Initially, we select a WOT drive cycle from the block and change the nominal speed to 30mph, the time to start deceleration to 40sec and set the simulation time as 60sec.
Here, Standard Environmental conditions are:
Temperature = 300K
Pressure = 101325 bar
Grade = 0 degree
Wind velocity = 0 m/hr
Changing the environmental parameters:
The grade value is changed to 5degrees and the wind velocity is 6m/s.
Outside temperature is 300K , the pressure on the vehicle is 101325 bar. Now the model is made to run.
Results:
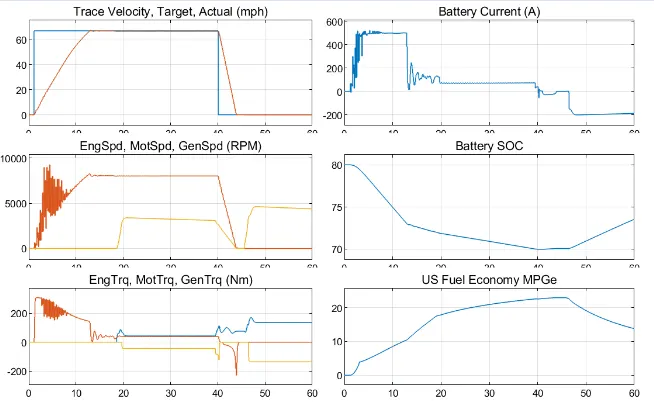
Plot1:
Plot shows the changes in velocity of the model for WOT drive cycle.
In this simulation, the model couldn’t attain the set velocity in the given time.
The model was to attain the required velocity in instantly, but it took 13 seconds. This shows that more battery power is required for the model.
Also, the model took 4 seconds more decelerate to 0mph. The reason for this may be inertia or less braking force applied.
Plot-2:
Plot shows the changes in the speed of motor and engine for WOT drive cycle.
The motor is at rest initially and its speed is zero. As the model is made to run with WOT, the motor speed reaches to a maximum of 9460RPM and it slows down during deceleration.
The engine starts to work if the required velocity of model is not obtained through battery, the engine speed reaches a maximum of 3400RPM and reduces during deceleration.
Plot-3:
Plot shows the changes in the motor torque and engine torque for WOT drive cycle.
The motor torque reaches a maximum of 310Nm to accelerate the vehicle. The engine torque reaches a maximum of 88Nm which is less than the motor torque as more power is consumed from motor.
If the motor is running, the generator speed reduces and as the vehicle decelerates, the generator speed increases.
Plot-4 :
Plot shows the changes in the Battery current for WOT drive cycle.
The maximum current discharge from the battery is 510A during acceleration and during deceleration, the generator transfers current to the battery and charges the battery to a maximum current of 200A.
Plot-5:
Plot shows the changes in the Battery State of Charge(SOC) for WOT drive cycle.
As the battery current is utilized, the State of charge (SOC) reduces. This happens during the acceleration and the SOC increases during deceleration as generator produces current.
Plot-6:
Plot shows the Fuel economy for the model in Miles per gallon for WOT drive cycle.
This plot shows the US fuel economy in MPGe and the maximum MPGE achieved in this case is 23MPGE during acceleration and reduces during deceleration.
Changing the environmental conditions:
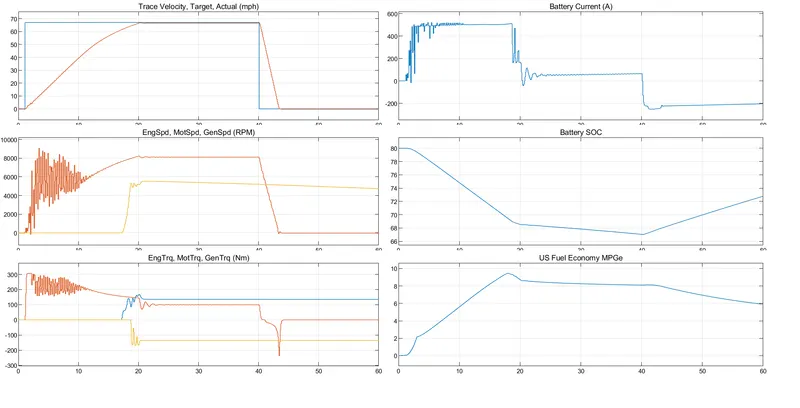
Plot-1:
Plot shows the changes in velocity of the model for WOT drive cycle.
It took 21 seconds to attain a max. speed of 65mph for the vehicle. The time taken by this model is slightly more due to increase in grade and wind velocity.
Plot-2:
Plot shows the changes in the speed of motor and engine for WOT drive cycle.
Max. motor speed is 9083RPM and Max. Engine speed is 5604RPM.
In this case, the Engine is slightly more in use compared to the previous case due to the changes in the environment.
Plot-3:
Plot shows the changes in the motor torque and engine torque for WOT drive cycle.
The Max. motor torque is 316Nm and Max. Engine torque is 174Nm. The engine has generated more toque in this case.
Plot-4:
Plot shows the changes in the Battery current for WOT drive cycle.
The Max. battery current discharge is 524A and starts to decrease just before the deceleration. The max. charging current is 235A to the battery.
Plot-5:
Plot shows the changes in the Battery State of Charge(SOC) for WOT drive cycle.
The battery SOC falls as low as 68.5 in 20seconds to accelerate to max. speed. When the model reaches the required speed, its SOC will reduce gradually. The SOC will increase during deceleration with the help of generator.
Plot-6:
Plot shows the Fuel economy for the model in Miles per gallon for WOT drive cycle.
This plot shows the US fuel economy in MPGe and the maximum MPGE achieved in this case is 9.6 during acceleration and reduces during deceleration.
Comparison between Pure EV and HEV:
Aim: To compare the pure Electric powertrain with the HEV powertrain.
Objective: To simulate the electric powertrain model and comparing it with the HEV model keeping all parameters same.
Model:
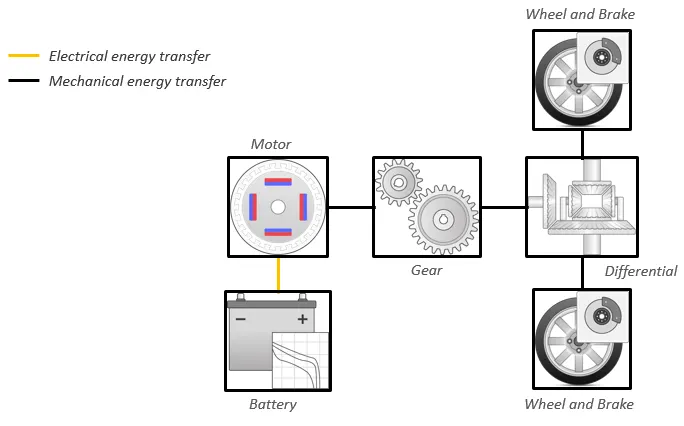
The electric vehicle reference application is configured with a mapped motor and battery. The diagram above shows the powertrain configuration.
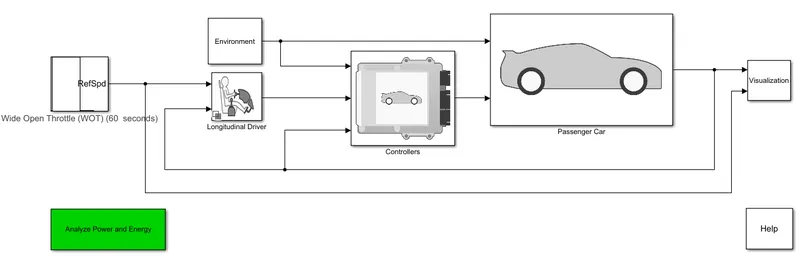
We select a WOT drive cycle from the block and change the nominal speed to 30mph, the time to start deceleration to 40sec and set the simulation time as 60sec as done for the HEV model.
Results:
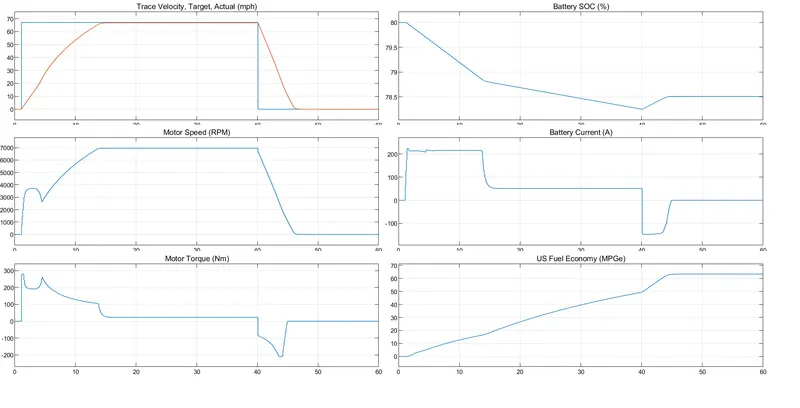
Plot-1:
Plot shows the changes in velocity of the model for WOT drive cycle.
We can see that the required speed is not attained by the EV model and the model took more time to accelerate. The motor power is not sufficient to make the model run at the required speed.
Plot-2:
Plot shows the changes in the speed of motor for WOT drive cycle.
The max. motor speed here is 7000RPM.
Plot-3:
Plot shows the changes in the motor torque for WOT drive cycle.
Max. Motor torque here is 282Nm and the motor torque reduces during deceleration.
Plot-4:
Plot shows the changes in the Battery State of Charge(SOC) for WOT drive cycle.
Battery SOC reduces from 80% to 78.25% during acceleration and increases during the deceleration.
Plot-5:
Plot shows the changes in the Battery current for WOT drive cycle.
The max.current discharged from the battery here is 226A and the max. charging current to the battery is 152A.
Plot-6:
Plot shows the Fuel economy for the model in Miles per gallon for WOT drive cycle.
Here, the model is pure electric vehicle. No fuel is required for this model but for a model that runs on fuel with similar parameters, it is equivalent to 49MPGe as shown in the plot.
Conclusion:
With all similar parameters, the pure electric model was not able to attain the required speed. The HEV has both Battery and Engine power, so it can attain the required speed. The performance may change for different specifications of the motor.
The pure Electric Vehicle is more efficient compared to the hybrid Electric Vehicle as the value of MPEG is more in Pure EV.
The discharge of current is slow in the pure EV, but the discharge of current in HEV is very high this is because the system is specifically designed for battery controls in pure EV.
The battery SOC reduces gradually in pure EV whereas in HEV SOC reduces at higher rate.
Hybrid Electric Vehicle involves burning of fuels which leads to emission of gases, but the pure EV has zero emissions as no engine is present in it.