Week-4 Challenge WOT Condition Part-2
Q.1 DIFFERENCES BETWEEN MAPPED AND DYNAMIC MODEL OF ENGINE,MOTORAND GENERATOR.
| MAPPED MODEL | DYNAMIC MODEL |
| 1.Mapped engines represent macro engine behavior as a set of lookup tables (brake torque, fuel flow, air mass flow, exhaust temperature, efficiency, and emissions) as functions of commanded load and measured engine speed. | 1.Dynamic engines decompose engine behavior into individual component models that account for engine dynamics, most notably intake airflow and turbocharger dynamics. |
|
2.Model uses a set of steady-state lookup tables to characterize engine performance. The tables provide overall engine characteristics, including actual torque, fuel flow rate, BSFC, and engine-out exhaust emissions. |
2.Model decomposes the engine behavior into engine characteristics that are separated into lower-level components. By combining components in this way, the models capture the dynamic effects |
3.
|
3.
|
| 4. Runs faster | 4. Runs slower |
| 5.Having motor data we can map motor | 5.Having actual motor and motor controller |
| 6.Based on provided data sheet value | 6.Based on any given value. |
HOW MODEL TYPE CAN BE CHANGED
ONE can switch between engine model types based on your application.
Dynamic engine models are suitable for designing control, estimator, and diagnostic algorithms that depend on dynamic subsystem states, for example, in closed-loop AFR control algorithm development.
Mapped engine models are suitable for analysis and design activities that do not require engine subsystem dynamic characteristics, for example, in engine and transmission powertrain matching analysis for fuel economy, emissions, and performance tradeoffs.
Q.2
MODEL CALCULATION FOR MILE PER GALLON
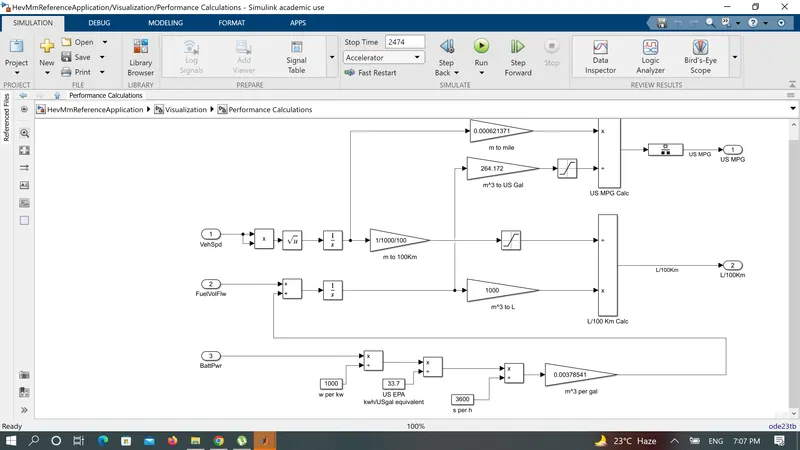
AFTER ENTERING THE VALUE OF PERFORMANCE
WE analyze that
1. Battery power in w per hour is divided to convert in kw p h .
2. To conver it into US epa it is divided by 33.7
3. Then it is divided by 3600 to convert per second.
4. Then it is converted into m^3 per galon.
For flow rate
we trace this value and add with flow volume rate then after integration we can calculate the model fule flow .
Q.3 .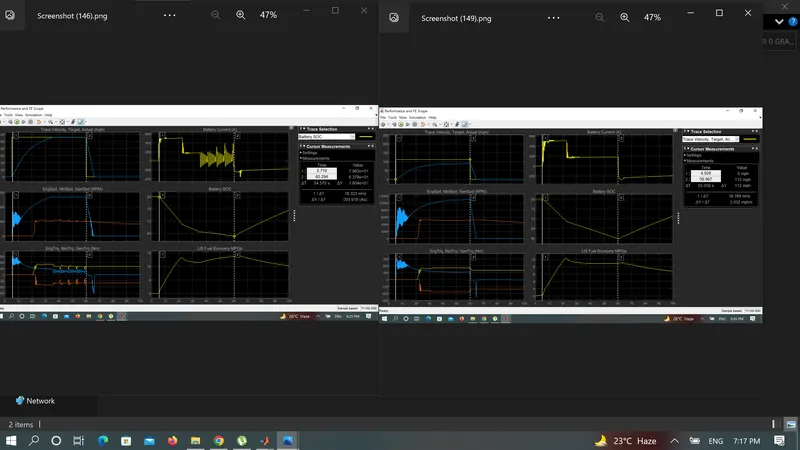
in question for comparison following data is observed
| HEV AT NO GRADE NO WIND VELOCITY | HEV AT 5 % GRADE AND 10 WIND VELOCITY |
| 1. OUTPUT IS MATCHING AS SAME IN 35 SEC | 1.OUTPUT IS NOT ABLE TO MATCH TILL 60 SECONDS WHEN DEACCELERATION STARTED. |
| 2. BATTERY DISCHARGING IS NOT CONTINUOUS | 2. BATTERY DISCHARGING IS CONTINUOUS. |
FOR THIS WOT CYCLE
CHANGES MADE ARE
START TIME =5 SEC
NOMINAL SPEED =50
TIME FOR DEACCELERATION =60
TIME FOR SIMULATION IS =100
SO Screenshots are pasted for result pfa.
Q.4
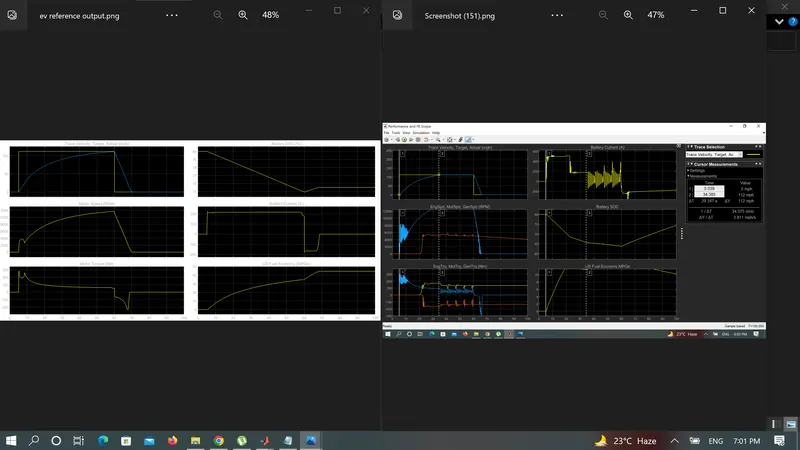
| EV REFERENCE | HEV REFERNCE |
|
1.IT IS TAKING TOO MUCH TIME OBTAIN THAT DESIRED OPTIMUM SPEED .AROUND 54 SEC. |
1TAKING LESS TIME TO ACHIEVE OPTIMUM SPEED AROUND 30 SEC. |
| 2. RESPONSE IS SLOWER | 2.RESPONSE IS FASTER |
| 3. DUE TO REGENERATIVE BRAKING BATTERY SOC IS CHARGING AND DISCHARGING TOO MUCH | 3. BATTERY SOC IS NOT AFFECTED MUCH DUE TO BRAKING . |
FOR THIS COMPARISON WOT CYCLE
CHANGES MADE ARE
START TIME =5 SEC
NOMINAL SPEED =50
TIME FOR DEACCELERATION =60
TIME FOR SIMULATION IS =100