Week-4 Challenge WOT Condition Part-2
Problem 1
Aim : The difference between mapped and dynamic model of engine, motor and generator
We are using the powertrain block set it consists of an advanced simulink models of the various architectures of velhicle which we can select the one of the architectures and simulate them in various conditions and drive cycle.
Powertrain Blockset provides a standard model architecture that can be reused throughout the development process.
There are the two models
- Mapped models
- Dynamic models
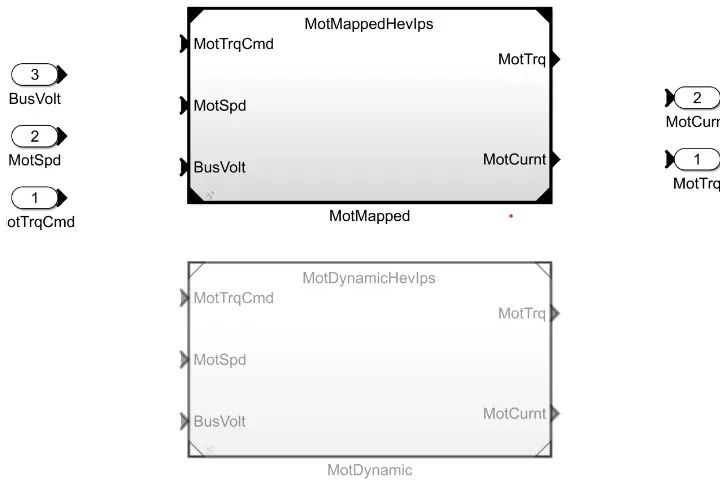
Mapped models
Here the model can be predefined values of a compact size of engine,motor and generator.It is very easy to simulate the mapped model system we should enter the Range as it is pre-determined and also it defines the output very quickly
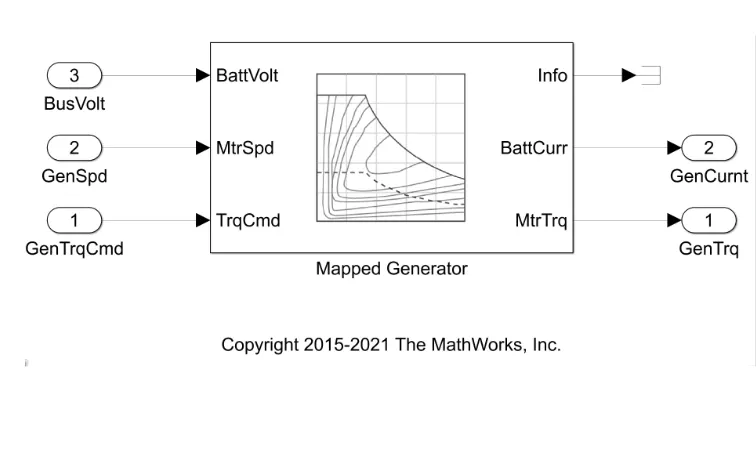
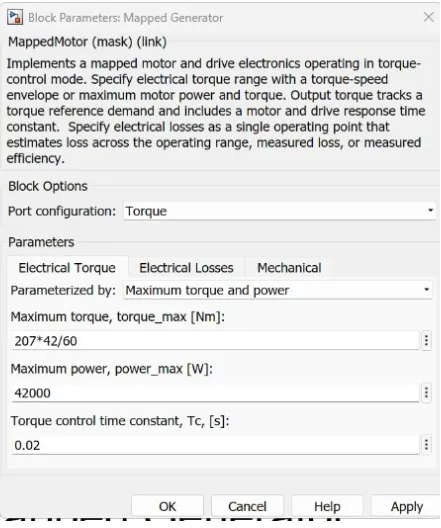
.
Dynamic Models
The dynamic model says that it's an actual speed model ,here it doesn't have any look tables and predefined values
We enter as it need the data according to its parameters as it necessary. The time of dynamic model simulation takes long duration to simulate(hardware speed).
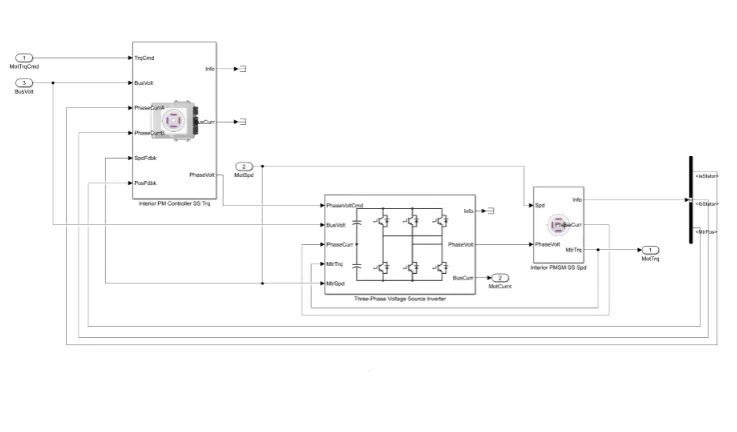
The given block parameters are interior PM controller. The dynamic control of a motor ,we are choosing the control type of Torque control we are taking the motor parameters to design the controller D-axis inductance, Q-axis inductance, Permanent Magnet flux and No.of poles pairs.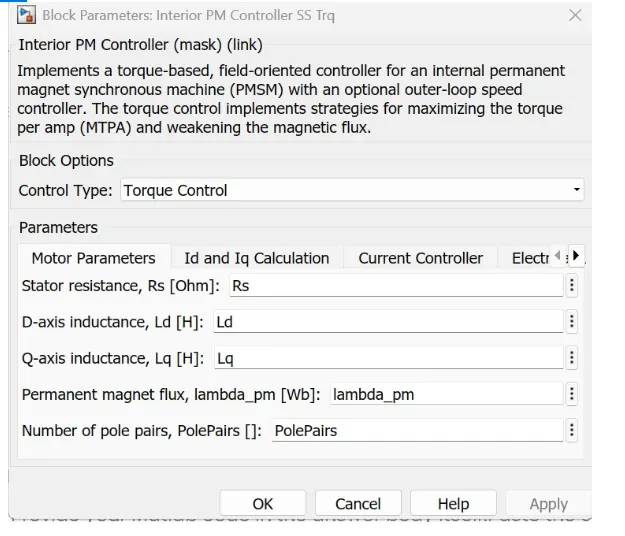
Change to the model type
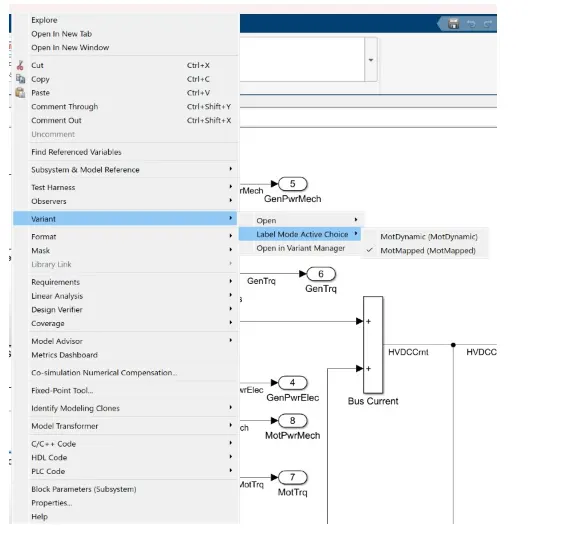
To change from the model type Firstly we are updating the matlab function to its blockset.We must load the variant subsystem to contracts with the matlab to its defined values . Mapped model architecture comes as it default. Here the label of system is switch from mapped model to dynamic model.The values are contracts to the matlab for its updates we select the switch T with the right click on the system by selecting the variant then we move to the label model on selecting variant block to select the model type .
Problem 2
Calculate miles per gallon
AIM To calculate the Miles per gallon of the velhicle the three inputs are performed ,they are velhicle speed ,fuel flow , battery power .The speed and fuel flow is taken to calculate. The battery SOC is specially calculated by taking the battery power in this system.
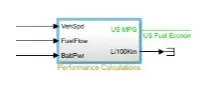
The velhicle speed data is used here to calculate the distance travelled by the velhicle from meters to miles and the battery power is used to find power used in kwh which is then converted to gasoline -equivalent using the Us metric.
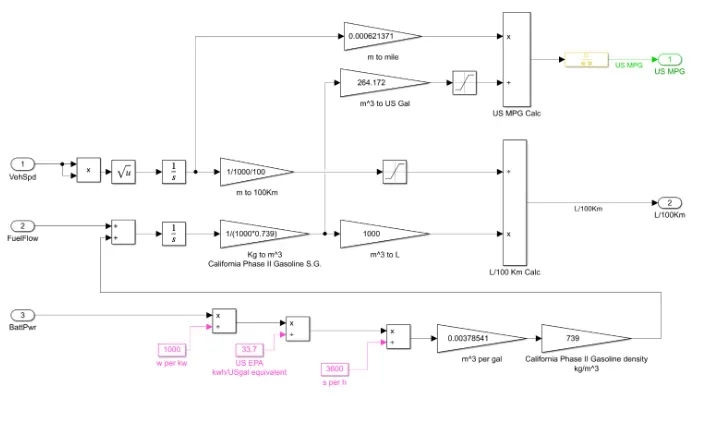
The formulae is Miles per gallon=`"Total miles driven"/"Total energy of all fuels consumed"is divided with the Enerygy of one gallon of gasolin``is equal to ("total miles driven")*("energy of one gallon of gasoline")is whole divided with total energy of all fuels consumed``
`can also calculate L/100km ,the conversations are used in the same subsystem is defined `
BY using the Battery power to gallon equivalent formulae is equal to the battery power /1300 w per kw is divided with 38.7 kwh and again divided with 3600 in its sec per h.
The amount of fuel at each moment is kg/sec.By integrating this we will gwt the mass fuel ,using 1/(1000*0.739).
Problem 3
AIM :The power train block set provides various model reference systems .Here we see the power spilt reference application.The block drive cycle is double clicked to change the type of drive cycle.
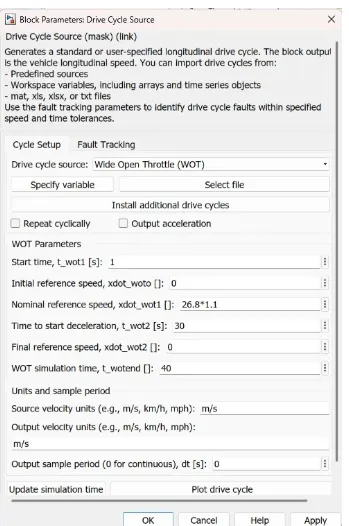
The default is set with FTP 75 drive cycle ,will change to wide open throttle.
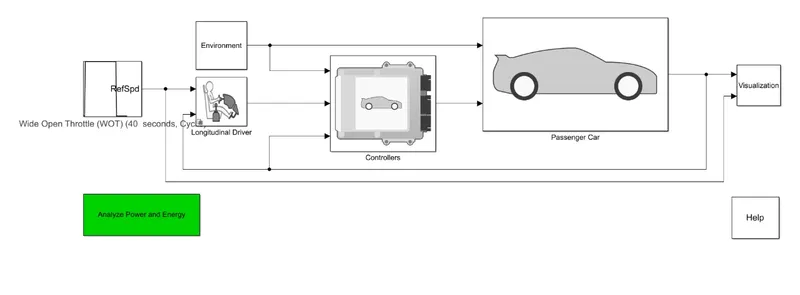
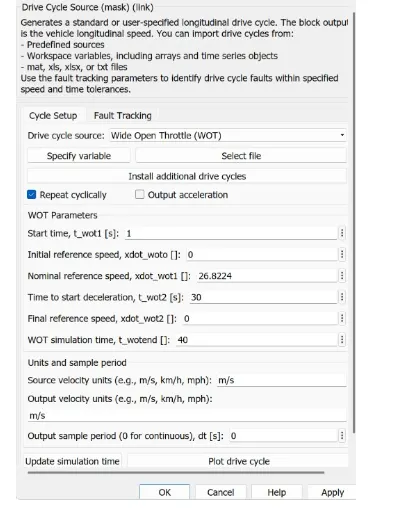
Simulation block results
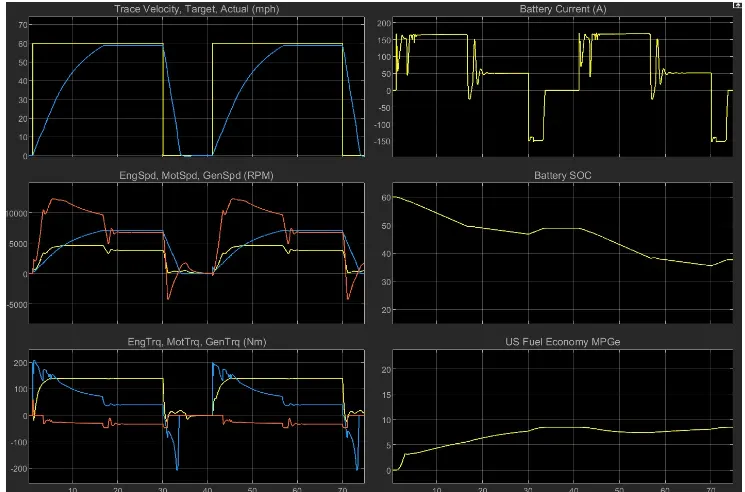
We can see the results that the wide open throttle response ,the acceleration time is suddenly increased.
e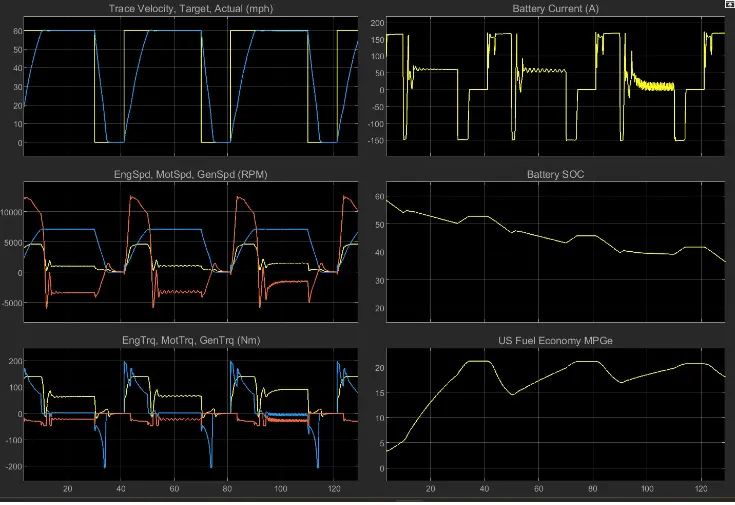
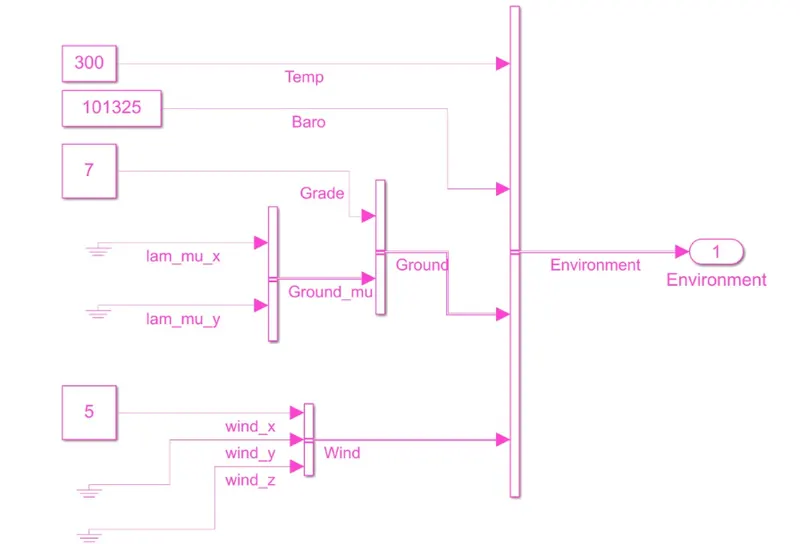
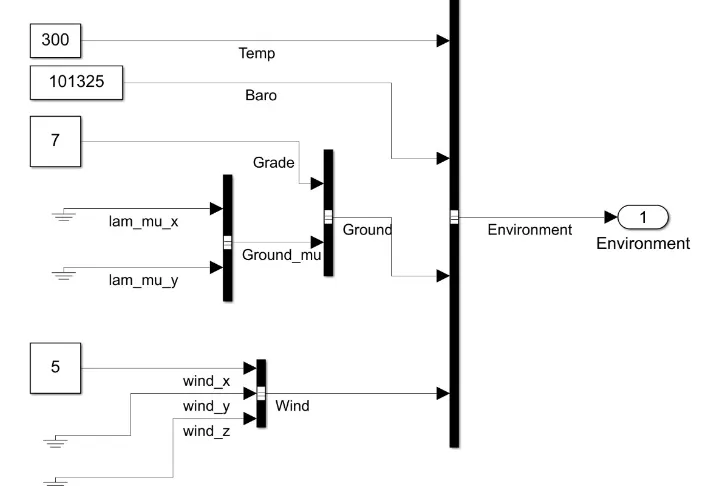
change the grade and wind velocity in the environment block
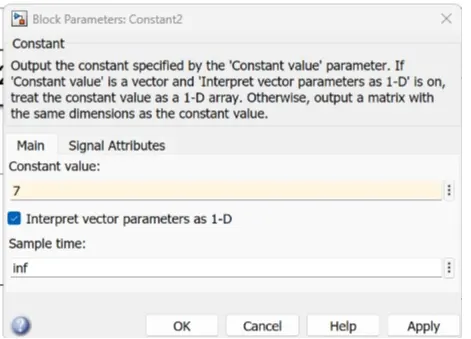
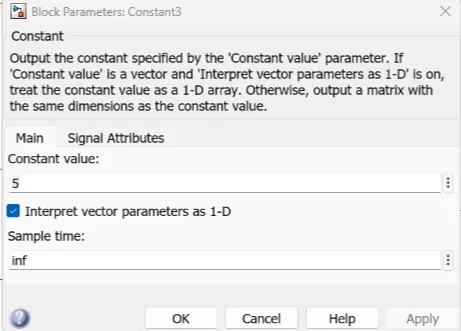
The intial condition is set to be zero for the wind and grade constants blocks.Let G=7,w=5 are given
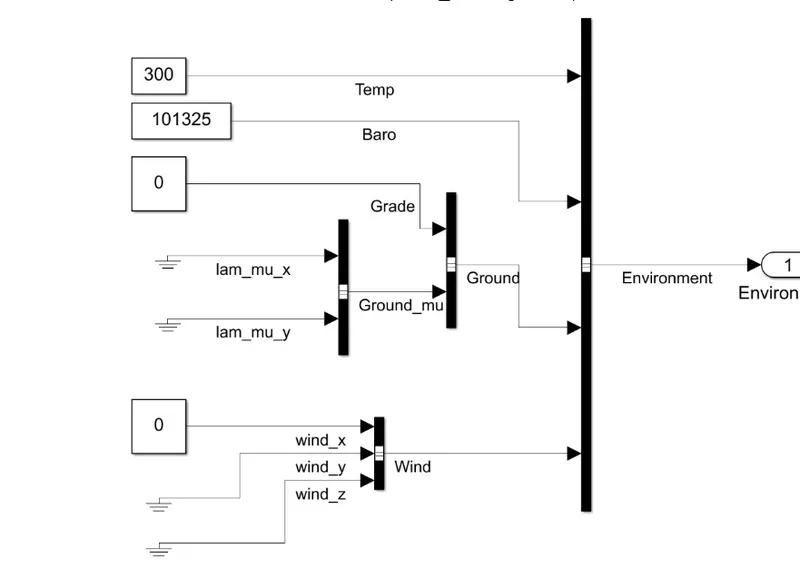
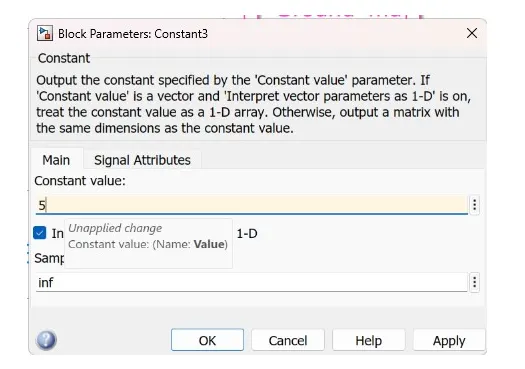
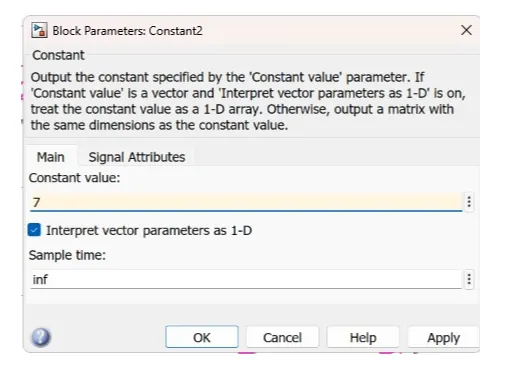
Now,here we can see the constants are 7 for the garde and 5 for the wind as we given .When we open the block to see the results in the given scope
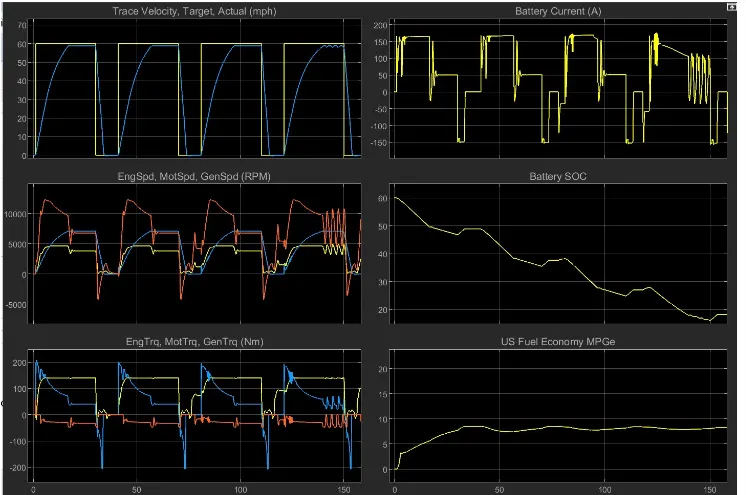
SCOPE
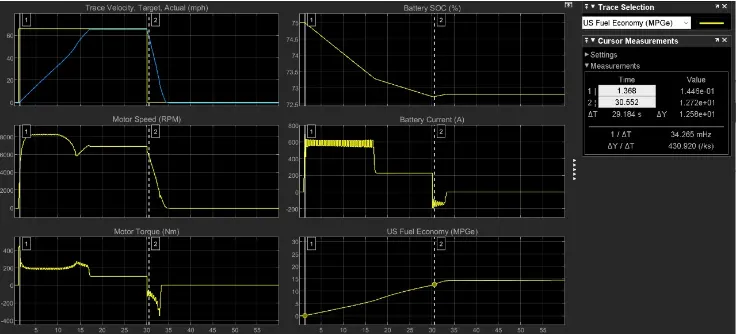
In the trace velocity ,target ,actual (Mph) we can see the slope like structure,the velocity curve has increases as we can observe in the graph and slag lag in the speed ,the torque segment has increased in spikes.As also we observe the battery SOC and US fuel economy are much faster than compare to default.
Problem 4
Keeping all other parameters same, compare the simulated results of hybrid and pure electric powertrains.
As per given aim the WOT drive cycle (wide open throttle)and also modified environment block.
Grade =7,Wind velocity=5
Scope
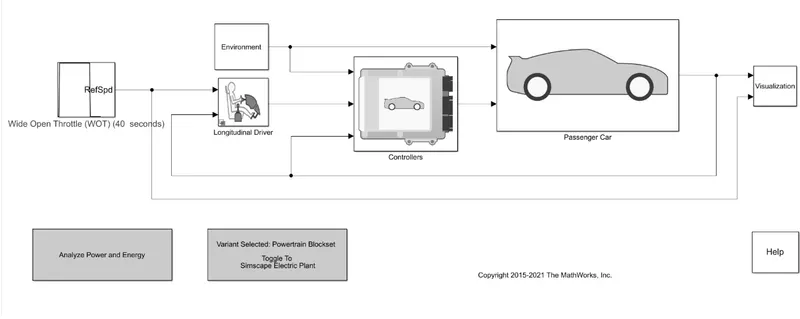
By the EV reference application is opened ,matching all the parameters same with its above mentioned HEV power spilt reference application.
By comparing the HEV and EV plots
We can see that the battery SOC EV reference has more decreasing line compared to HEV.
By comparing the velocity plots EV reference takes more time to HEV reference,Ev concumes more current than HEV.
Miles per gallon for EV is more when compared to HEV.The torque we can see same as closer consideration.
Conculsion
Therefore ,we can observe the difference between the Mapped models and dynamic models and how to change to the model as shown
Therefore for the miles per gallon calculation is calculated by using the formula and the fuel flow model is shown .
Therefore ,the HEV reference has simulated with the WOT drive cycle and the environment block parameters like grade and wind velocity is changed and it is simulated
EV reference is simulated by its compared parameters same by using the power train block system .