Week-4 Challenge WOT Condition Part-2
1. What is the difference between mapped and dynamic model of engine, motor and generator? How can you change model type?
Mapped Motor:-
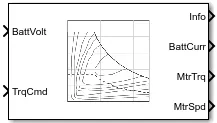
- The mapped model is one type where the data points are pre_assigned in lookup tables.
- The engine or motor torque required is sensed and the motor or engine block generates the requiered torque output just as required simply without considering the real time motor or engine, parameters.
- The output values are stored for the corrresponding given input values of the engine motor and generator.
- The accuracy of this type is not that high but the simulation will be done in much less time as it does not run by real time parameters.
- It drive electronics operating in torque control mode is called mapped model.
Dyanamic Model:-
- It runs by real time simulation where the required input from the drive cycle.
- Here the output takes time to react, because it is like the system has to check into individual system compents and then come at a desirable output.
- It runs by real time simulation where the required input from the drive cycle is taken and for that individiual real time simulation gets performed and summing all the results of the subsystem gives the output for the simulation.
- Dynamic models are used when the internal response to a model with respect to its components is needed.
Steps To Chnage the model Type:-
- Frst the type of powertrain blockset is selected (ie. pure EV, hybrid vehicle etc)
- Here i have selected the pure EV type. The passenger block is selected.
- Then select electric plant .
- then the select Motor block is selected.
- Right click on the Blank Space of the simulink platform
- then one window are showed then this window select the variant
- in verient select the label mode active choice
- Then select MotorgenEV mapped or dynamic.
2.How does the model calculate miles per gallon? Which factors are considered to model fuel flow?
Step 1
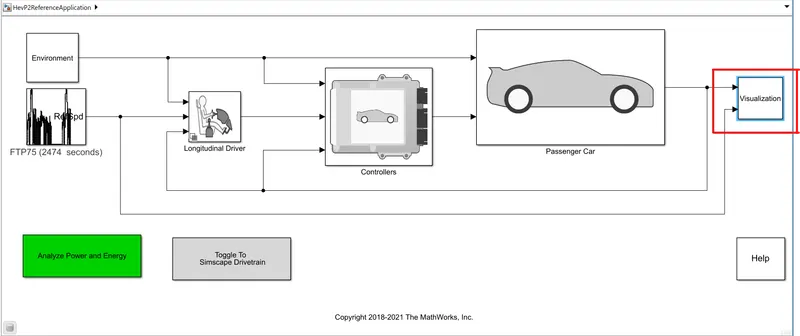
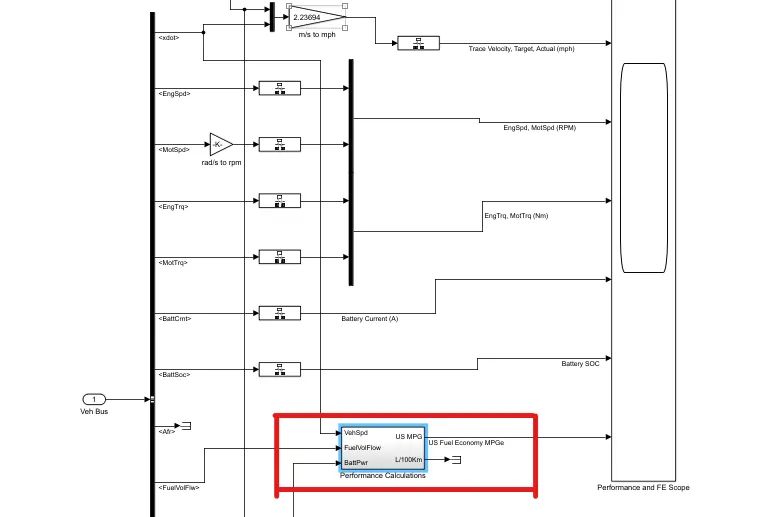
We need to go in the visualization blockset to see “does the modal calculate miles per gallon”. After going into the visualization blockset we need to go to the performance subsystem.
Step 2
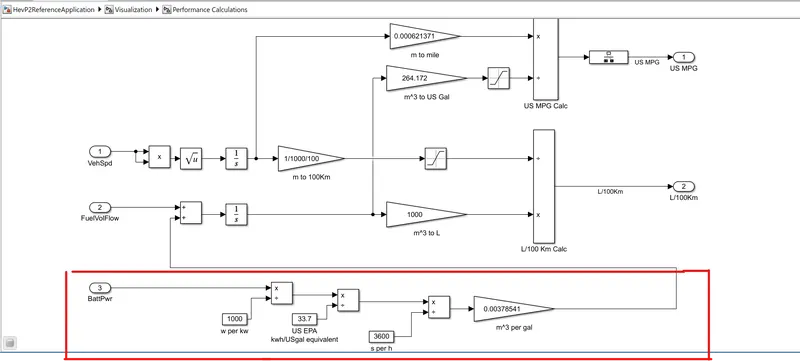
Performance Calculation:-As we can see in the below blockset, there are two inputs given vehicle speed and battery power. Here vehicle speed is converted into distance km and miles(US standard). Battery power is converted into volume m^3/gal. After that m^3/gal is converted into liters and gallons. Taking these two values distance and volume of fuel the miles per gallon is calculated.
Step 3
Model of fuel flow:- Here battery power is converted from w to kw, after that kw is converted into kwh/us gal according to the standard of Environmental Protection Agency, after that it is divided from 3600 and multiplied with gain block and after that integrated to convert m^3 and gallons.
Mainly only factors considered while modelling the fluid flow are fuel consumprtion and fuel economy.
Also Its Depend on the which type of type of refrance module we choose or consider.
In HEV refrance application
- One gallon is equivalent to 33.7 kilwatt hours of electricity.
- Unlike mpg, the lower the kWh/100m number, the better.
- Adapting to this smaller-is-better figure is likely the roughest math most of us will face in relation to EVs.
- Vehicle speed and battery power are main factors of MPGe.
3.Run the HEV ReferenceApplication with WOT drive cycle. Change the grade and wind velocity in the environment block. Comment on the results.
Simulink Model:-
Condition=1.
First we run the simulation For HEV reffrance In defaults condition.(Gradibility=0%,Wind Velocity=0%)
We Select the Wide Open Throtal(WOT) Driving cycle.
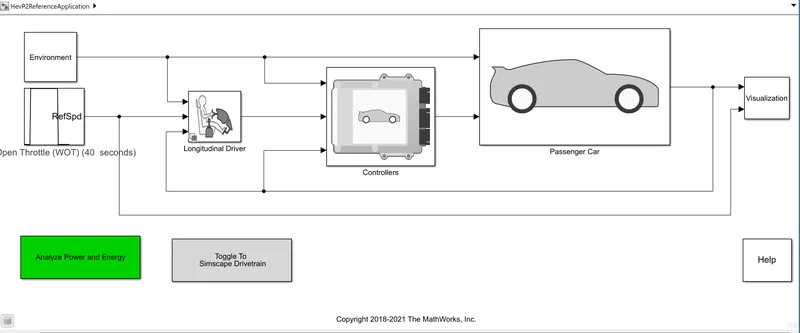
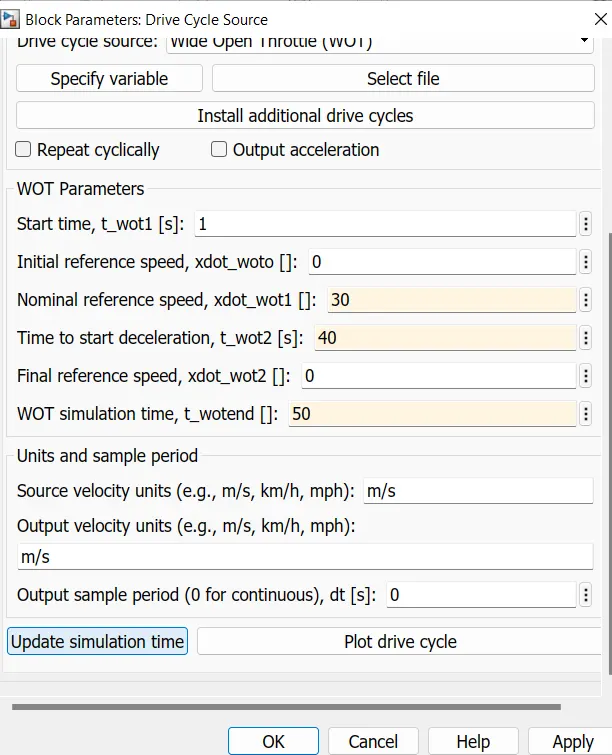
WE Run the simulation For defaults condition.
Start Time=1
Refrance speed is 30.
Decelaration Tiime =40
WOT time=50
Gradibility=0%
Wind Velocity=0%
Result:-
Scope1.
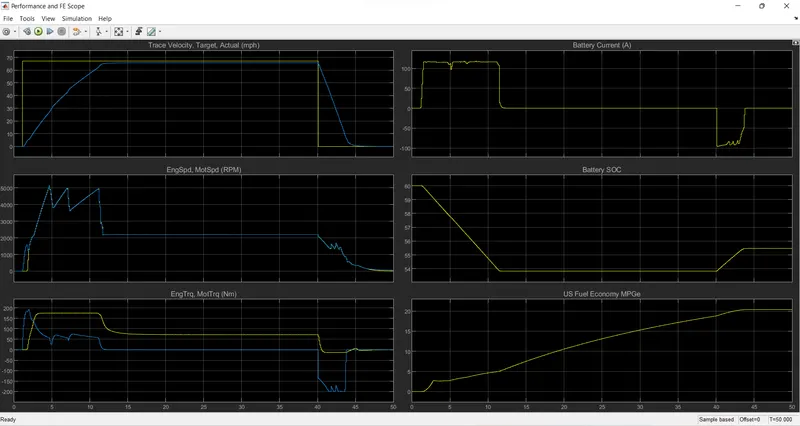
Frist Graph Show the Output OF the Trace velocity.
Second Graph is show the Motor Speed or Engine speed.
Third Graph show the Engine Or Motor Torque.
Fourth Graph show the Battery Current
Fifth Graph Show the State of Charge of Battery (SOC).
Sixth Graph show the Fuel Economy Miles per Gallon.
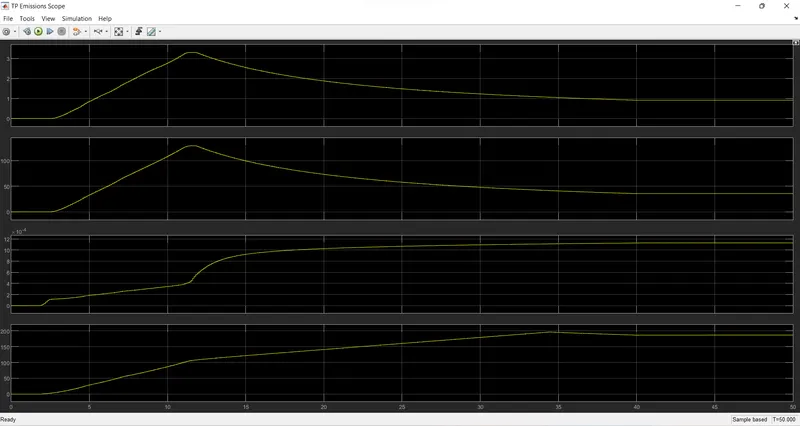
Scope2(Emmision Output).
Condition=2
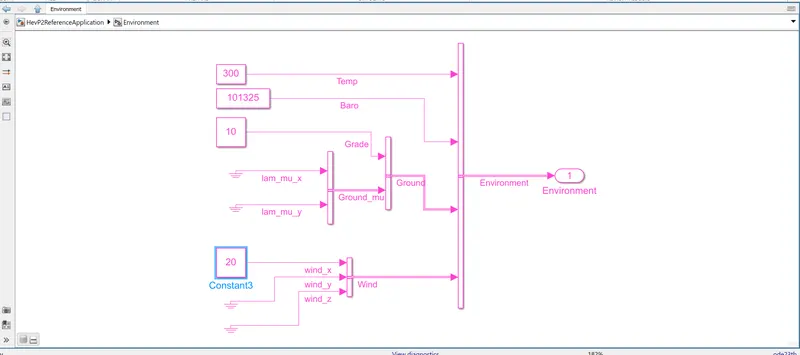
Second we run the simulation for condition.(Gradibility=10%,Wind Velocity=20%)
Start Time=1
Refrance speed is 30.
Decelaration Tiime =40
WOT time=50
Gradibility=10%
Wind Velocity=20%
Result:-
Scope1.
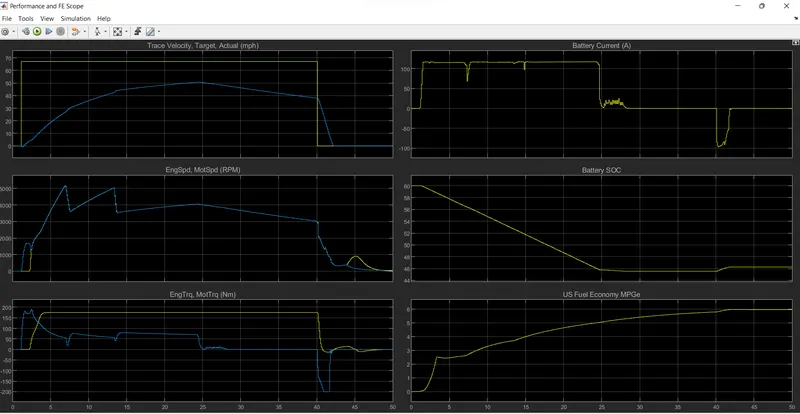
Frist Graph Show the Output OF the Trace velocity.
Peak Velocity is 67.The trace velocity remained 67.1 m/h till the deacceleration. but as we can see the actual velocity of the vehicle did not reach trace velocity because of gradeability and wind velocity has been increased
Second Graph is show the Motor Speed or Engine speed.
The value of current and engine power is also limited. As we can see in the 2nd plot the current is going negative after starting deacceleration
Third Graph show the Engine Or Motor Torque.
We can also see in plot 3 the speed of the motor and generator is the same and it overlaps.
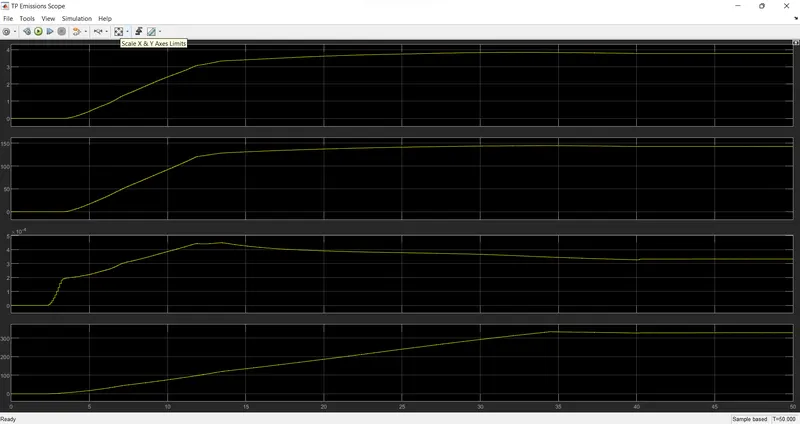
Scope2.
4.Keeping all other parameters same, compare the simulated results of hybrid and pure electric powertrains.
we run the simulation For EV reffrance.
Start Time=1
Refrance speed is 30.
Decelaration Tiime =40
WOT time=50
Gradibility=10%
Wind Velocity=20%
Scope.
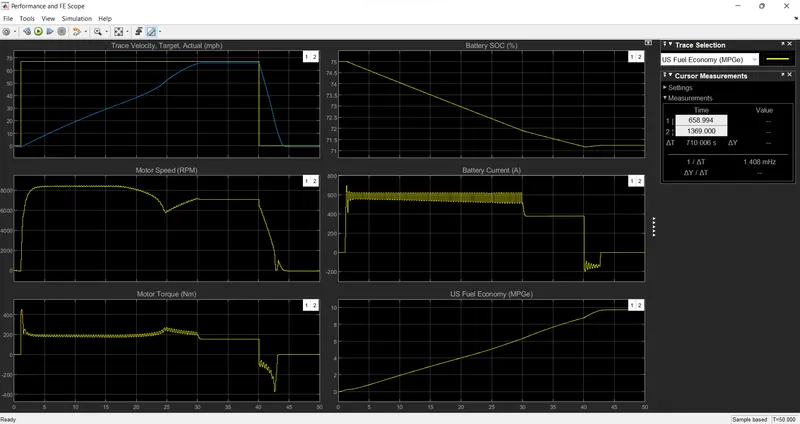
As we can see in the fully electric the actual speed of the vehicle is around 48 mph and in HEV 56 mph.
Frist Graph Show the Output OF the Trace velocity.
Peak Velocity is 67.The trace velocity remained 67.1 m/h till the deacceleration. but as we can see the actual velocity of the vehicle did not reach trace velocity because of gradeability and wind velocity has been increased