Week-4 Challenge WOT Condition Part-2
- What is the difference between mapped and dynamic model of engine, motor and generator? How can you change model type?
Answer:--
Mapped Model of Engine And Dynamic Model of Engine :--
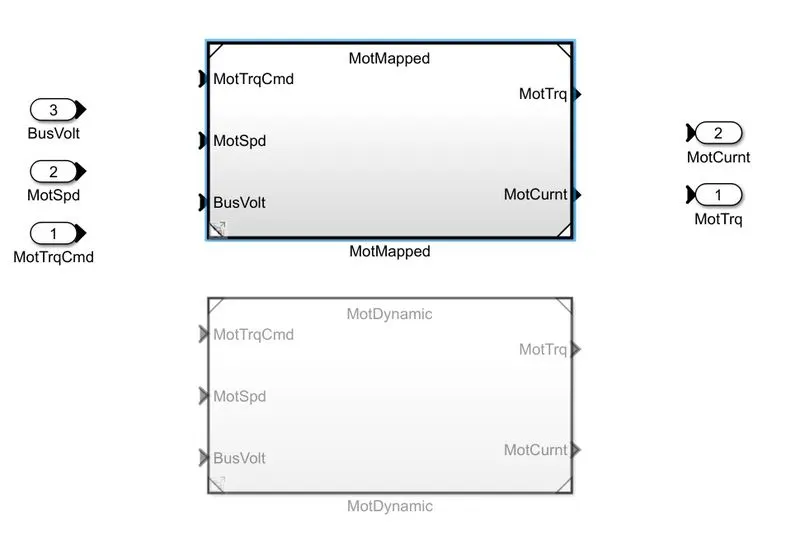
Mapped Model for Engine:--
--The Mapped Motor block implements a mapped motor and drive electronics operating in torque-control mode.
--The output torque tracks the torque reference demand and includes a motor-response and drive-response time constant.
--Use the block for fast system-level simulations when you do not know detailed motor parameters, for example, for motor power and torque tradeoff studies.
--The block assumes that the speed fluctuations due to mechanical load do not affect the motor torque tracking.
--The mapped model is one type where the data points are pre_assigned in lookup tables.
--The engine or motor torque required is sensed and the motor or engine block generates the requiered torque output just as required simply without considering the real time motor or engine, parameters
The Mapped Block is shown below
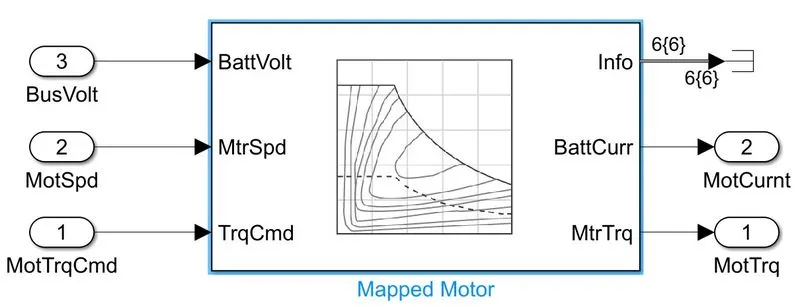
And The Mapped Block is assingned by a look up table
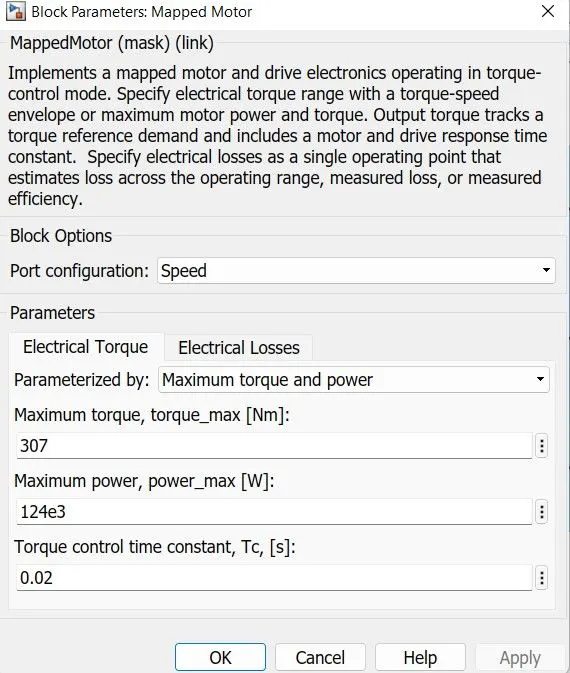
Dyanamic Model Block:--
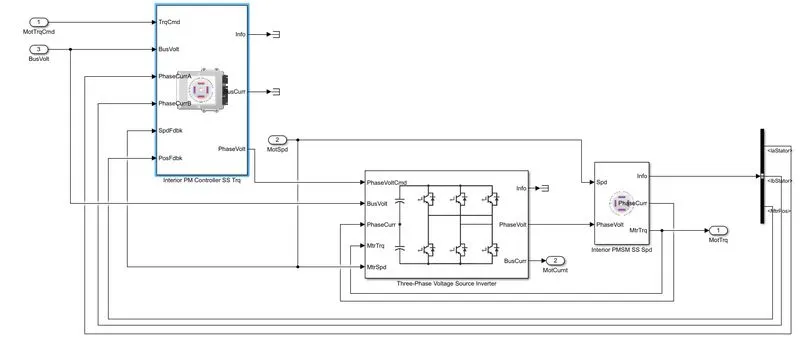
-- The dyanamic model in other hand uses the combination of the outputs from various subsystems to generate the output.
--It runs by real time simulation where the required input from the drive cycle is taken and for that individiual real time simulation gets performed and summing all the results of the subsystem gives the output for the simulation.
-- As per the drive cycle requirements the initial Bus voltage ,current is given along with the vehicle feedback so that it runs the actual simulation at that particuclar moment throught the drive cycle.
--The accuracy of this model is very high as it considers the real outputs from all the subsystem to generate the output.
--The simulation will take very long time to complete as it has so many individual simulations running by all the subsystem of the engine , motor/generator.
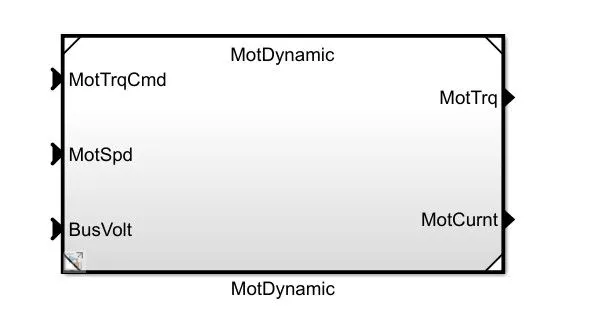
--The Dynamic Model represents the actual components
The figure below shows the working phase of the dyanamic model.
~How can you change model type?
Steps To Change The Model Type :--
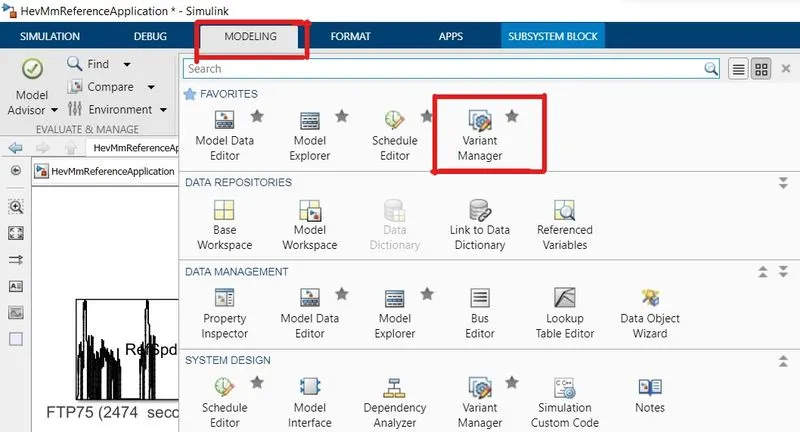
- On the Top Side of the Simulink Window click on Modeling
- And in that theres a Desing Option
- In that Select Variant manager
- And is shown in the below figure
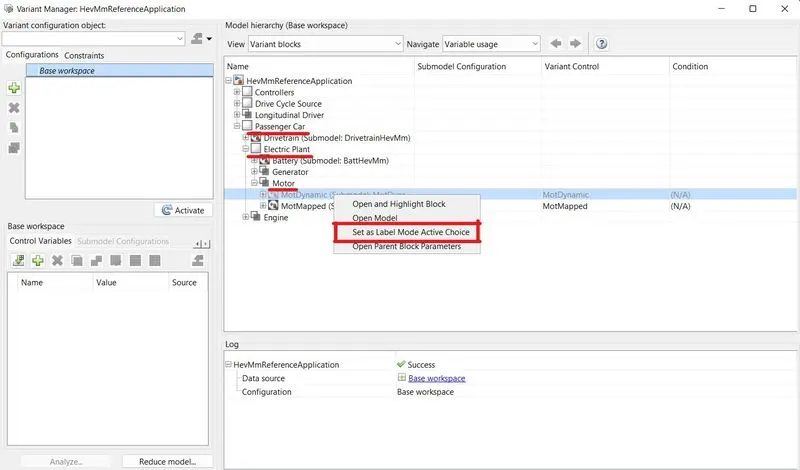
- Select Passenger Car and in that electric plant and in that motor and select the motor you want
- Click on Set as Lable Model Active Choice
2.How does the model calculate miles per gallon? Which factors are considered to model fuel flow?
Answers:--
Simulink block to calculate miles per gallon
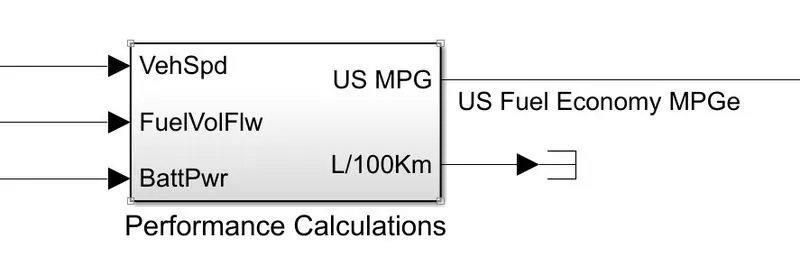
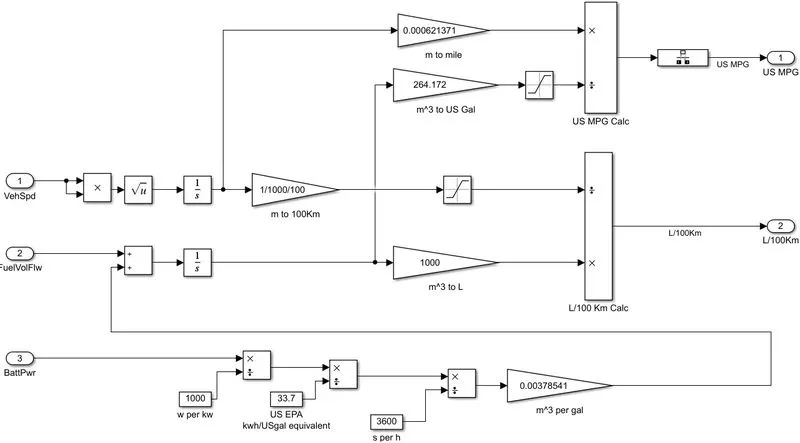
- vehicle speed data is used to calculate the distance traveled in meters which is then converted to miles
- Battery power data is used to find power used in kWh which is then converted to gasoline-equivalent using US EPA value by dividing with 33.7
- note: As per the US environmental protection agency(EPA) 1 gallon of gasoline is equal to 33.7 kWh
- Dividing distance traveled in miles by the number of gallons, we can get miles per gallon.
- For HEV this gallon(gasoline-equivalent of battery power) is added with gallon used by IC engine then miles per gallon is calculated.
There are three types
* Vehicle Speed and Fuel Volume
* Battery power
*vehicle Speed and Fuel Volume :--
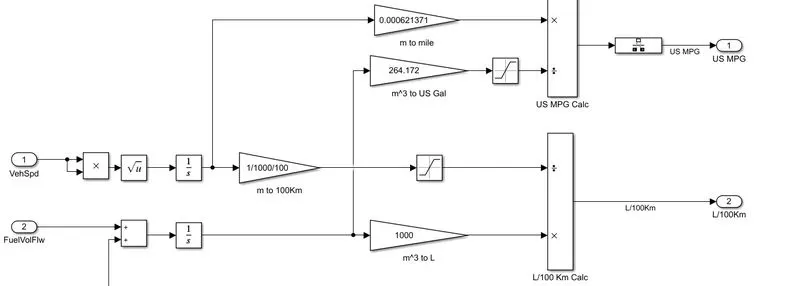
- vehicle speed data is used to calculate the distance traveled in meters which is then converted to miles
- The Vehicle speed is a important factor while considering the fuel consumption at that particular time,so to determine the fuel consumption throughout the drive cycle.
- Then the Fuel flow is expressed as the mass flow rate (i.e) the amount of fuel at each moment in Kg/Sec. Now integrating this will result in the mass of the fuel and by using this 1 we convert it to the volume and by multiply by 1000 to get it in Litres.
- By comparing the two results we can get the amount of litre consumed to Run for 100km.
* Battery power:--

- Battery power data is used to find power used in kWh which is then converted to gasoline-equivalent using US EPA value by dividing with 33.7
- note: As per the US environmental protection agency(EPA) 1 gallon of gasoline is equal to 33.7 kWh
~Which factors are considered to model fuel flow?
MPG, or miles per gallon, is the distance, measured in miles, that a car can travel per gallon of fuel. MPG is also the primary measurement of a car's fuel efficiency: The higher a car's MPG, the more fuel-efficient it is
3.Run the HEV ReferenceApplication with WOT drive cycle. Change the grade and wind velocity in the environment block. Comment on the results.
Answer:--
The hybrid electric vehicle reference application represents a full multimode hybrid electric vehicle (HEV) model with an internal combustion engine, transmission, battery, motor, generator, and associated powertrain control algorithms. Use the reference application for powertrain matching analysis and component selection, control and diagnostic algorithm design, and hardware-in-the-loop (HIL) testing. To create and open a working copy of the hybrid electric vehicle reference application project.
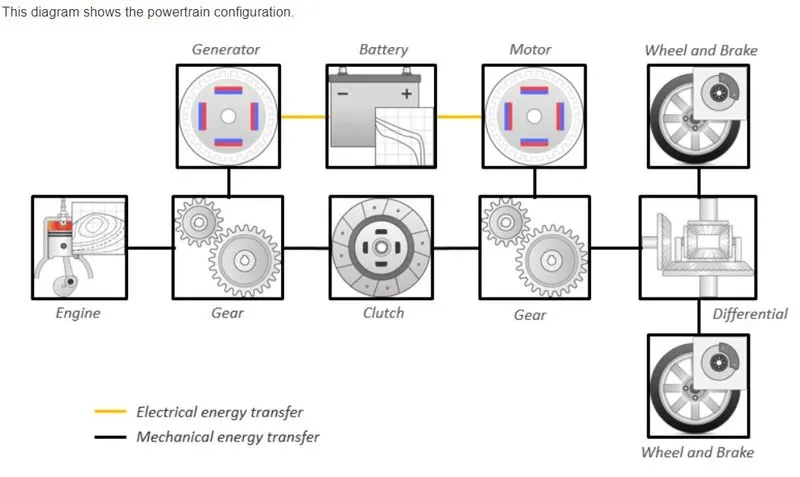
~~Input:--
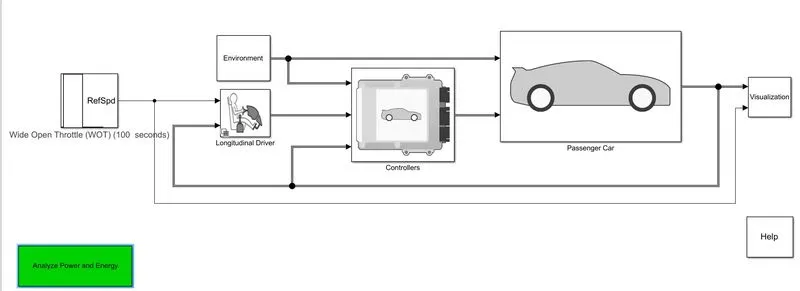
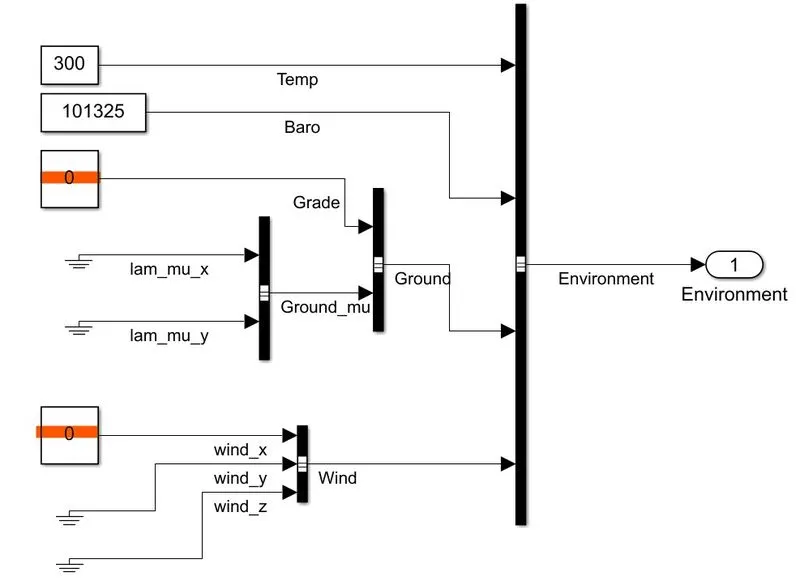
~Now keeping the Grade and Wind Same
~Now Changing the Wide Open Throttle Variable and keeping rest all other thing same
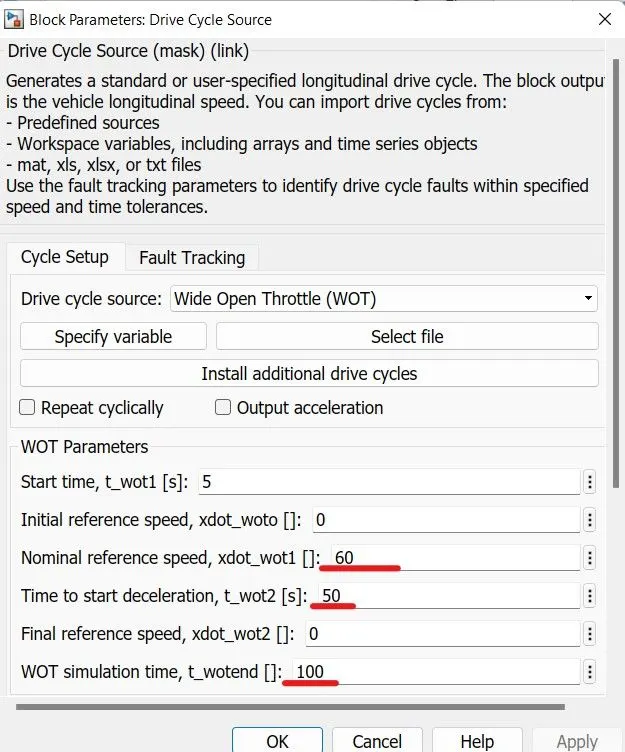
~OutPut :--
Grade - 0, wind velocity 0m/s
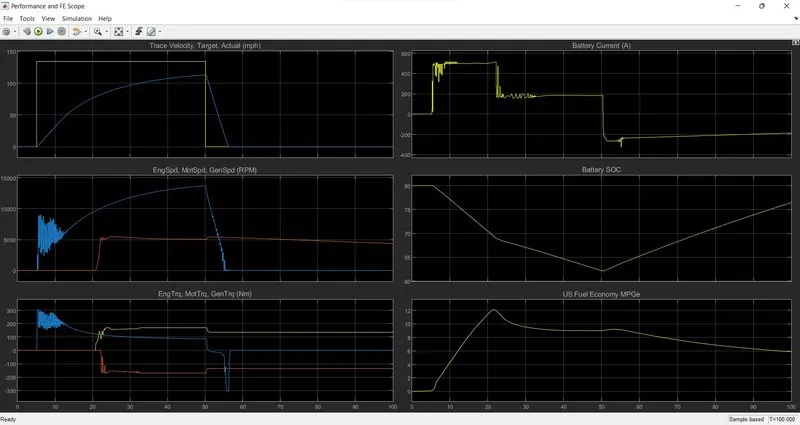
- The above figure shows the results for the simulation and there are totally six plots in them.
- Each plot shows a particular result and the plots are made in such a way that ,there is a cursor measurement and if we change the cursor on one plot the cursor moves on the otherplots too which paves way to study the result in a better way.
- The cursor enables us to study the behaviour of other result parameters corresponding to the acceleration of the vehicle.
~PLOT 1:
Shows the velocity of the vehicle with respect to the Drive cycle data with the Time scale on the x axis.
The acceleration time to reach 80 mph - 16.7 seconds
The deceleration time from 80 to minimum = 6.2 seconds
PLOT 2:
Shows the changes in speed of the Engine,motor and Generator in Rpm throughout the drive cycle.
Peak Engine speed = 4780 Rpm
Peak Motor speed = 9497 Rpm
Peak Generator speed = 13690 Rpm
PLOT 3:
Shows the Torque characteristics and its changes of engine,motor and generator in (Nm) throughout the drive cycle.
Peak Engine torque = 138.7 Nm
Peak Motor torque = 206.7 Nm
Peak Generator torque = 42.2 Nm
PLOT 4:
Shows the Battery Current values (A) and its changes for various acceleration inputs as per the Drive cycle.
The peak current discharge from the battery = 163.5A
The peak current charging to the battery = -150.86 A
PLOT 5:
Shows the Battery state of charge SOC (%) and its changes corresponding to the driving inputs.
The state of charge decreased from 60% to 39.8% of charge in a time period of 49.3 seconds , for the specified driving conditions.
PLOT 6:
Shows the Fuel Economy as Mile per Gallons for the corresponding input driving conditions.
The maximum miles that the car can run per gallon of fuel equivalent = 46 Miles,for the given vehicle at the specified driving conditions.
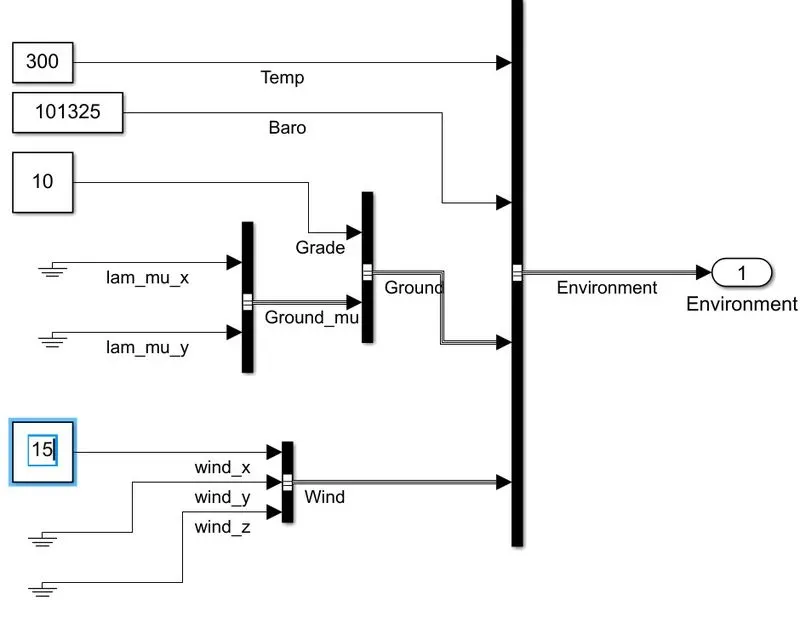
~Now Changing the Grade and Wind ie,Grade -10 , wind velocity 15m/s
~Now Changing the Wide Open Throttle Variable and keeping rest all other thing same
~~OutPut
Grade - 10, wind velocity 15m/s
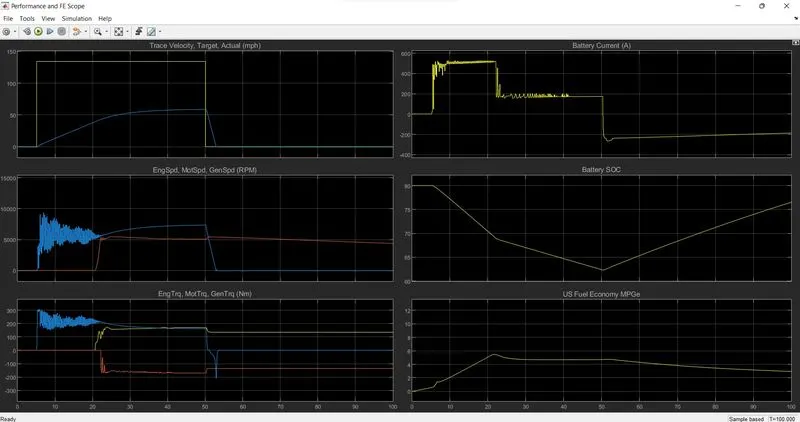
- In all the results we can observe some changes from the previous case
- Though the vehicle parameters and the drive cycle are the same ,here we have considered some changes in the environment blocks by adding some hill climb angles and wind velocity.
- The changes in the results are given below.
PLOT 1:
Shows the velocity of the vehicle with respect to the Drive cycle data with the Time scale on the x axis.
The top speed of 70 mph cannot be achieved as we have some additional forces acting and so the car can only run upto 67.2 mph
The acceleration time to reach top speed of 67.2 mph = 44.5 seconds
The deceleration time from 80 to minimum = 5.06 seconds
PLOT 2:
Shows the changes in speed of the Engine,motor and Generator in Rpm throughout the drive cycle.
Peak Engine speed = 4676 Rpm
Peak Motor speed = 8103.5 Rpm
Peak Generator speed = 12858.5 Rpm
PLOT 3:
Shows the Torque characteristics and its changes of engine,motor and generator in (Nm) throughout the drive cycle.
Peak Engine torque = 139.6 Nm ; Peak Motor torque = 206.4 Nm
Peak Generator torque = 48.2 Nm
PLOT 4:
Shows the Battery Current values (A) and its changes for various acceleration inputs as per the Drive cycle.
The peak current discharge from the battery = 167.6A
The peak current charging to the battery = -152.46 A
PLOT 5:
Shows the Battery state of charge SOC (%) and its changes corresponding to the driving inputs.
The state of charge decreased from 60% to 25.98 % of charge in a time period of 49.3 seconds , for the specified driving conditions.
PLOT 6:
Shows the Fuel Economy as Mile per Gallons for the corresponding input driving conditions.
The maximum miles that the car can run per gallon of fuel equivalent = 17.93 Miles,for the given vehicle at the specified driving conditions.
Observation:
- The simulation results for both the cases is found and we can see that the simulation 1 without the inclusion of hill climbing conditions and the wind drag velocity is much more efficient when compared to the simulation which includes the hill climbing conditions and the wind drag velocity.
- The vehicle was not able to achieve the required top speed though using the highest possible current discharge of that same battery used before.
- The state of charge also shows that the discharge is also high compared to the simulation 1
- The Fuel Economy is also down to half of the previous simulation.
- So one can say, it is evident that the efficiency of no load vehicle is high compared to the vehicle with additional loads acting on them and also we have visualized this using the Powertrain blockset.
4.Keeping all other parameters same, compare the simulated results of hybrid and pure electric powertrains.
Answer:--
Hybrid elctric powertrain :--
The hybrid electric vehicle reference application represents a full multimode hybrid electric vehicle (HEV) model with an internal combustion engine, transmission, battery, motor, generator, and associated powertrain control algorithms. Use the reference application for powertrain matching analysis and component selection, control and diagnostic algorithm design, and hardware-in-the-loop (HIL) testing. To create and open a working copy of the hybrid electric vehicle reference application project.
Hybrid electric powertrain Model:--
~Now keeping the Grade and Wind Same
~Now Changing the Wide Open Throttle Variable and keeping rest all other thing same
~OutPut :--
Grade - 0, wind velocity 0m/s
- The above figure shows the results for the simulation and there are totally six plots in them.
- Each plot shows a particular result and the plots are made in such a way that ,there is a cursor measurement and if we change the cursor on one plot the cursor moves on the otherplots too which paves way to study the result in a better way.
- The cursor enables us to study the behaviour of other result parameters corresponding to the acceleration of the vehicle.
~PLOT 1:
Shows the velocity of the vehicle with respect to the Drive cycle data with the Time scale on the x axis.
The acceleration time to reach 80 mph - 16.7 seconds
The deceleration time from 80 to minimum = 6.2 seconds
PLOT 2:
Shows the changes in speed of the Engine,motor and Generator in Rpm throughout the drive cycle.
Peak Engine speed = 4780 Rpm
Peak Motor speed = 9497 Rpm
Peak Generator speed = 13690 Rpm
PLOT 3:
Shows the Torque characteristics and its changes of engine,motor and generator in (Nm) throughout the drive cycle.
Peak Engine torque = 138.7 Nm
Peak Motor torque = 206.7 Nm
Peak Generator torque = 42.2 Nm
PLOT 4:
Shows the Battery Current values (A) and its changes for various acceleration inputs as per the Drive cycle.
The peak current discharge from the battery = 163.5A
The peak current charging to the battery = -150.86 A
PLOT 5:
Shows the Battery state of charge SOC (%) and its changes corresponding to the driving inputs.
The state of charge decreased from 60% to 39.8% of charge in a time period of 49.3 seconds , for the specified driving conditions.
PLOT 6:
Shows the Fuel Economy as Mile per Gallons for the corresponding input driving conditions.
The maximum miles that the car can run per gallon of fuel equivalent = 46 Miles,for the given vehicle at the specified driving conditions.
Pure Electric Power Train:--
The electric vehicle reference application represents a full electric vehicle model with a motor-generator, battery, direct-drive transmission, and associated powertrain control algorithms. Use the electric vehicle reference application for powertrain matching analysis and component selection, control and diagnostic algorithm design, and hardware-in-the-loop (HIL) testing. To create and open a working copy of the conventional vehicle reference application project.
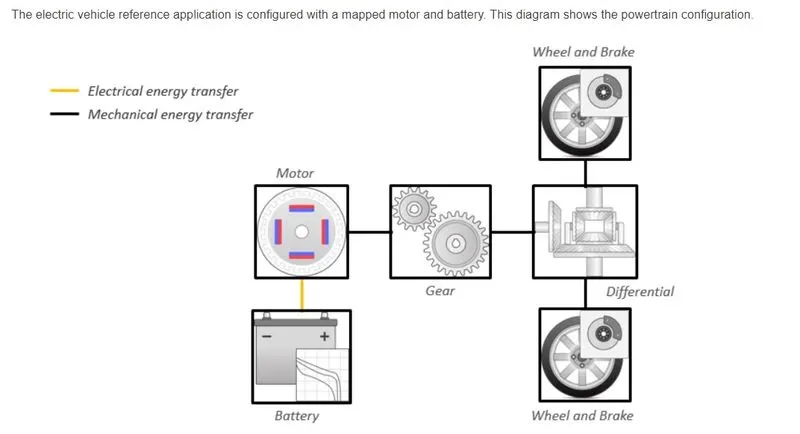
Pure Electric powertrain Model:--
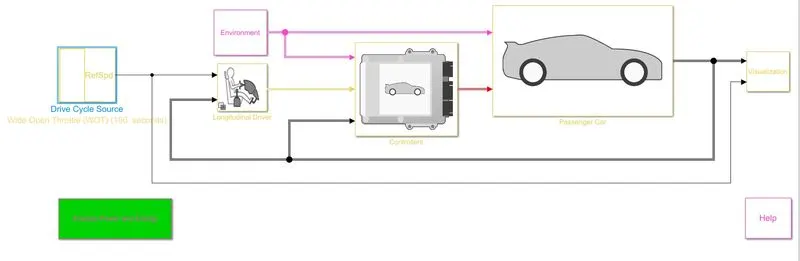
~Now keeping the Grade and Wind Same
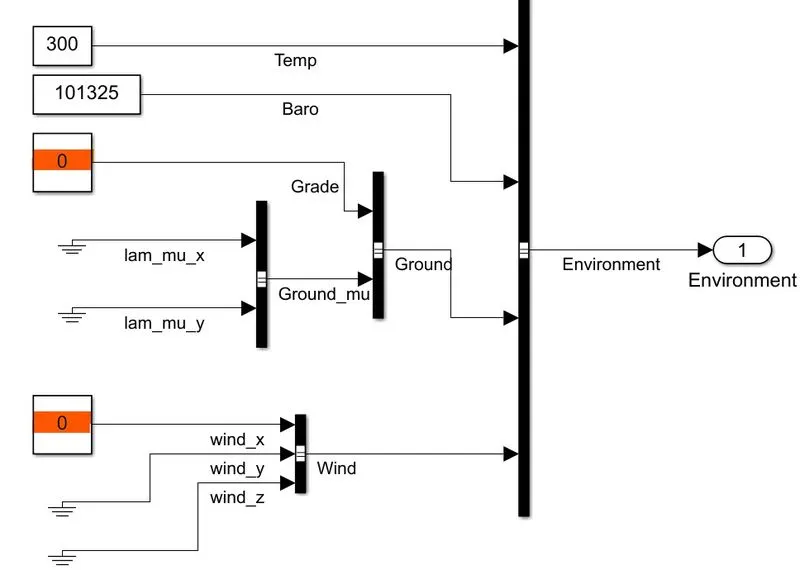
~Now Changing the Wide Open Throttle Variable and keeping rest all other thing same
~OutPut :--
Grade - 0, wind velocity 0m/s
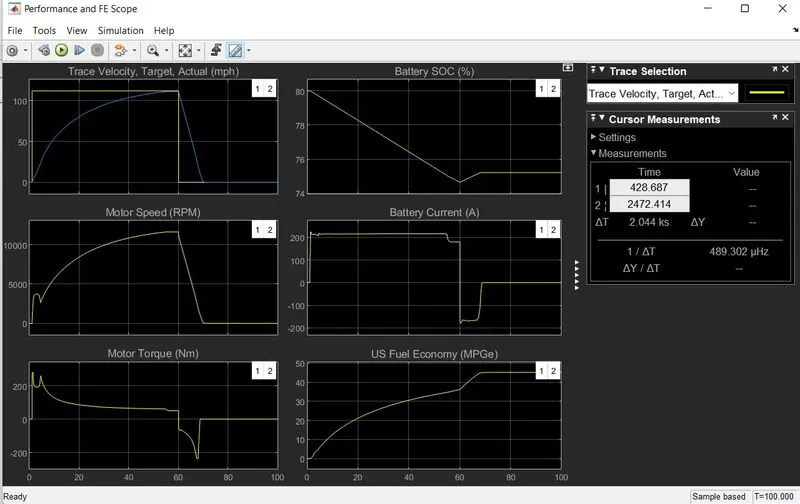
Observation(Pure Electric VS Hybrid Vehicle With Same Load Conditions):--
- By keeping all the parameters same and have Checked the Pure EV and HEV Powertrains
- Time taken to achieve the required peak velocity is less for HEV as compared to EV
- Deceleration time is also low for HEV as it has many moving frictional parts
- fuel economy is more for an EV compared to HEV due to less no of moving parts and thus low frictional losses