Week-4 Challenge WOT Condition Part-2
Objective: -
- What is the difference between mapped and dynamic model of engine, motor and generator? How can you change model type?
- How does the model calculate miles per gallon? Which factors are considered to model fuel flow?
- Run the HEV ReferenceApplication with WOT drive cycle. Change the grade and wind velocity in the environment block. Comment on the results.
- Keeping all other parameters same, compare the simulated results of hybrid and pure electric powertrains.
Solution 1. Difference between mapped and dynamic model of Engine, Motor and Generator:
| Sl No. | Mapped Engine | Dynamic Engine |
| 1 | Uses Steady-state look-up tables(brake torque, fuel flow, air mass flow, exhaust temperature, efficiency, and emissions) to characterize the engine performance | The engine behavior is broken down into engine characteristics seperated by lower level components. By combining these subsystems, the dynamic effect is captured. |
| 2 | Engine data from Dynamometer or GT-power is required. | Component level data is required. |
| 3 | For quasi-steady state simulation | To analyze the impact of engine components on overall performance |
Powertrain Blockset provides two types of engine models: mapped and dynamic. Mapped engines represent macro engine behavior as a set of lookup tables (brake torque, fuel flow, air mass flow, exhaust temperature, efficiency, and emissions) as functions of commanded load and measured engine speed. Dynamic engines decompose engine behavior into individual component models that account for engine dynamics, most notably intake airflow and turbocharger dynamics.
You can switch between engine model types based on your application. Dynamic engine models are suitable for designing control, estimator, and diagnostic algorithms that depend on dynamic subsystem states r subcomponenents, for example, in closed-loop AFR control algorithm development. Mapped engine models are suitable for analysis and design activities that do not require engine subsystem dynamic characteristics, for example, in engine and transmission powertrain matching analysis for fuel economy, emissions, and performance tradeoffs.
| Sl No. | Mapped Motor | Dynamic Motor |
| 1 | It is based on the tabulated Torque-Speed envelope | It is based on the detailed design parameters of the motor |
| 2 | The block assumes that the speed fluctuations due to mechanical load do not affect the motor torque tracking | Transient effects are taken into account |
| 3 | The output torque tracks the torque reference demand and includes a motor-response and drive-response time constant | The block uses the three-phase input voltages to regulate the individual phase currents, allowing control of the motor torque or speed |
Briefly:
Mapped Model: -
- It uses a prebuilt data in lookup table for the simulation of powertrain block set.
- In mapped model the calculations are very fast.
- Electric losses are need to be specified if present.
Dynamic Model: -
- It uses real time data for calculating every behavior of vehicle characteristic like speed, velocity, drag, wheel braking etc.
- In dynamic model the calculations are time consuming.
To change the mode type:
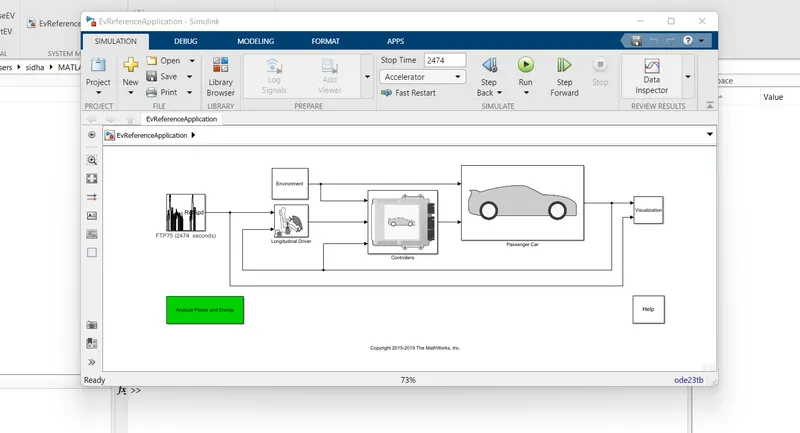
Open ‘EV Reference Application’ in powertrain blockset of MATLAB as shown in figure below.it is a Simulink model which consist of Drive cycle, Environment conditions, Longitudinal Driver controllers and Passenger Car.
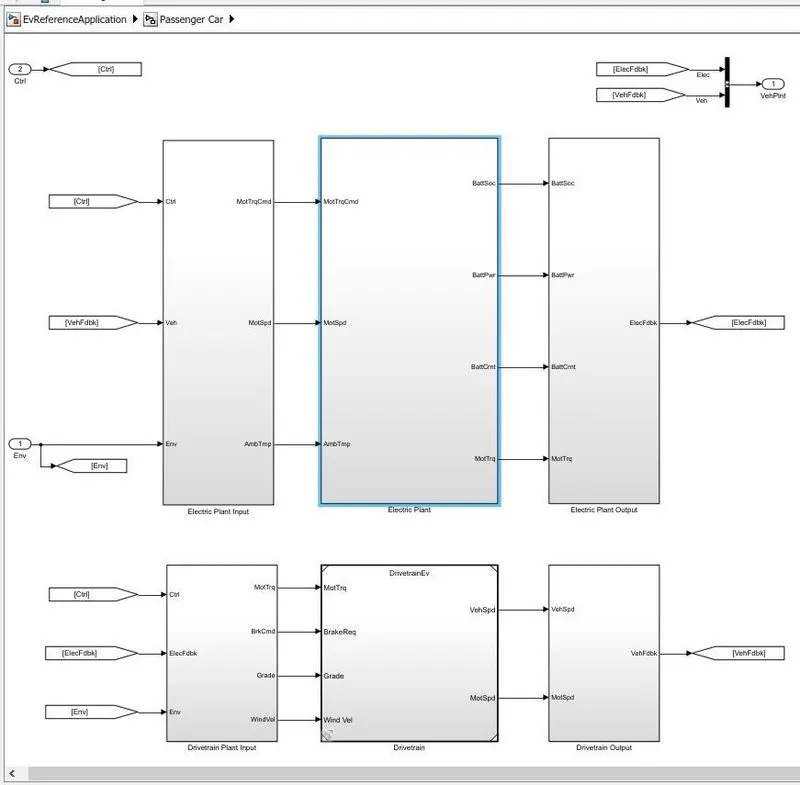
Now open the passenger car Block and select the Electric plant block as shown in the figure below.
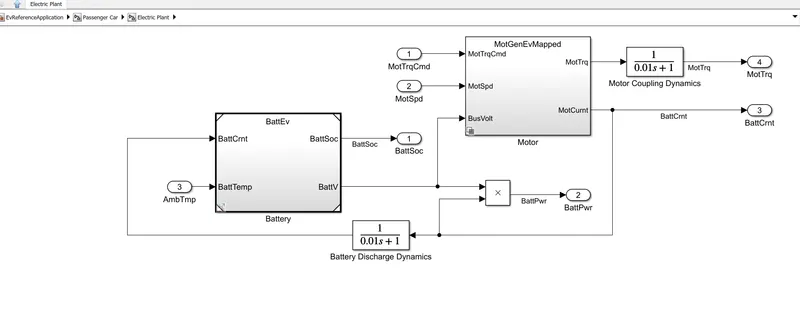
Then select the ‘MotGenEVMapped’ block as shown below.
From the below figure it is clear that by default mapped motor is selected.
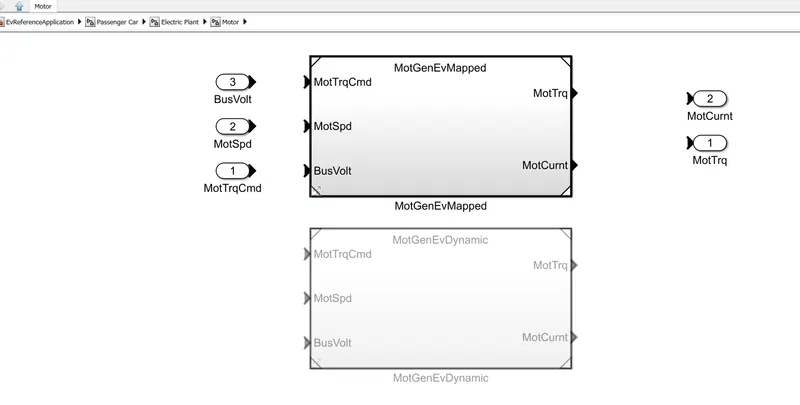
Changing mapped to dynamic blockset by right clicking on the screen and select variant. Select Label Mode Active Choice and select MotGenEvDynamic.
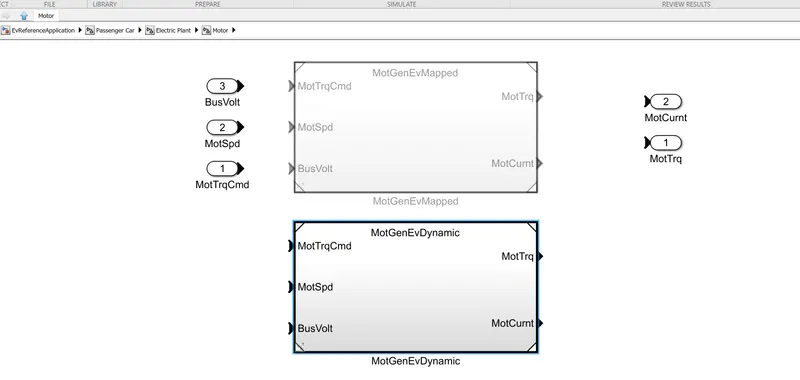
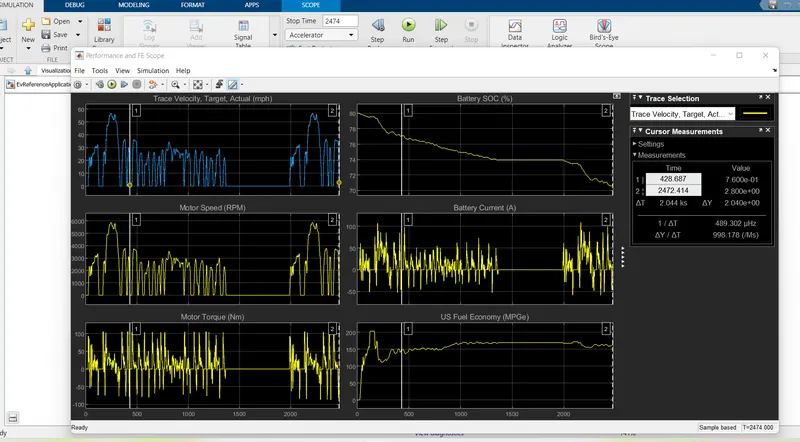
This automatically disables the previosly active variant and vice-versa. By clicking on Run the results are obtained when FTP75 drive cycle is used with a simulation time of 2474 sec. The result graph is obtained in visualisation block as below;
Solution 2. Calculation of Miles per Gallon and factors in fuel flow model:
A gallon is a unit of measurement for liquids. In America, it is equal to about 3.785 litres. MPG, or miles per gallon, is the distance, measured in miles, that a car can travel per gallon of fuel. MPG is also the primary measurement of a car's fuel efficiency: The higher a car's MPG, the more fuel efficient it is.
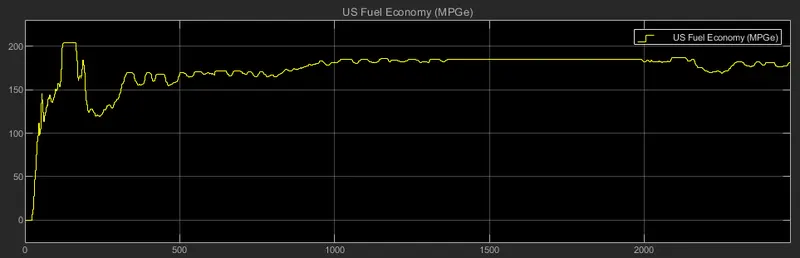
US-MPGe curve of Full electric vehicle
In above fig. We can see the 'US-MPGe curve' of 'Full electric vehicle'. Let's see how it's generated.
It uses 'Vehicle speed' and 'Battery power' to generate curve.
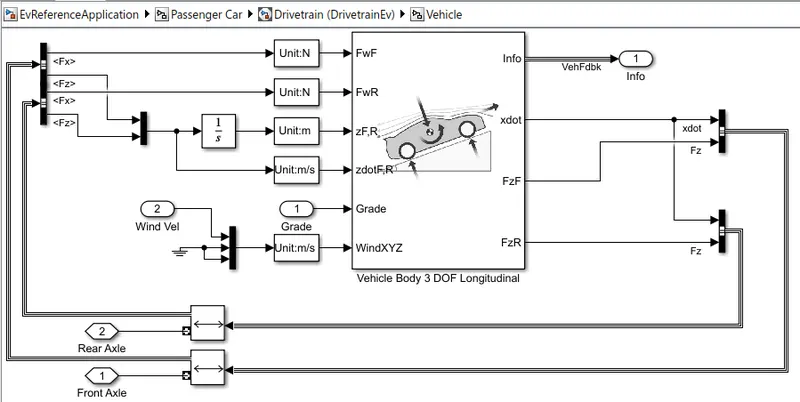
Vehicle Body 3 DOF Longitudinal block
As per above path > "EvReferenceApplication/Passenger Car/Drivetrain (DrivetrainEv)/Vehicle" from 'Vehicle Body 3 DOF Longitudinal block' vehicle velocity(m/s) derived.
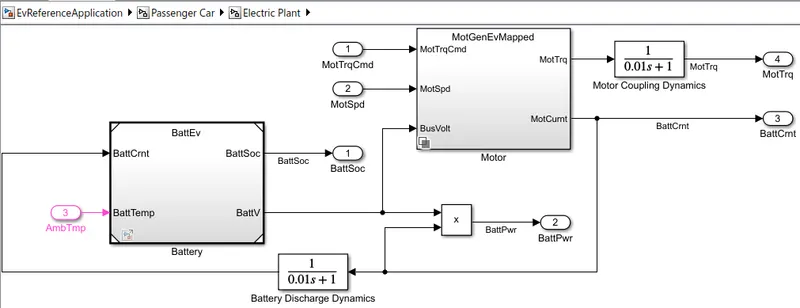
Battery Power (watts) calculation
And As per above path > "EvReferenceApplication/Passenger Car/Electric Plant" Battery Power (watts) calculated by multiplying 'Battery volte' and 'Battery current'.
Now Using 'Bus selector' all values that are going to visualize in the graph, such as 'vehicle velocity(xdot)', 'Motor speed(MotSpd)','Battery current(BattCrnt)' etc are extracted.
In the image below we can see how the 'Miles per gallon' or MPG calculated 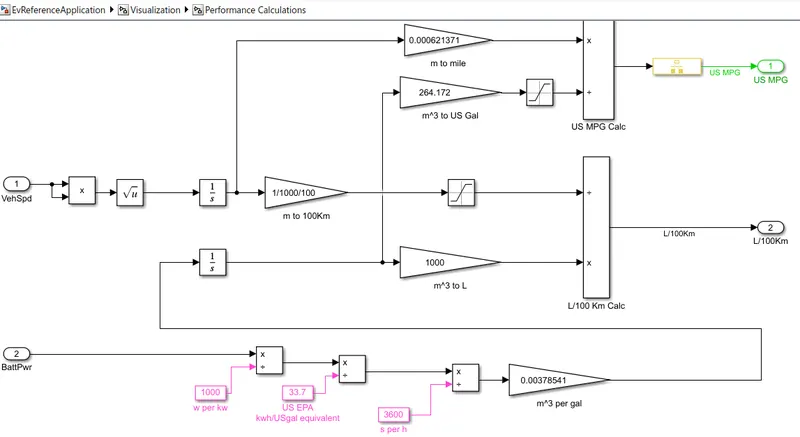
Miles per gallon calculation
First, Speed unit converted meter to miles.
Second Battery power, converted to 'kw' then 'kwh/US EPA equivalent' then 'per sec' and then 'm3 per gal'.
And then, using the 'product block' 'Miles per gallon' calculated.
Factors considered in model fuel flow :-
1)Battery power Capacity should be high and vehicle power consumption should be low for higher MPGe (Miles Per Gallon equivalent).
2)vehicle speed
Solution 3. HEV ReferenceApplication with WOT drive cycle:
Theory:
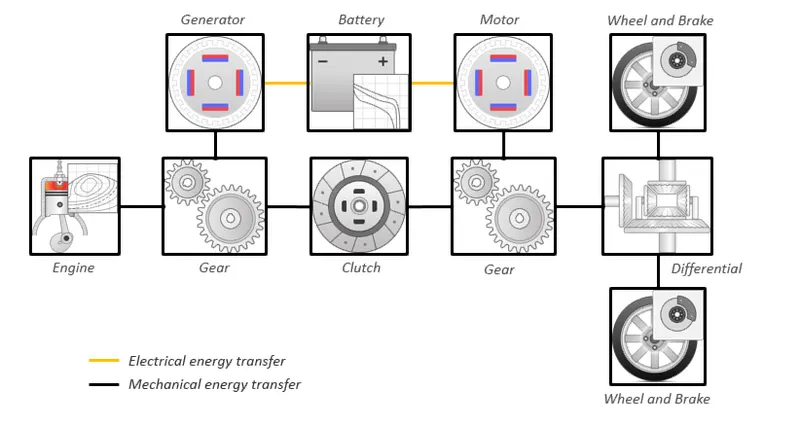
The above image shows the Hybrid Electric Vehicle configuration. It has three prime movers: Engine, motor and generator. It has two power source: A fuel tank and battery. The engine power can be seen transmitted to a generator which in turn charged battery and engine power is also transmitted to the wheels directly through an intermediary transmission line: gears, clutch and differential. The motor is taking battery stored electricity as input and transmits power to the wheels through intermediatory gears.
Go to Powertrain blockset documentation>Get started>Hybrid and Electric Vehicle Reference Application Projects>Explore the Hybrid Electric Vehicle Multimode Reference Package
To open the working copy of the application, click over 'autoblkHevStart'
This opens the Simulink model of the HEV multimode model as follows:
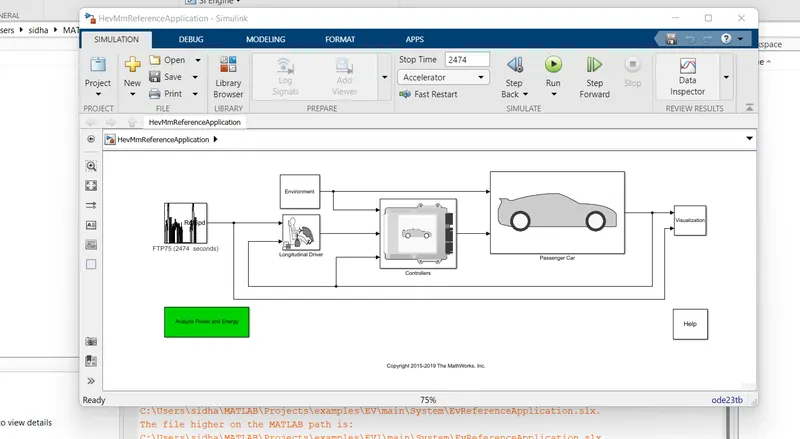
RefSpd block refers to the reference speed block, that is the drive cycle data. Click over the block and select the required drive cycle.
The default drive cycle is FTP75 with 2474 sec. Now change it to WOT drive cycle as below;
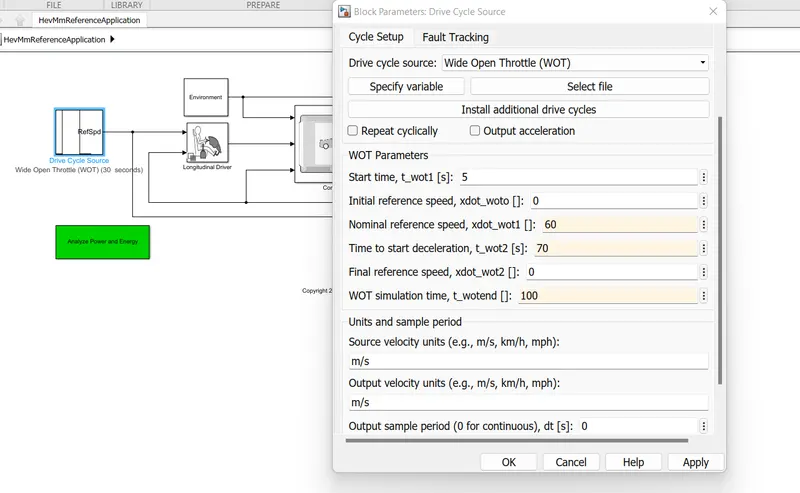
- The start time is set to 5 seconds. This is the time after which vehicle starts moving.
- The initial reference speed is set to 0 m/s. It signifies that wide open throttle is applied when the vehicle is initially at rest.
- Nominal reference speed is set to 60 m/s or 135 mph. This represents the top speed of the vehicle, which the vehicle is intended to achieve.
- Time to start deceleration is set to 70 seconds. This is the time up to which the Wide Open Throttle condition is in place. After the lapse of this time, the vehicle starts decelerating rapidly.
- Final reference speed is set to 0 m/s. This represents the speed that vehicle should achieve after rapid deceleration.
- Simulation time is set to 100 seconds.
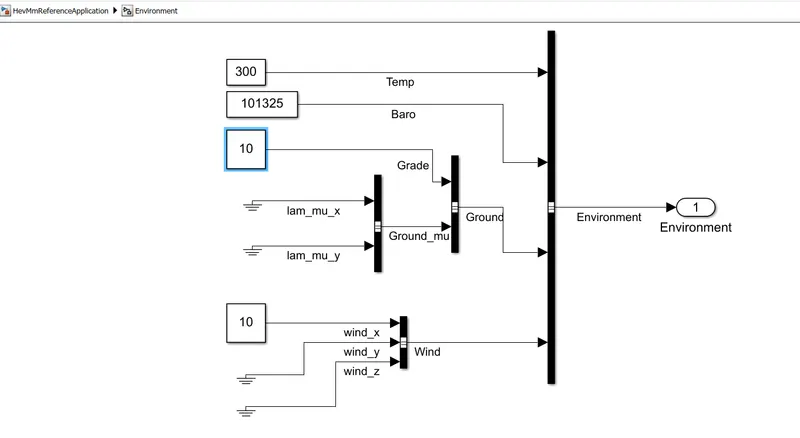
- Now select the Environment blockset. Click over the grade constant block and enter value 10. This is the degree of slope of the gradient. Then click over the wind_x constant block and set the speed to 10. It is the speed of the wind blowing against the vehicle. The set values can be seen below.
Now go back to the main model & change stop time to 100 sec & run the simulation. After the completion, click over the Visualization block and then over performance and FE scope to get the output plots.
BATTERY SOC
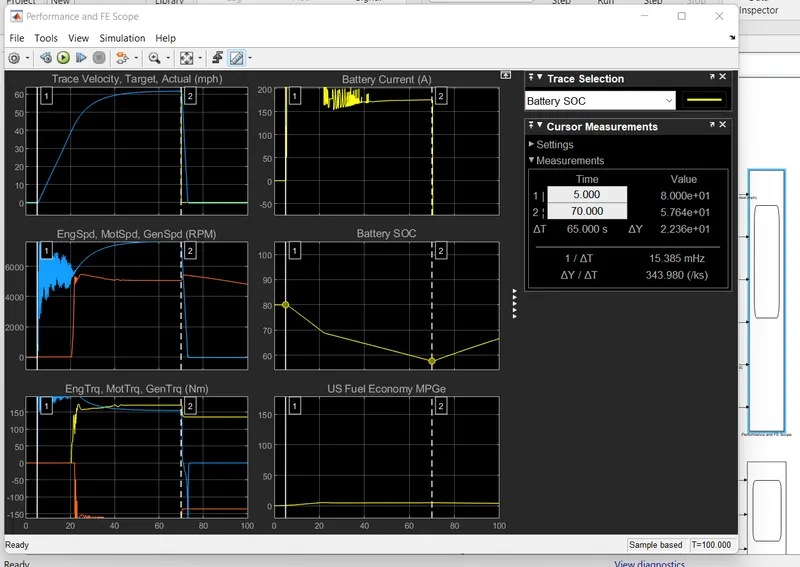
From the above plot, it can be observed that the HEV powertrain is not able to meet the demanded speed on the grade and against the wind due to the battery power output constraint. Point 1 represents the time(5 sec) when the vehicle is about to start moving and point 2(70 sec) when the vehicle is about to start decelerating. The actual top speed achieved by the vehicle is 61.7 mph in the time span of 65 seconds.
Trace selection is done using the measurement option in the toolbar.
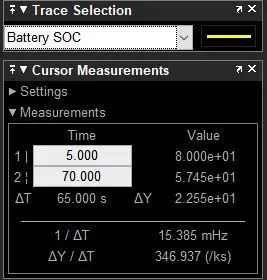
During the WOT, the battery SOC reduces from 80% to 57%.
Deceleration phase
TRACE VELOCITY
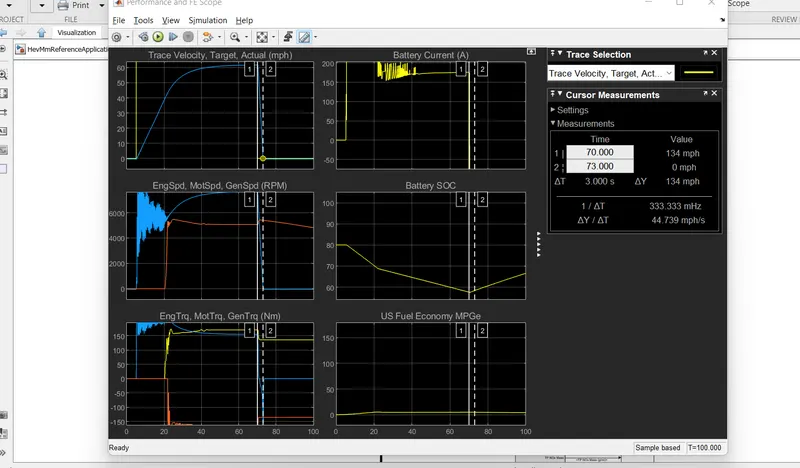
Point 1 is the start of deceleration from top speed and 2 is the end of deceleration at which the vehicle is stationary. From the right panel, it can be seen that, the vehicle takes 3 seconds to stop with the deceleration rate of 20.315 mph/s or 9 m/s^2. In the speed plot, the motor speed (blue line) drops from 7500 rpm to 0 rpm, indicating that the wheel torque was provided by the motor. The electricity generated by the motor is feb back to the battery. In the torque block, it can be observed that the motor torque is negative.
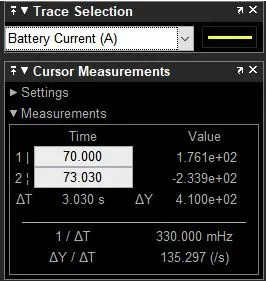
BATTERY CURRENT
In the battery current plot, the constant current drops from 200 A to -200 A during the deceleration phase. This indicates that the direction of current flow is reveresed. The wheel torque is utilized to run the motor as generator in the regeneration mode.
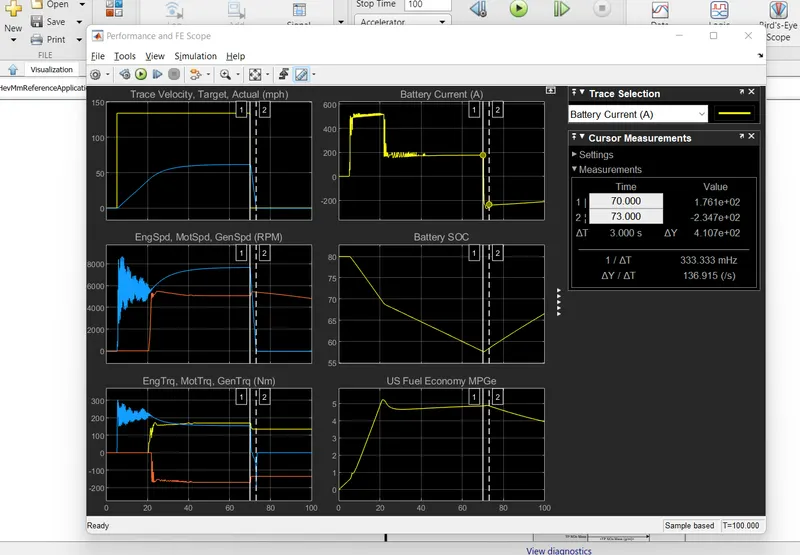
First phase of acceleration
Motor Speed & Battery SOC
In the first phase of acceleration, shown by points 1 and 2, it can be seen in the Battery SOC plot, the SOC drops from 80% to 68.8% rapidly with steeper slope. During this phase, in the motor speed plot, it can be seen that only motor is active, obtaining energy from Peak Power Source: Battery. In the torque plot, the motor can be seen working in constant torque region at 200 N-m. This motor torque is limited by the peak current output of the battery. The peak current is set at 500 A.
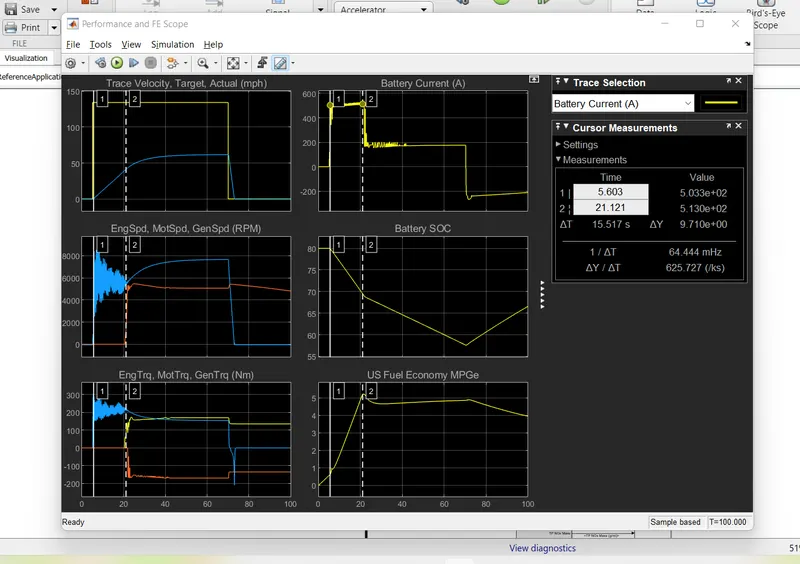
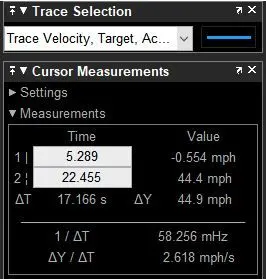
The acceleration in this phase can be measured using trace selection. Delta Y represents the change in velocity in this rapid acceleration phase. The vehicle reaches a speed of 44 mph or 70 kmph in the span of delta T=17 seconds. Accelertion is given by the slope of the line: delta Y/ delta T = 2.618 mph/s or 1.16 m/s^2.
Slow Acceleration Phase
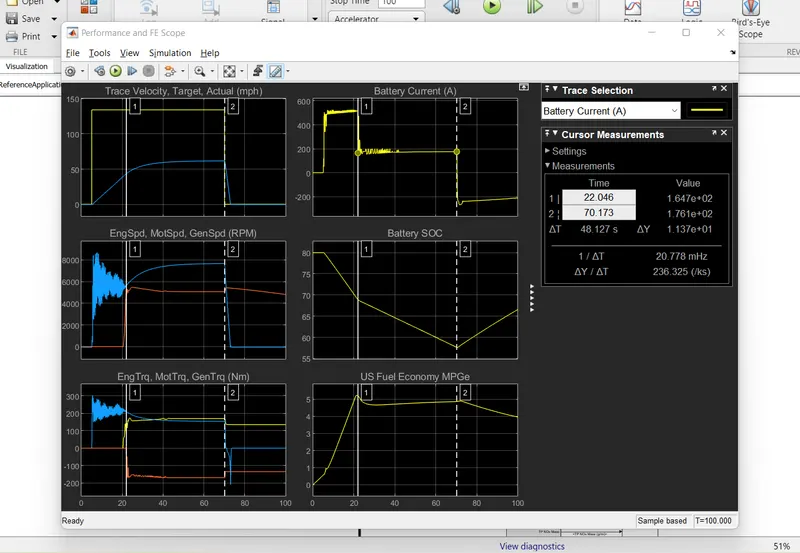
The points 1 and 2 represents the slow acceleration phase during which, the motor works in constant power region as the torque falls and speed of the motor increases. In the torque plot, engine torque can be seen reflecting the generator torque. It signifies that the whole engine power is transmitted to run the generator, which then recharges the battery. During this phase, the motor is absorbing the battery energy while the engine is charging the battery through generator. Since the power required by the vehicle is more than power generated by the engine, battery SOC keeps dropping but with lower slope.
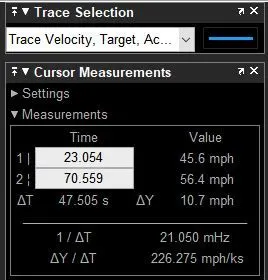
The magnitude of the slower acceleration phase is measured by this trace selection. The slope measured is 0.226 mph/s or 0.1 m/s.
Deccelerates to Rest - Increase Battery SOC
Here the trace selection points 1 and 2 represents the increment of battery SOC from 57% to 66% in the duration of 29 seconds. During this time, the vehicle decelerates and comes to rest. So the motor speed and torque reduce to 0. However, the engine keeps running and transmits the power to generator, which feeds the electricity back to battery and recharges it. As the vehicle consumes no energy, the battery SOC stops discharging. During this period, the current is negative, indicating that the battery is being charged.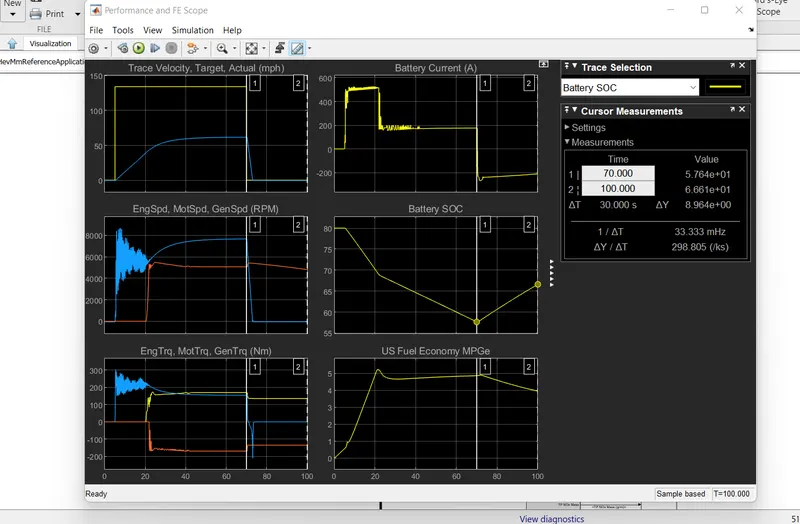
Solution 4. Electric Vehicle Reference Application under WOT condition and comparison with HEV results:
Theory:
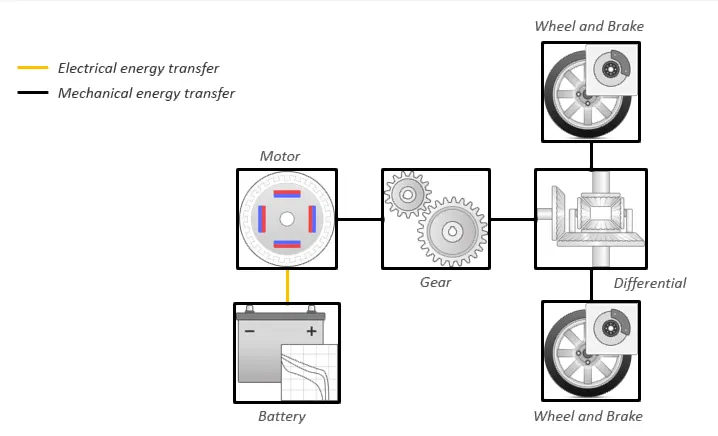
The Electric Vehicle configuration is displayed above. It has battery as power source and an electric motor as the prime mover. The motor takes charge from battery as input and generates rotational kinetic energy, which is transmitted to wheels through intermediatory gears.
Go to powertrain blockset documentation>Get Started>Hybrid and Electric Vehicle Reference Application Projects>Explore the Electric Vehicle Reference Application and then click over 'autoblkEvStart'
Select Refspd block in the Simulink and select WOT drive cycle with the same speed and time conditions as in HEV appliaction.
Go to environment block and set the grade and wind velocity to same values as earlier.
Set the simulation time to 100 s and after the completion, go to 'Visualization' block and click over 'Performance and FE scope' to get the result plots.
- Result:
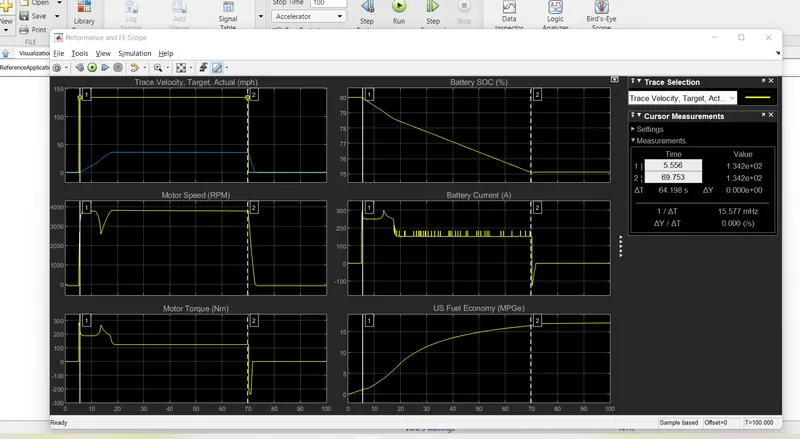
The trace selections represent the Wide Open Throttle condition. The EV power train is able to achieve a top speed of 51.7 mph against wind velocity of 10 m/s and grade of 10 degrees. This is due to the peak current output constraint of about 200 A from the battery. From the battery SOC plot, the battery is seen discharged to 74% with initial charge of 80%.
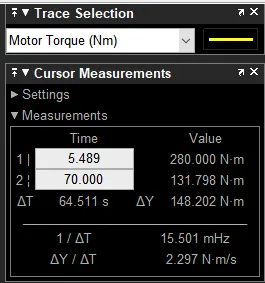
It is shown that the motor provides instantaneous torque of up to 280 N-m which is the maximum torque of in constant torque region of motor operation. As the motor speed increases to attain the top speed, the motor operation transits to constant power region where the torque output drops to 131 N-m.
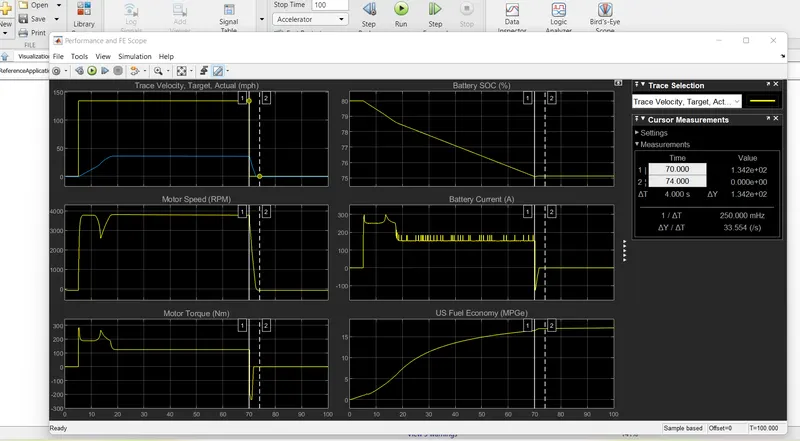
The trace selections show the deceleration phase. The time taken to bring the vehicle from top speed of 51.7 mph to rest is 4 seconds. The vehicle decelerates at the rate of 13 mph/s or 5.77 m/s. The current flows in opposite direction with a peak magnitude of -170 A. This current is bed back to the battery by the motor which works as a generator by absorbing the kinetic energy of the wheels.
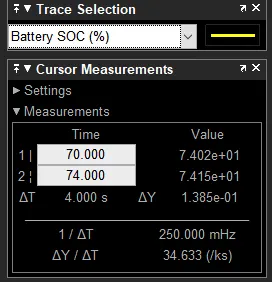
Here, it is evident that the battery is charged during deceleration. The battery SOC increases from 74.02% to 74.15%. It can be inferred that the charge is insignificant. This is due to the fact that vehicle is brought to rest naturally by the environmental condition. The gradient force and aerodynamic drag stops the vehicle and hence the motor does not receive good amount of wheel torque.
Comparing the WOT of HEV and pure EV:
- As HEV consists of engine and motor, utilizing the combined power of both the prime movers with fuel tank and battery as power source, HEV accelerated to top speed of 61.7 mph. Whereas, EV with only one power source: battery and one prime mover: motor, could generate sufficient power to accelerate to 51.7 mph.
- At the end of deceleration, when the vehicle stopped, the HEV had consumed miles per gallon equivalent of 6. Whereas pure EV consumed battery energy of 19.2 MPGe.
- In the HEV case, it can be seen that before the engine is activated, the peak current drained from the battery is around 500 A. Immediately after engine activation, the current drained from the battery drops to approximately 200 A. This shows that the torque demanded by the vehicle is partially fulfilled by the engine. Hence peak current output varies in HEV, while it remains the same in pure EV case.
- In the HEV case, the battery SOC falls 23% during WOT and in the Pure EV case, the battery SOC falls 6%. This implies that HEV has a smaller battery size and Pure EV has bigger battery. This is due to the fact that HEV has an alternative power source and battery dimensions are limited.