Week-4 Challenge WOT Condition Part-2
OBJECTIVES
- What is the difference between mapped and dynamic model of engine, motor and generator? How can you change model type?
- How does the model calculate miles per gallon? Which factors are considered to model fuel flow?
- Run the HEV Reference Application with WOT drive cycle. Change the grade and wind velocity in the environment block. Comment on the results.
- Keeping all other parameters same, compare the simulated results of hybrid and pure electric powertrains.
AIM
- What is the difference between mapped and dynamic model of engine, motor and generator? How can you change model type?
Mapped Engine: Mapped Engine is the default settings in powertrain block set. It is used to measure to measure performance parameters of the vehicle by using standard lookup tables which are prefered to the system. This type of modelling is less accurate. The lookup tables value are based on the values of brake torque, commanded torque and engine speed. If any other parameter like Input engine temperature is selected then lookup table values are also a function of the temperature parameter. The data extracted from lookup tables are: air mass flow, fuel flow, emission data, exhaust temperature and efficiency. This data is used to find out other parameters which are needed by the end user.
Dynamic Engine: This type of model uses real time data fed by the user at run time for modelling. This model is more accurate than mapped engine model. This type of model is used when the data of subsystems of a vehicle is required.
We can calculate: Brake torque, fuel flow, port gas mass flow, exhaust temperature, exhaust mass flow rate and exhaust emissions.
Mapped Motor: The mapped motor works in torque control mode. This type of motor is used when the user requires a faster simulation and doesn't have the knowledge of motor parameters. The output torque and reference torque is compared and changes are made. Input torque or speed can be specified, electrical losses and maximum motor power and torque can be defined.
Dynamic Motor: In the dynamic motor a three-phase interior permanent magnet synchronous motor (PMSM) is used. The block uses three phase input voltages to regulate the individual phase currents, allowing control of the motor torque or speed. This block is used when the user knows what parameters are to be used in that particular simulation. This motor is more accurate.
Mapped Generator: The mapped generator block is also similar like other blocks. Most of the data required is taken from the lookup tables corresponding to the given input parameters. Its simulation time is less.
Dynamic Generator: The dynamic generator involves user entering the parameters manually during the run time for their particular applications. The results take time and are more accurate.
IMULATION MODEL OF HEV:
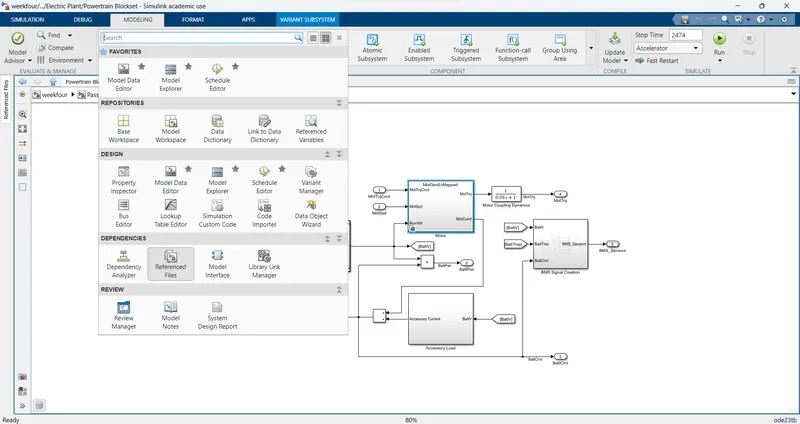
To change the model from mapped to dynamic:
Go to Modelling then Variant Manager.
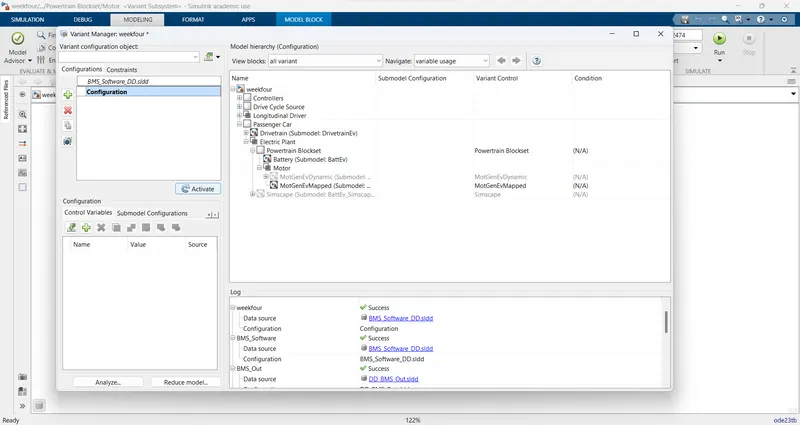
Suppose we plan to change the generator block from mapped to dynamic. Select GenDynamic then right click, then select 'Set as Label Model Active Choice'. Then double click 'GenDynamic'.
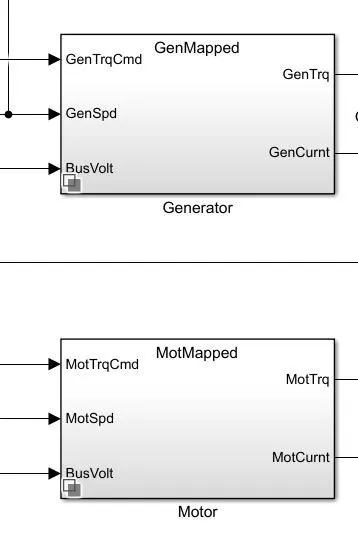
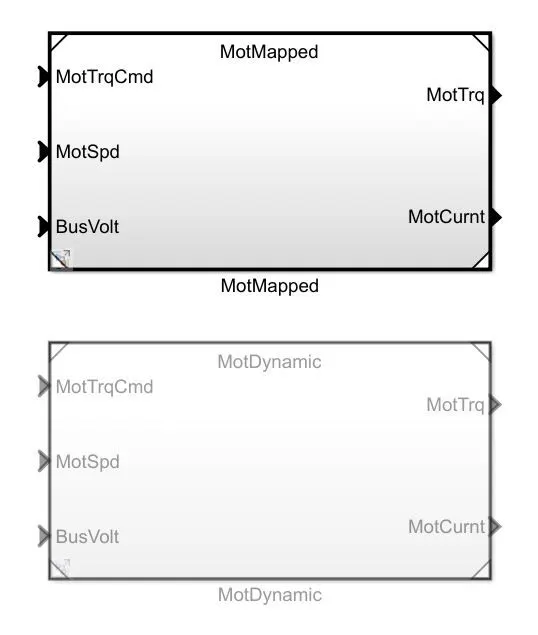
Difference in Mapped and Dynamic Motor: As shown above are the mapped and dynamic motors in the hybrid electric vehicle model of Simulink. The mapped motor uses the torque control mode, whereas in the dynamic motor uses the three phase permanent magnet synchronous motor. The mapped motor is used when the user requires the faster simulation and when the user do not have in-depth knowledge about the motor, whereas the dynamic motor is used when the user has the real time data of the motor to simulate or knows which parameters are to be used in a particular simulation. The dynamic motor is precise and more accurate compared to the mapped model.
Difference in Mapped and Dynamic Motor: As shown above are the mapped and dynamic motors in the hybrid electric vehicle model of Simulink. The mapped motor uses the torque control mode, whereas in the dynamic motor uses the three phase permanent magnet synchronous motor. The mapped motor is used when the user requires the faster simulation and when the user do not have in-depth knowledge about the motor, whereas the dynamic motor is used when the user has the real time data of the motor to simulate or knows which parameters are to be used in a particular simulation. The dynamic motor is precise and more accurate compared to the mapped model.
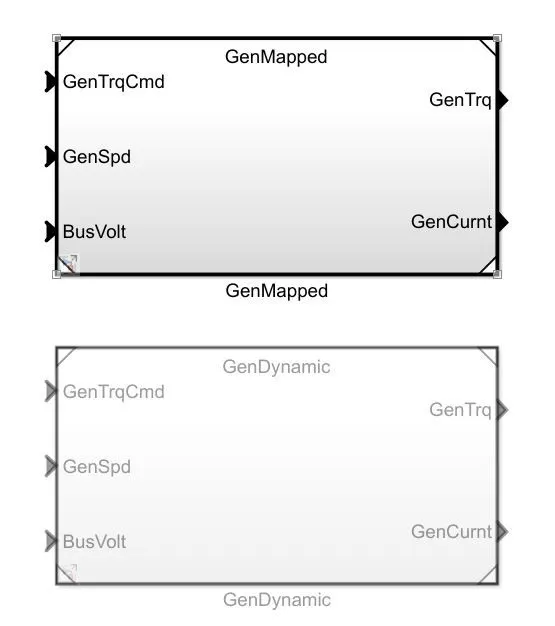
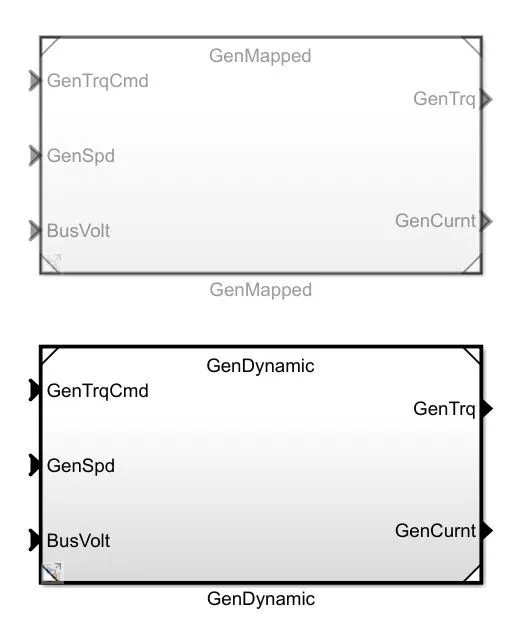
Difference between Mapped and Dynamic Generator: Shown above is the generator of the hybrid electric vehicle model. The block is similar to the motor, the mapped model uses the required data from the lookup tables corresponding to the given input parameters, whereas the dynamic model uses the manual input parameters to simulate the real time data given by the user. The simulation time used by mapped motor is less whereas the simulation time used by the dynamic model is more and the results from the dynamic model used for simulation are more accurate compared to the mapped model.

Difference in Mapped and Dynamic Engine: Shown above are the mapped and dynamic SI engines from the HEV model. Mapped model is the default selection in the HEV model for the simulation as it takes lesser time to simulation. The mapped model is the less accurate model which takes lesser time for simulation, whereas the dynamic model is more accurate based on the user inputs and takes more time to simulate, this type of model is used when subsystem data of a vehicle is required. There are also CI mapped and dynamic models available to simulate.
Steps to change the model from mapped to dynamic:
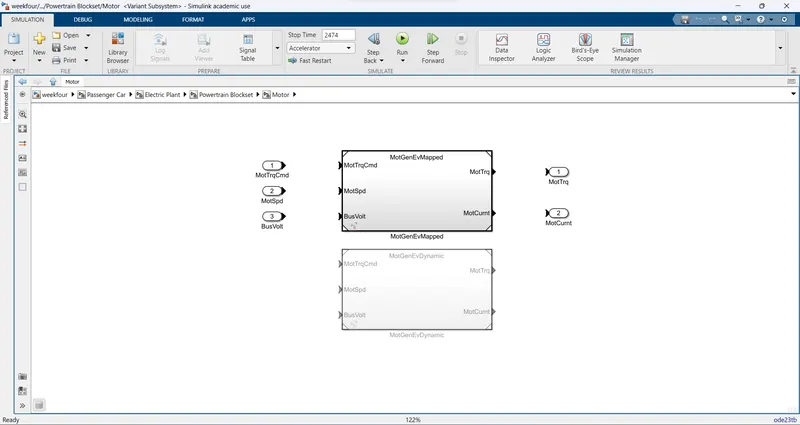
1) As seen below is the default view of the unchanged model of the mapped generator.
2) In the modelling tab of Simulink search for Variant Manager.
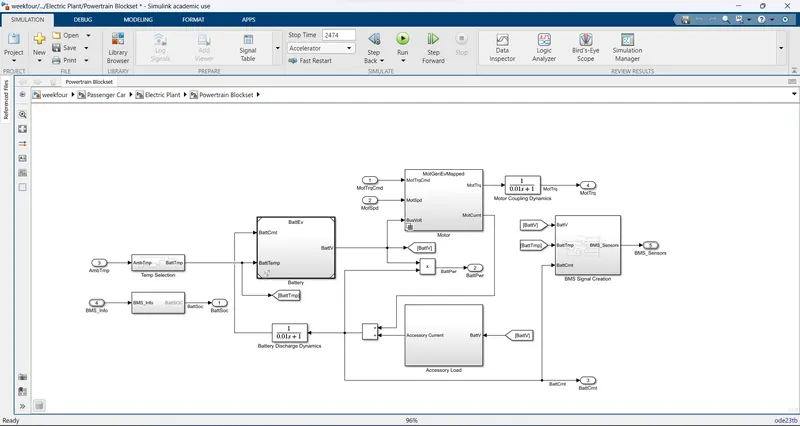
3) Thereafter, after selecting the variant manager, in the next screen search for the dynamic model of the motor, after going to the motor model.
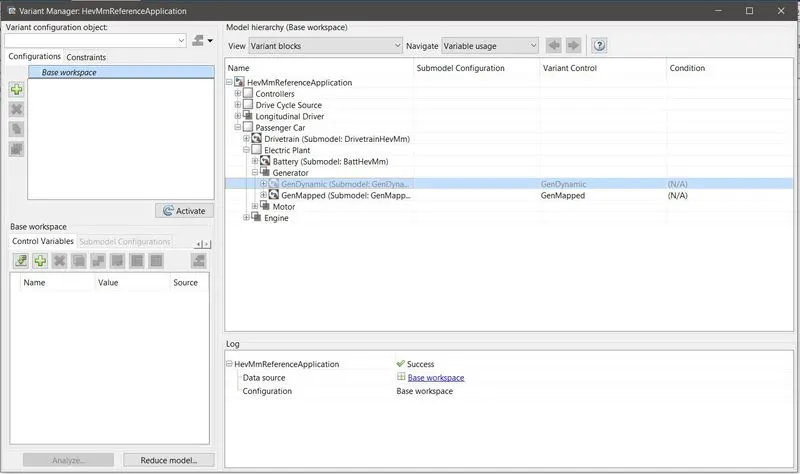
4) Right click on the model name and select “Set as Label Mode Active Choice” option of the model.
5) Once selected, the dynamic model becomes the model to be used in the simulation. As seen below is the model ready to be used for simulation
2)How does the model calculate miles per gallon? Which factors are considered to model fuel flow?
MPGe: In the US to compare the efficiency of gasoline vehicle with the BEVs, PHEVs or FCEVs MPGe unit was formulated. MPGe stands for Miles Per Gallon Equivalent. It has been found that 1 gallon of gas has the same amount of energy as 33.7 kwh of electricity.
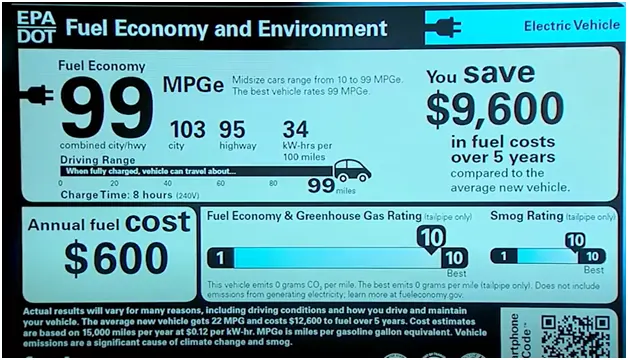
The above rating is given by EPA (Environmental Protection Agency). Here only one fuel economy is given as it runs only by electricity as it is a BEV.
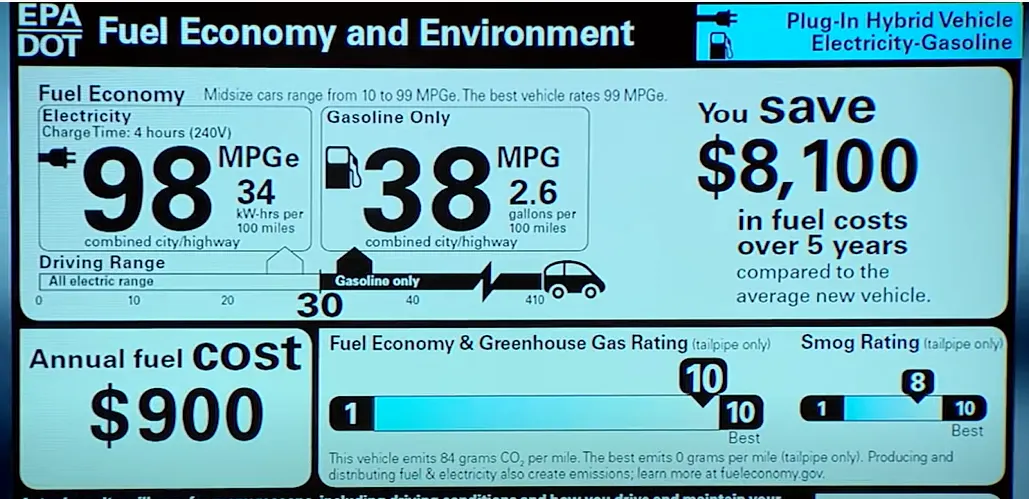
The above rating has two values as it is a PHEV. One is for pure EV mode and other one is for pure engine mode.
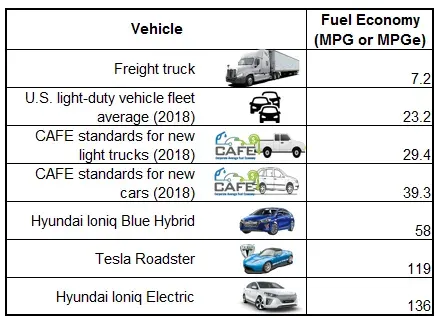
2. a. How does the model calculate miles per gallon?
- The model calculate miles per gallon in a way that, it uses the battery power in Watts and FuelFlow in Kg and Vehicle Speed in seconds and Vehicle Speed is integrated to get the displacement or Distance in meters
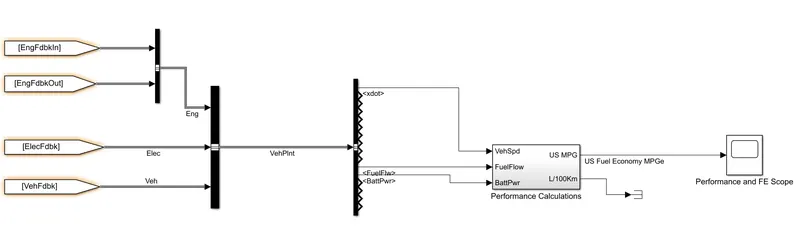
PERFORMANCE CALCULATION SUB-SYSTEM INSIDE:
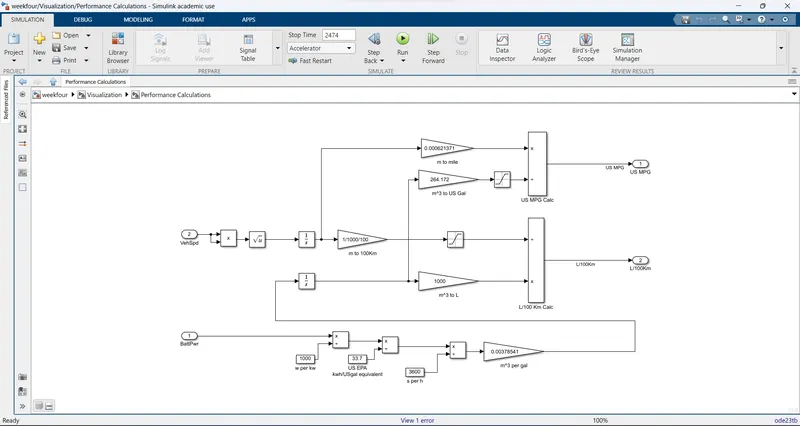
- Inside the subsystem of performance Calculation, It explains the model calculation of miles per gallon.
- The part of red color flow deals with the Calculation of miles per gallon.
- The part of green color flow deals with the Vehicle Speed.
- The part of blue color flow deals with Fuel Flow and Battery power.
- The part of purple color flow deals with Battery power.
- The Red color flow is the main aim to know how to calculate the miles per gallon.
- First, the battery power (x) in Watts is divided by 1000 to get Kilo Watts and Kilo Watts is Divided By 33.7 Kwh/US gallon which is the Equivalent of US EPA (Environmental Protection Agency) for US gallon Equivalent in Kilo Watt Hours.
- Then Kilo Watt Hours is converted in to Kilo Watt second by divided by 3600 to Kilo Watt Hours.
- Now the US EPA value and 3600 Kilo Watt second is multiplied by 0.00378 which gives the m3/gallon and multiplied by 739 to convert m3/gallon into Kgm3 and added to Fuel Flow.
- Then Fuel flow and battery power are added to get Kg/m3 to m3 and multiplied by 264.172 to convert m3 into Us Gallon.
- Then Lastly, Vehicle Speed is taken from xdot which is the Vehicle speed and under go into integration to get distance, We know that by integrating the speed we get distance in Meters (m), by Multiplied by 0.00062137 is going to convert the meter in to miles.
- Now Miles is divided by gallon we get miles per gallon. In a way Vehspeed/Fuel+Batpower we get miles per gallon.
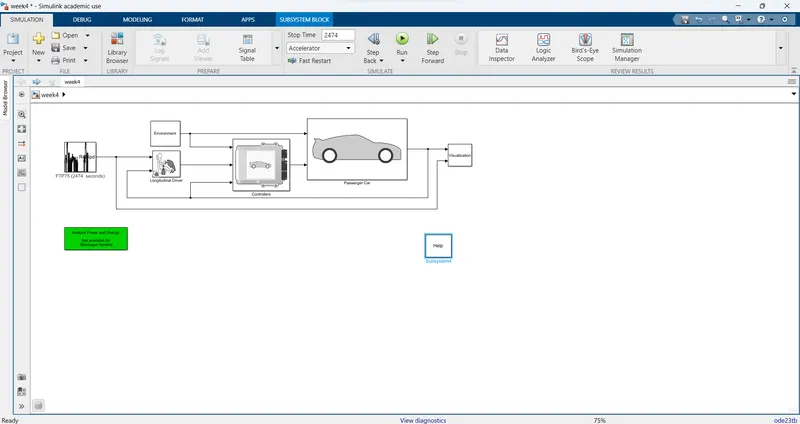
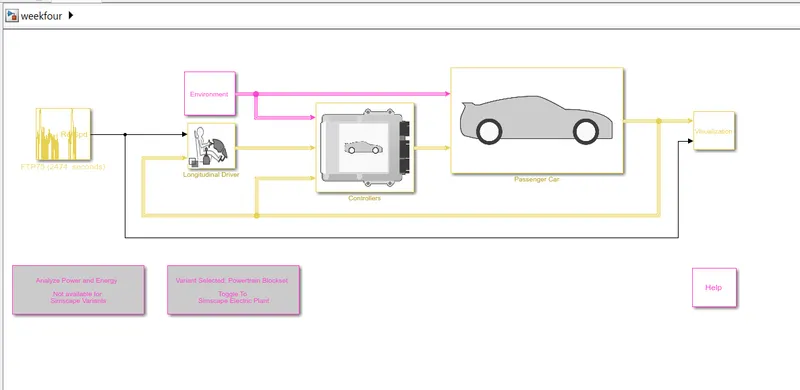
THE LINK SHOWS THE SIMULINK https://drive.google.com/file/d/1g4xJRso-sYD-ZAAUX6UmZg34SN7caIo-/view?usp=sharing
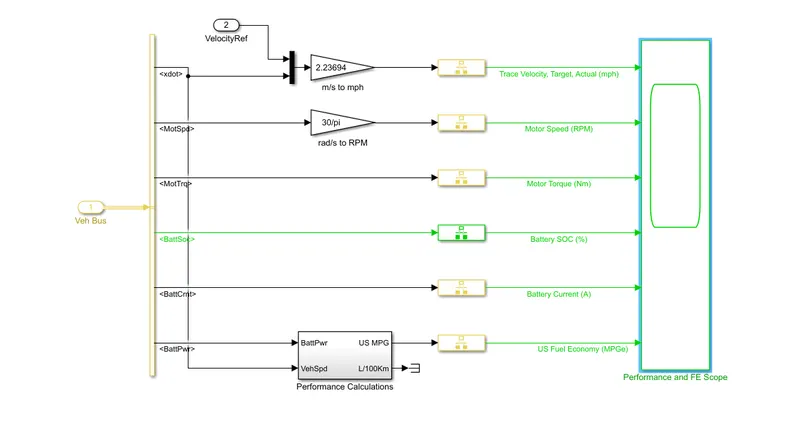
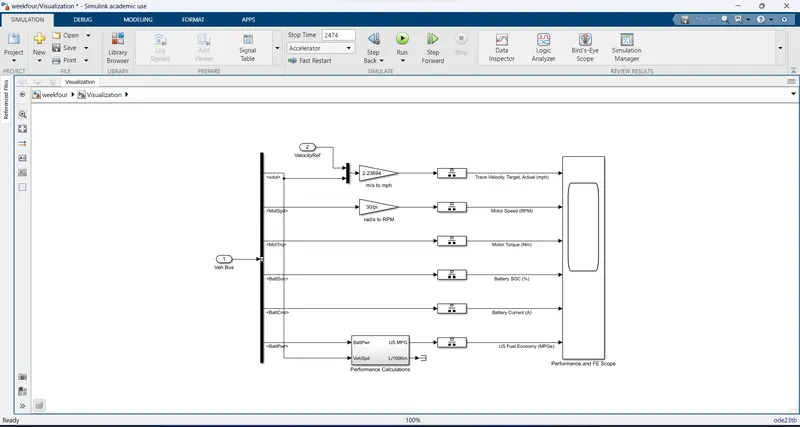
By clicking on the visualization
In transportation, the unit of energy is usually kilowatt-hour. The energy consumption per unit distance in KWh/Km is used to evaluate the vehicle energy consumption.
In the U. S., the distance per unit volume of fuel is expressed in miles per gallon (mpg). Energy consumption is an integration of the power output at the battery terminals.
The factors to be considered are vehicle speed, Battery Power, and fuel volume flow. The vehicle speed is multiplied by time and then integrated to get the range of distance.
This value is multiplied by factor 0.0000621371 to convert into distance, mile. Both the battery cell fuel and FuelVolFlw are then integrated. The total volume value is multiplied by factor 264.172 to convert the volume from m3 to US Gallon. Then the distance is divided by total Fuelvolflw to get miles per Gallon, US MPG
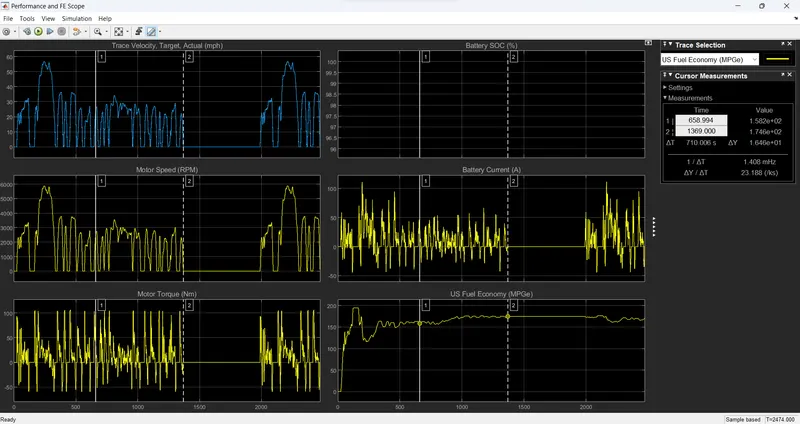
the performance and efficiency as been given in the scope
THE LINK SHOWS THE SIMULINK
https://drive.google.com/file/d/1vy1UB-0ntTCgmXB6XNX_IlPZ3cf590H_/view?usp=sharing
3. Run the HEV Reference Application with WOT drive cycle. Change the grade and wind velocity in the environment block. Comment on the results.
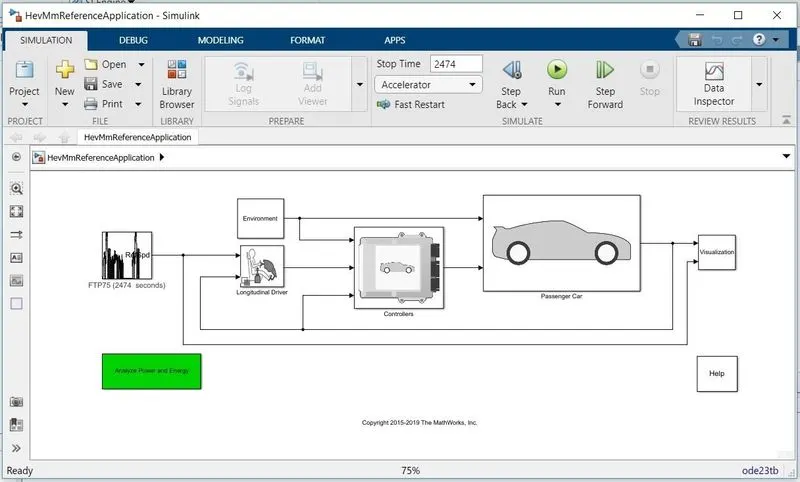
Description: -
1) Open ‘HEV Reference Application’ model in MATLAB.
2) It consists of various subsystems which are similar to ‘EV Reference Application’ but the complexity is more in ‘HEV Reference Application’ model.
Case 1:-
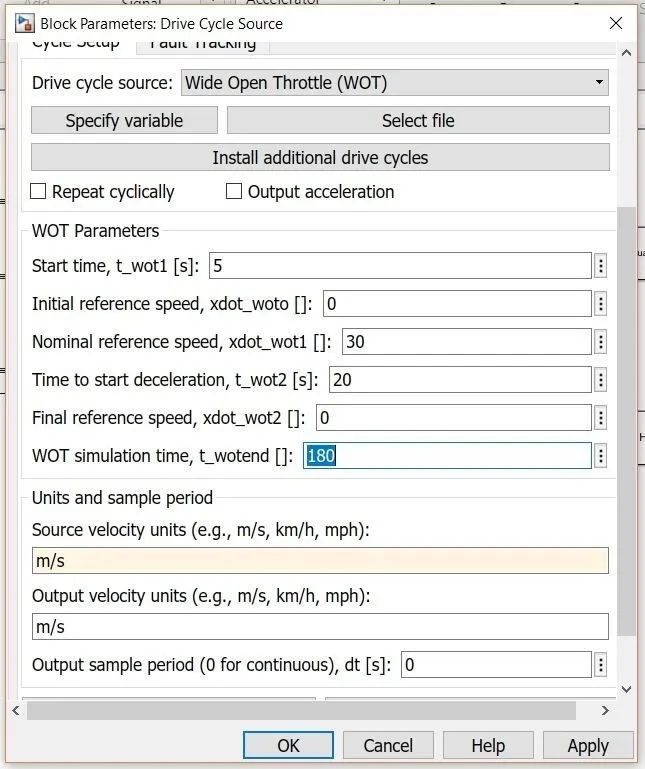
The default drive cycle is FTP75 with 2474 sec. Now change it to WOT drive cycle as below with WOT simulation time as 180 sec and click on 'OK'.
Result:-
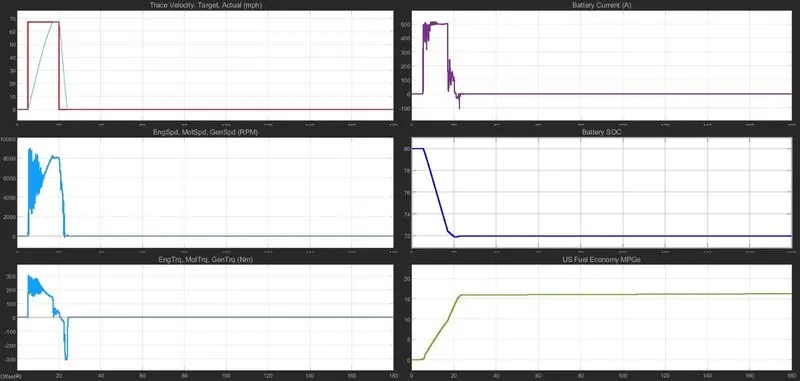
1) The target velocity actual was able to achieve 67.1 mph. The battery current was increased up to 500 Amp and maintained for a duration of 14 sec.
2)Engine speed is able to achieve 8000 RPM and battery State of Charge (SOC) was decrease from 80 to 72.
3) Engine torque increases initially and goes to negative after 20th second and the peak torque achieve was around 275 Nm. The fuel economy was increased from 0 to 16 and remains constant.
Graph 1:-
Case2:-
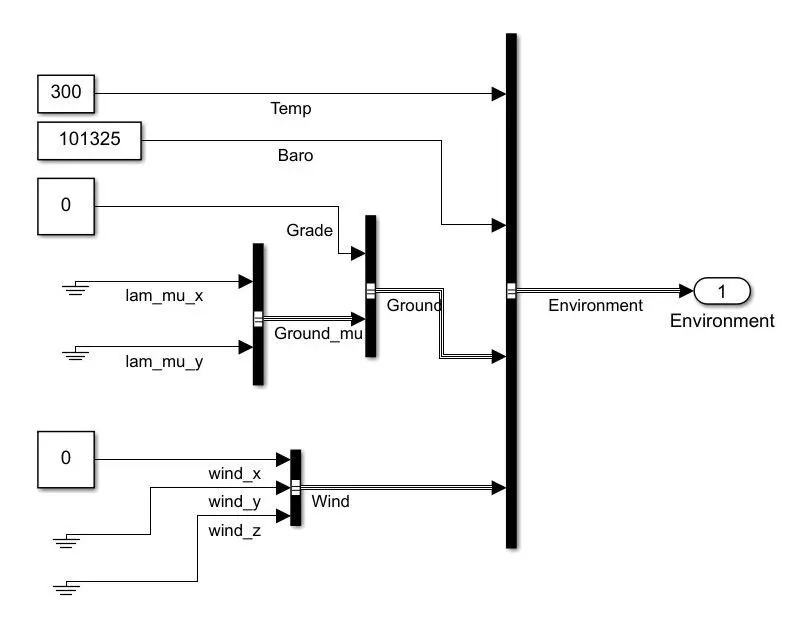
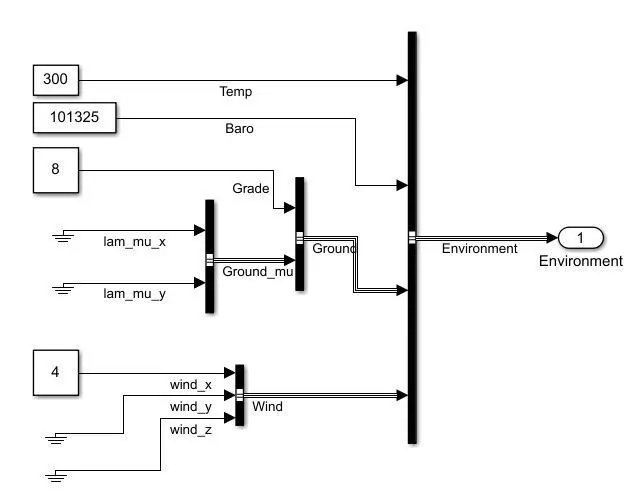
Now changing the Environment sub-system in case1 specification of HEV reference application. The grade was now changed from 0 to8 and wind velocity from 0 to 4.
Graph 2:-
Result:-
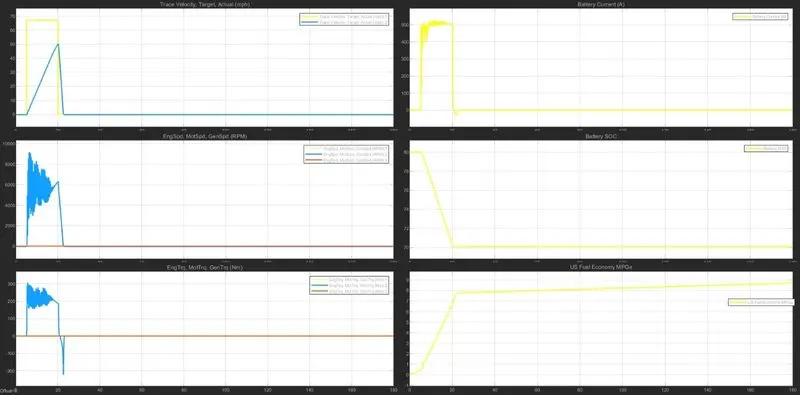
1) The target velocity actual was only able to achieve 50.4 mph. The battery current was increased up to 500 Amp and maintained for a duration of 14 sec.
2)Engine speed was able to achieve 8000 RPM but for a small duration of time and battery State of Charge (SOC) was decrease from 80 to 70.
3) Engine torque increases initially and goes to negative after 20th second and the peak torque achieve was around 275 Nm. The fuel economy was increased from 0 to 8.7 and remains constant.
4 ) Keeping all other parameters same, compare the simulated results of hybrid and pure electric powertrains.
Case 1:- HEV Multimode Reference Application
1) open Hev Reference Application model in MATLAB.
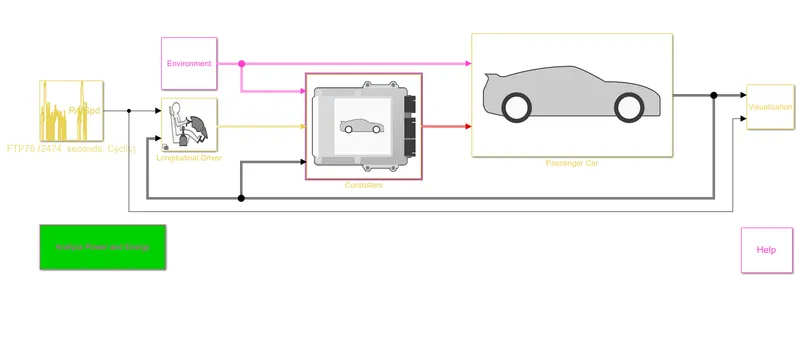
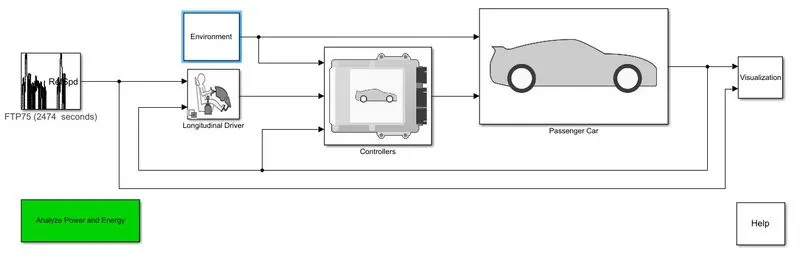
2) The model consists of Environment, Drive cycle, Longitudinal Driver passenger and visualisation Subsystem.
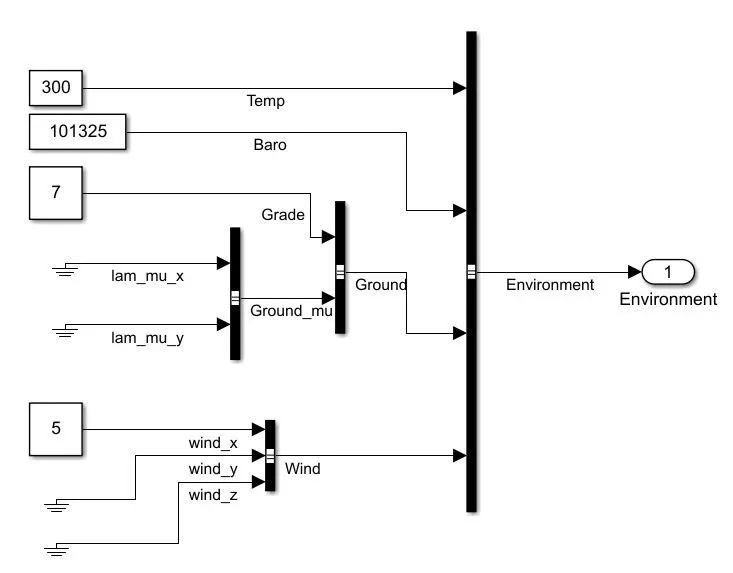
3) open the environment block and change the grade value to 7 and wind velocity to 5.
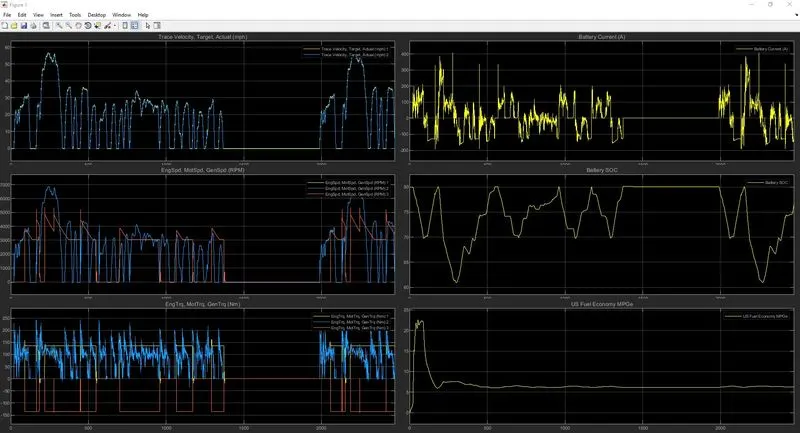
4) Now run the simulation with 2474 seconds and go to visualisation to see the graph.
Model: -
Result Graph :-
Case 2:- EV Reference application model
1) open Electric Vehicle Reference Application model in MATLAB.
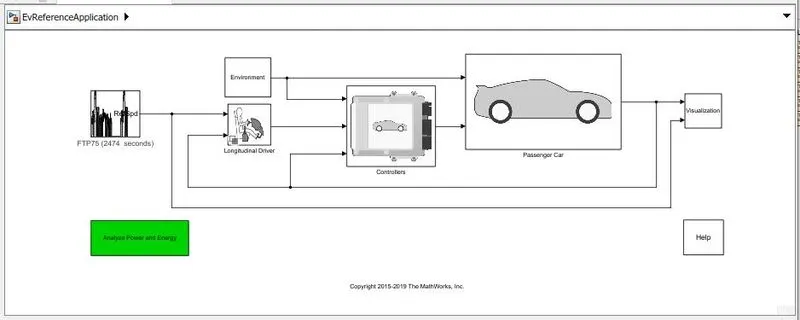
2) The model consist of Environment, Drive cycle, Longitudinal Driver passenger and visualisation Subsystem as similar to HEV but as it is a pure electric vehicle the complexity in the model is less and the rendering time is less.
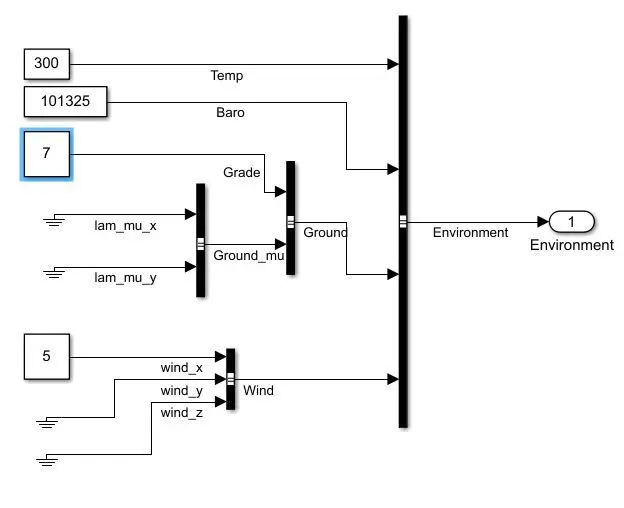
3) open the environment block and change the grade value to 7 and wind velocity to 5.
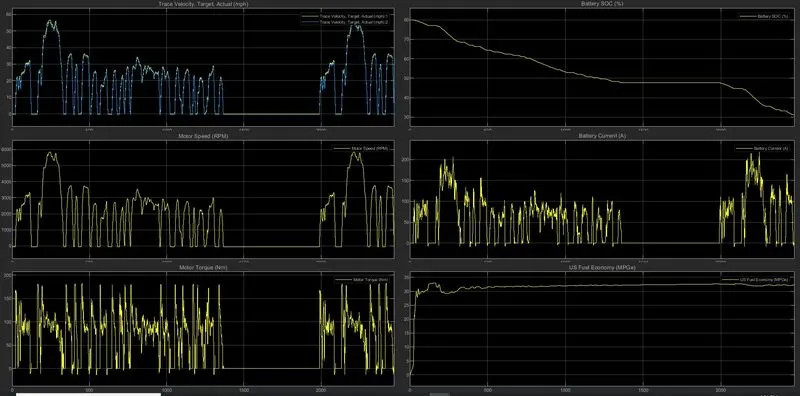
4) Now run the simulation with 2474 seconds and go to visualisation to see the graph.
Model:-
Result Graph:-
Conclusion: -
1) Battery current is continuously changing in HEV due to charging and discharging while in pure EV the battery current is consistency dropping.
2) The US fuel economy is high in EV compared to HEV, traveling cost is less for EV.
3) The motor speed (RPM) is high for HEV compared to EV.