Project
AIM:
To perform a system level simulation of model-BAJA ALL Terrain vehicle (ATV) that uses CVT and Analyze that uses CVT and Analyze and interpret the results.
OBJECTIVE:
1. Study the Baja ATV model without dashboard.
2. Study the Baja ATV model with dashboard.
3. Study the Baja ATV model using lookup table without dashboard.
4. Study the Baja ATV model using lookup table with dashboard.
INTRODUCTION:
Transmission, which transmits the power from engine to the wheels through the shafts. It consists of 4 types mainly,
• Manual transmission.
• Continuous variable transmission.
• Semi-automatic transmission.
• Automatic transmission.
THEORY:
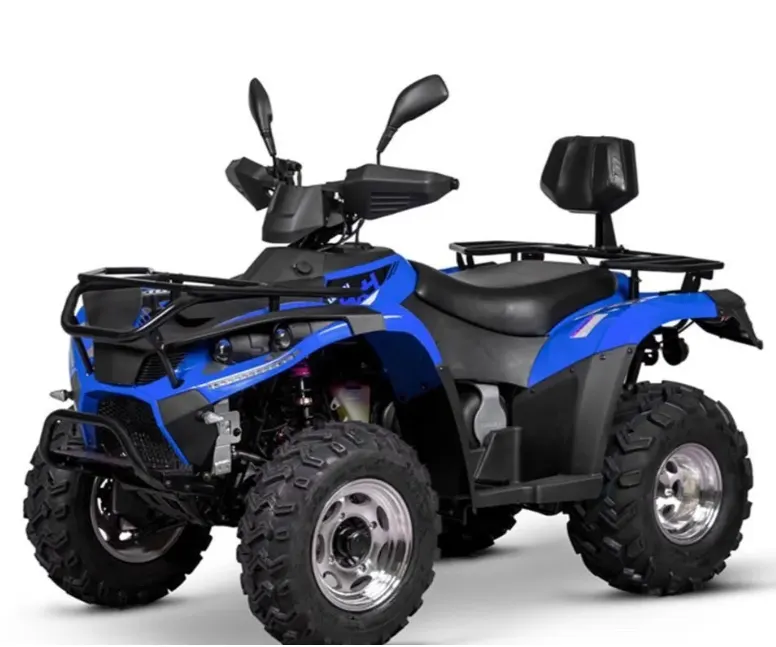
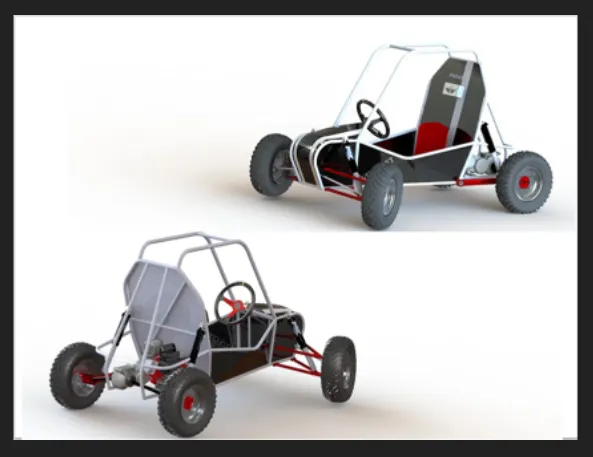
ATV: An all-terrain vehicle (ATV) refers to a motorized single-seated tri or quadricycle bike and buggy that is designed for off-road travel and activities. The vehicle consists of handlebars and low-pressure tires that have deep-threaded structures, which assist in driving over muddy, rocky, wetlands and dune topologies. In comparison to other utility vehicles (UTVs), ATVs offer excellent off-road capabilities and can carry heavy equipment over long distances and narrow access points. They can also be customized for high-performance riding, owing to which they find extensive applications across various industries, including sports, entertainment, agriculture, military and defense.
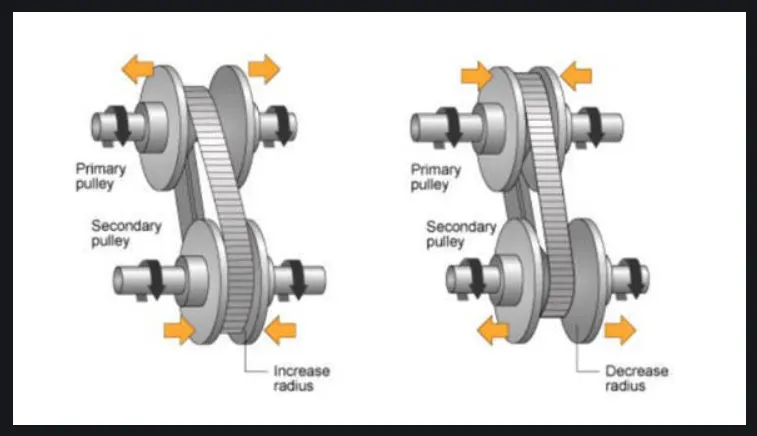
A continuously variable transmission, or CVT, is a type of automatic transmission that provides more useable power, better fuel economy and a smoother driving experience than a traditional automatic transmission. The CVT is a system that makes it possible to vary stepless the transmission ratio without interruption of the torque flow. Therefore, an infinite number of ratios (between a minimum and maximum value) are possible. It is an automatic, single speed, and gearless transmission that can shift through an infinite number of gear ratios. This ability to seamlessly shift through these different gears provides a number of benefits including extremely smooth shifts and exceptional fuel economy. A CVT draws top engine power from a small engine, which gives drivers quicker acceleration than standard automatic transmissions. Because of their greater ability to control the engine speed range, CVTs produce fewer emissions. CVTs are also lighter weight than traditional automatic transmissions.
STUDY :1
The link shows the Baja AVT model
https://drive.google.com/file/d/1xDG2krDzhf97VA2pGUwquktNmkIaztb2/view?usp=sharing
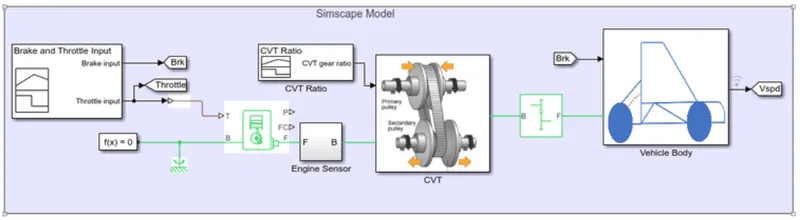
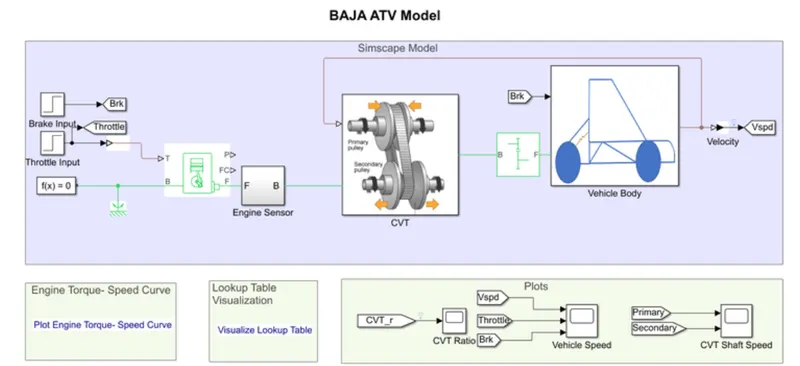
By using Simulink model of CVT consists of Signal builder, generic engine, motion sensors, vehicle transmission, vehicle body, tyres and solver configuration blocks etc.
The CVT subsystem includes Transmission block, input and output shaft inertia and motion sensors.
The vehicle body subsystem includes vehicle body block, double drum brake and tyres.
The initial engine speed is given as 2100 rpm, mechanical rotation for driven pulley and driver pulley as 0.8 & 0.7 respectively. The mass of the vehicle as 250kg and 2 axles which connects 4 wheels accordingly.
BAJAJ ATV MODEL

The models consist of common blocks as follows:
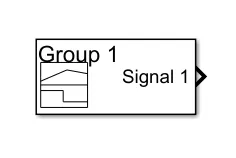
Signal Builder. The Signal Builder block allows you to create interchangeable groups of piecewise linear signal sources and use them in a model. You can quickly switch the signal groups into and out of a model to facilitate testing.
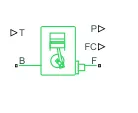
Generic Engine: Represents a system-level model of spark-ignition and diesel engines suitable for use at initial stages of modeling when only the basic parameters are available. Optional idle speed and red line controllers are included. The throttle input signal T lies between zero and one and specifies the torque demanded from the engine as a fraction of the maximum possible torque. If the engine speed falls below the Stall speed, the engine torque is blended to zero. If the engine speed exceeds the maximum speed, the simulation stops and issues an error message. Connections F and B are mechanical rotational conserving ports associated with the engine crankshaft and engine block, respectively. Connections P and FC are physical signal output ports through which engine power and fuel consumption rate are reported. Speed vector and Torque vector are the assigned parameters.
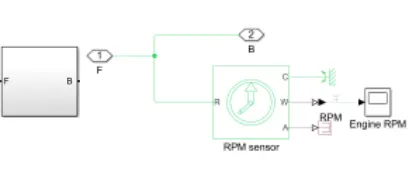
Engine Sensor: Ideal Rotational Motion Sensor. The block represents an ideal mechanical rotational motion sensor, that is, a device that converts an across variable measured between two mechanical rotational nodes into a control signal proportional to angular velocity or angle. The sensor is ideal since it does not account for inertia, friction, delays, energy consumption, and so on.
Connections R and C are mechanical rotational conserving ports and connections W and A are physical signal output ports for velocity and angular displacement, respectively.
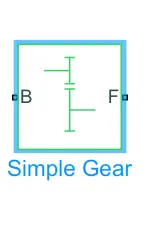
Simple Gear. Represents a fixed-ratio gear or gearbox. No inertia or compliance is modeled in this block. You can optionally include gear meshing and viscous bearing losses. Connections B (base) and F (follower) are mechanical rotational conserving ports. Specify the relation between base and follower rotation directions with the Output shaft rotates parameter. Optionally include thermal effects and expose thermal conserving port H by right-clicking on the block and selecting Simscape block choices to switch between variants.
Follower (F) to base (B) teeth ratio (NF/NB): 4
CVT SUBSTEM:
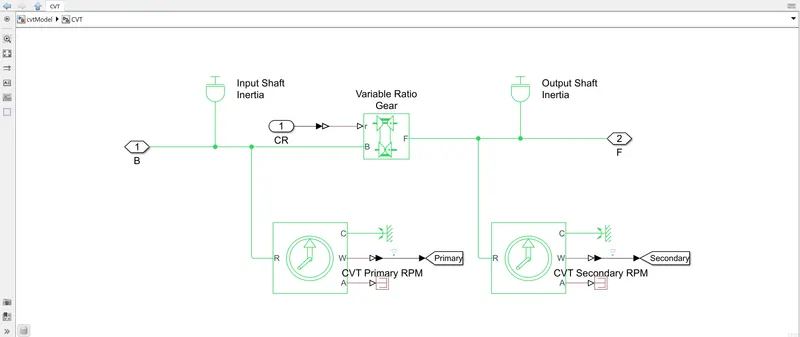
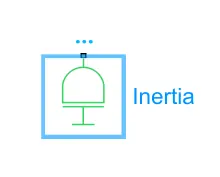
Inertia: The block represents an ideal mechanical rotational inertia. The block has one mechanical rotational conserving port. The block positive direction is from its port to the reference point. This means that the inertia torque is positive if the inertia is accelerated in a positive direction.
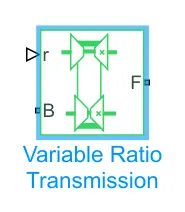
Variable Ratio Transmission: Represents a variable ratio gearbox such as implemented by mechanical belt CVT, electric, or hydraulic transmissions. The physical signal input r defines the ratio of input to output angular shaft velocities. Connections B (base) and F (follower) are mechanical rotational conserving ports. Specify the relation between base and follower rotation directions with the Output shaft rotates parameter.
VEHICLE BODY SUBSYTEM:
https://drive.google.com/file/d/1fQ_Ab74-0U0J42I0DXZMgSQxW_ktDUX7/view?usp=sharing
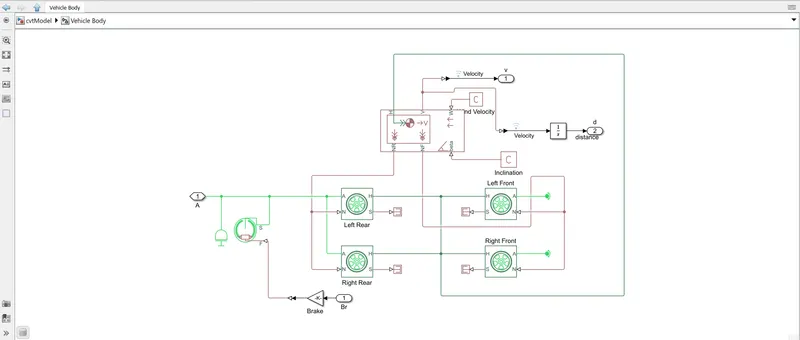
The Vehicle Body Subsystem consists of the following blocks:
Vehicle Body:
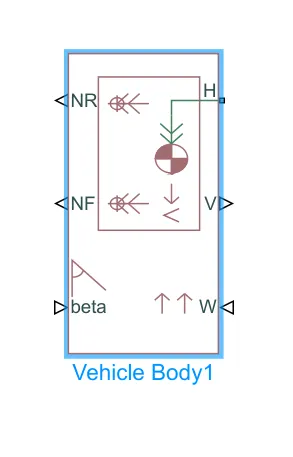
Represents a two-axle vehicle body in longitudinal motion. The block accounts for body mass, aerodynamic drag, road incline, and weight distribution between axles due to acceleration and road profile. The vehicle can have the same or a different number of wheels on each axle. Optionally include pitch and suspension dynamics or additional variable mass and inertia. The vehicle does not move vertically relative to the ground. Connection H is the mechanical translational conserving port associated with the horizontal motion of the vehicle body. The resulting traction motion developed by tires should be connected to this port. Connections V, NF, and NR are physical signal output ports for vehicle velocity and front and rear normal wheel forces, respectively. Wheel forces are considered positive if acting downwards. Connections W and beta are physical signal input ports corresponding to headwind speed and road inclination angle, respectively. If the variable mass is modeled, the physical signal input ports CG and M are exposed. CG accepts a two-element vector representing the x and y distance offsets from vehicle CG to additional load mass CG. M represents the additional mass. If both variable mass and pitch dynamics are included, the physical signal port J accepts the inertia of the additional mass about its own CG.
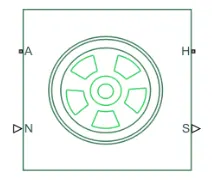
Tire: Represents the longitudinal behavior of a highway tire characterized by the tire Magic Formula. The block is built from Tire-Road Interaction (Magic Formula) and Simscape Foundation Library Wheel and Axle blocks. Optionally, the effects of tire inertia, stiffness, and damping can be included. Connection A is the mechanical rotational conserving port for the wheel axle. Connection H is the mechanical translational conserving port for the wheel hub through which the thrust developed by the tire is applied to the vehicle. Connection N is a physical signal input port that applies the normal force acting on the tire. The force is considered positive if it acts downwards. Connection S is a physical signal output port that reports the tire slip. Optionally expose physical signal port M by setting Parameterize by to Physical signal Magic Formula coefficients. Physical signal port M accepts a four-element vector corresponding to the B, C, D, and E Magic Formula coefficients.
Parameters (common for all tires) are:
Parameterize by: Constant Magic Formula coefficients Magic Formula B coefficient: 10
Magic Formula C coefficient: 1.9
Magic Formula D coefficient: I
Magic Formula E coefficient: 0.97
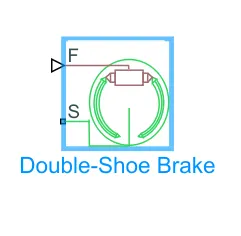
Double-Shoe Brake: Represents a brake arranged as two pivoted rigid shoes symmetrically installed inside or outside a drum and operated by one actuator. The actuator force causes the shoes to exert a friction torque on a shaft connected to the drum.
Connection S is a conserving rotational terminal associated with the drum shaft. Connection F is a physical signal port representing the force input to the actuator. Positive force creates friction torque that resists shaft rotation. Optionally include thermal effects and expose thermal conserving port H by setting Thermal port to Model.
Parameters are:
Drum radius: 150 mm Actuator location radius: 100 mm
Pin location radius: 125 mm
Pin location angle: 15 deg Shoe beginning angle: 5
deg Shoe span angle: 120 deg.
.
Parameters are:
Mass: 250 kg
Number of wheels per axle: 2
Horizontal distance from CG to front axle: 1 m
Horizontal distance from CG to rear axle: 0.35 m
CG height above ground: 0.7 m
Gravitational acceleration: 9.81 m/s^2
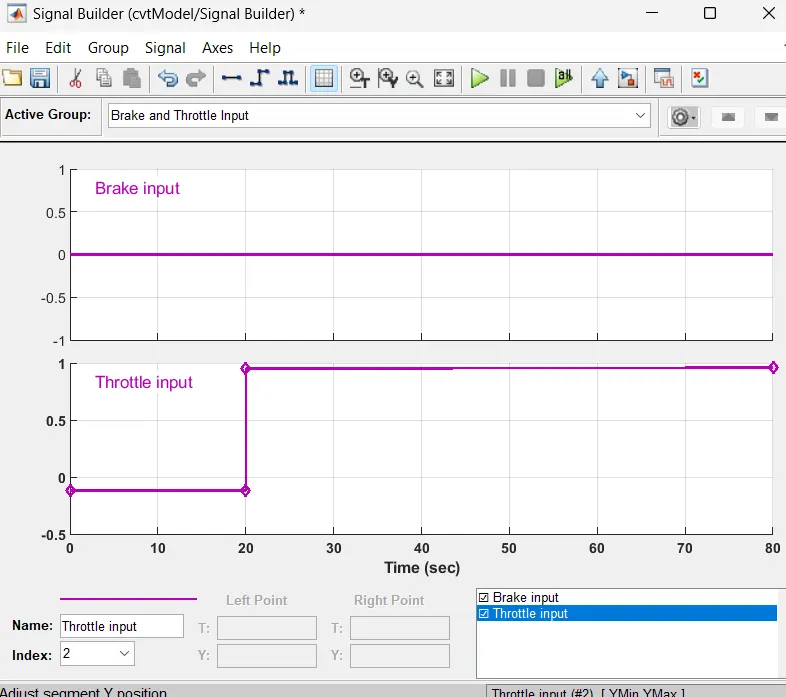
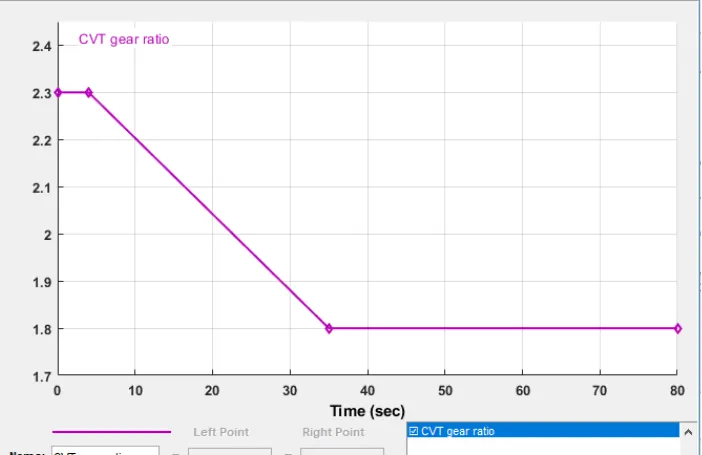
The signal builder is used as input for brake, throttle and gear ratio. Brake input is maintained as 0 for overall simulation. The throttle input is given as 0.3 for20 secs and increases to 1 for overall simulation. The throttle valve is mainly to control the flow or amount of fuel into the engine, if the throttle value increases the flow of fuel increases to the IC engine which in turn increases the power of the engine. The gear ratio is maintained as 2.3 for 5 secs and linearly decreases to 1.8 and maintained constant for overall simulation.
BRAKE AND THROTTLE INPUT :
CVT GEAR RATIO :
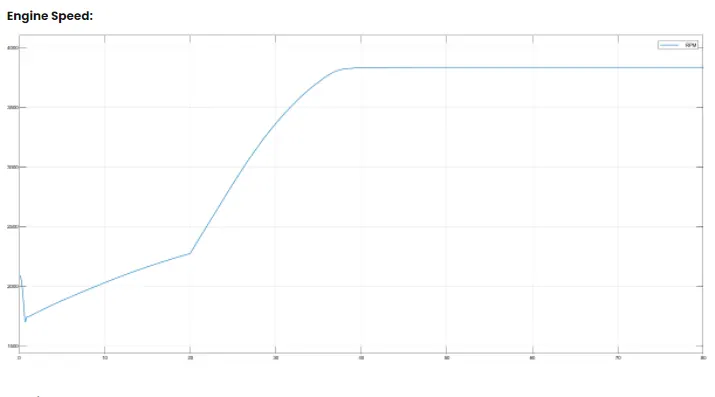
ENGINE SPEED :
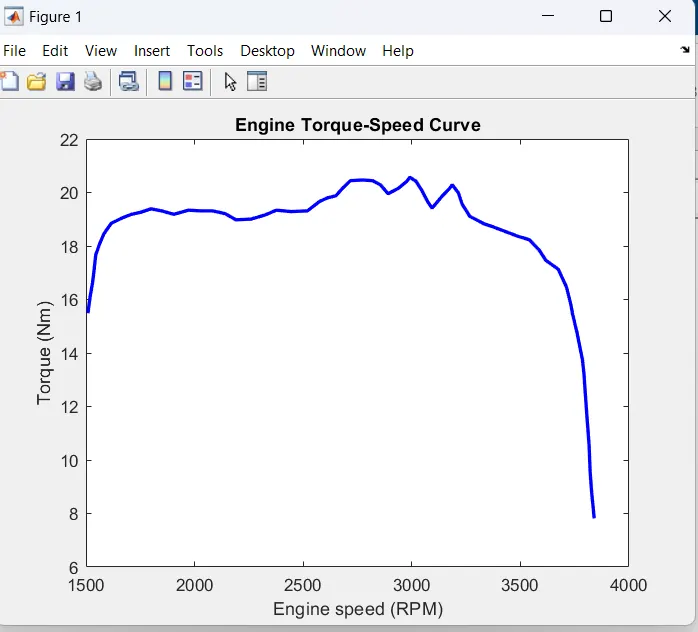
ENGINE TORQUE-SPEED CURVE :
STUDY -2:
With Dashboard
https://drive.google.com/file/d/1TPgFEXKjwIX1Cw8sp_gh6nSS5pURaZ4G/view?usp=sharing
A Simulink model for the BAJA ATV Model including the dashboard is shown below. The rest of the parts and subsystems are common in the above part 411 Dashboard: A dashboard (also called dash, instrument panel (IP), or fascia) is a control panel usually located directly ahead of a vehicle's driver, displaying instrumentation and controls for the vehicle's operation. The initial conditions are as follows: Brake Input = 0 Throttle Input = 0.3
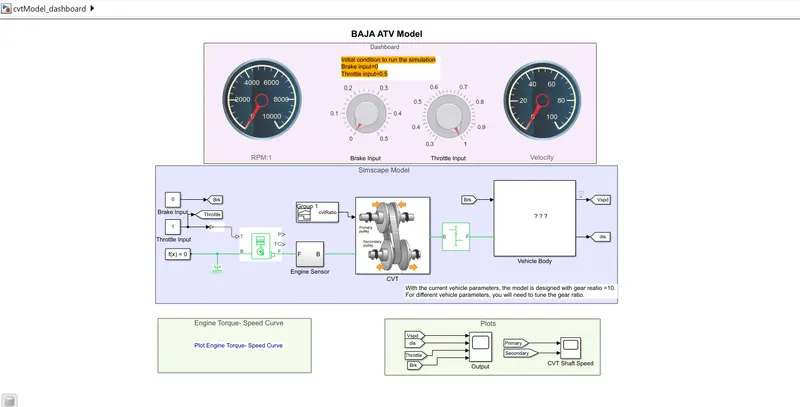
The above figure shows 'Baja ATV with dashboard model which consists throttle meter and brake input in the dash board instead of giving input through signal builder. Rest of the blocks and subsystems are common in the above Baja ATV model without dash board .The main concept of using dash board is study the result by varying the input of brake and throttle, which shows that the velocity and speed of the engine. The gear ratio is maintained as 2.3 for 5 secs and linearly decreases to 1.8 and maintained constant for overall simulation as shown in figure 5. As the brake input varies from 0 - 0.5, the velocity and speed decreases accordingly. By increasing the throttle, the velocity and speed of the engine & shaft increases.
#INPUT 2:
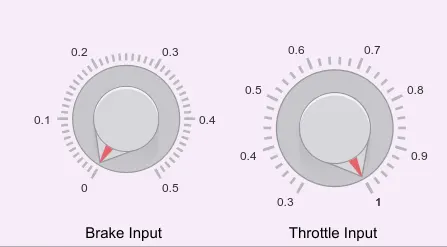
It comprises a throttle and brake input through a knob which can be varied unlike the signal builder in the previous model without dashboard. The Engine RPM gauge and velocity gauge displays the changes done by the respective Knobs.
OUTPUT:
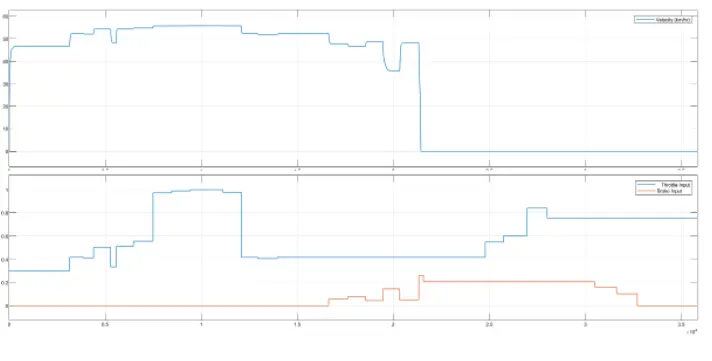
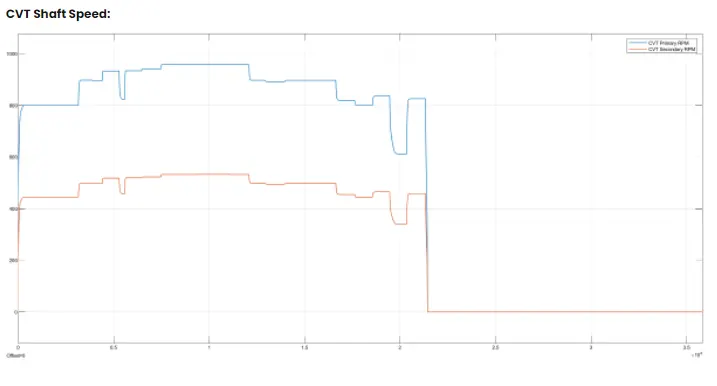
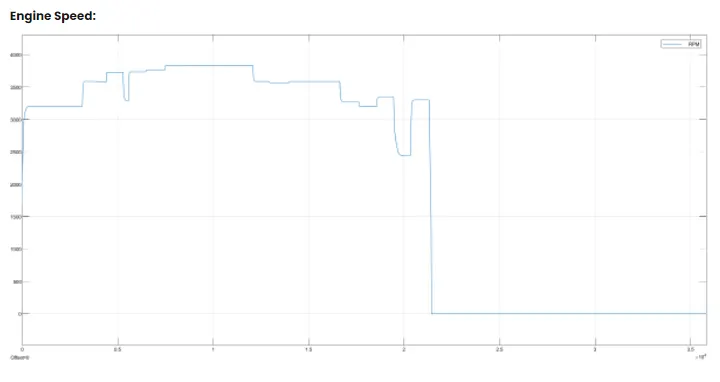
STUDY -3
SIMULATION OF BAJAJ ATV MODEL WITH A LOOK UP TABLE-THE DIFFERENCE OF FEEDBACK
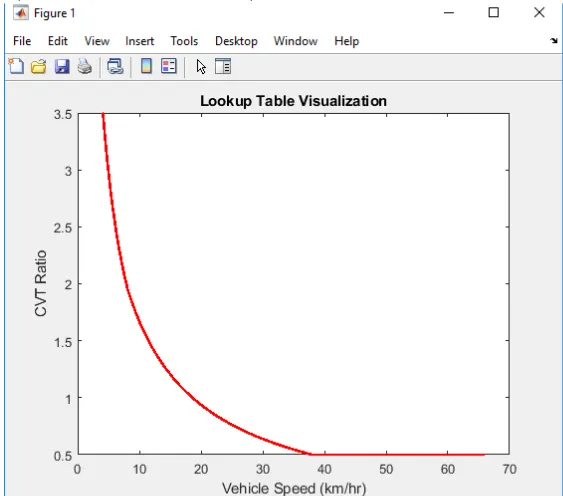
• A look up table is an array of data that maps input values to output values. This is done so as to approximate a mathematical function. When a set of input values are know a look up yield an output value corresponding to each input from a table of values. If the lookup table does not explicitly define the input values, Simulink helps by estimating an output value using interpolation, extrapolation, or rounding.
where:
• - Interpolation is the process for estimating values that lie between known data points. • - Extrapolation is the process for estimating values that lie beyond the range of known data points. • - Rounding is a process for approximating a value by altering its digits according to a known rule.
- when compared to case 1 and 2 there exists a difference the I/p to the CVT is a look up table which says a particular CVT ratio what the speed is delivered.
- Apart from the input the output speed is also tracked as fed to the primary pulley of CVT thereby acting as feedback for effective reference tracking.
OUTPUT RESULT FOR STUDY CASE -3
ENGINE TORQUE VS SPEED CURVE
CVT Ratio
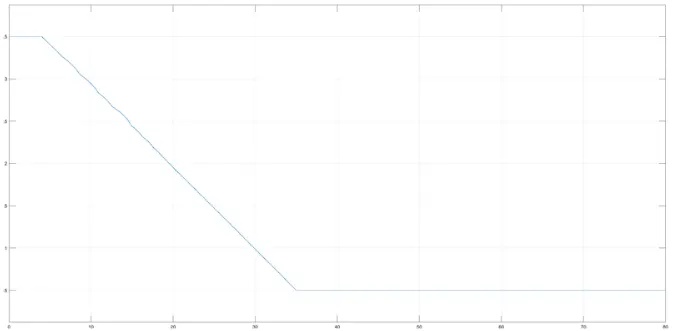
• For starting the vehicle needs a high torque hence a higher value for CVT. The CVT ratio keeps decreasing. The lookup table has vehicle speed values corresponding to a CVT ratio. For example in look-up table at speed of 20km/hr, the CVT ratio is approx equal to 1. Since there is reference tracking vehicle speed becomes 20 km/hr at 30 s. From the above graph at 30 s, is 1. This is due to the presence of feedback
VEHICLE SPPED CURVE
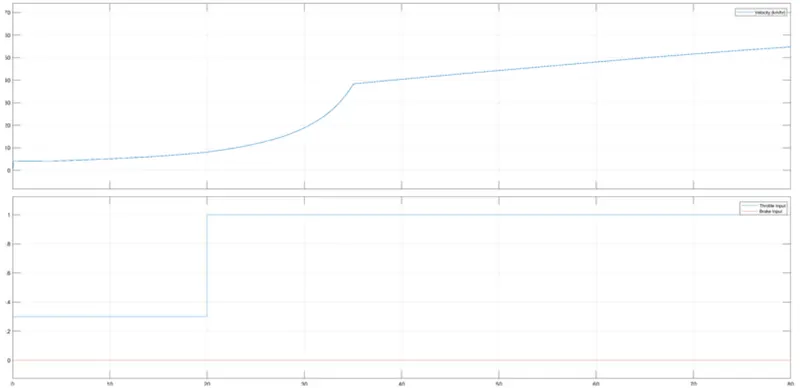
- At t=35 s the vehicle speed starts increasing hence there is a decrease in CVT Ratio to obtain more RPM of driven shaft as we as RPM driver shaft decreases.
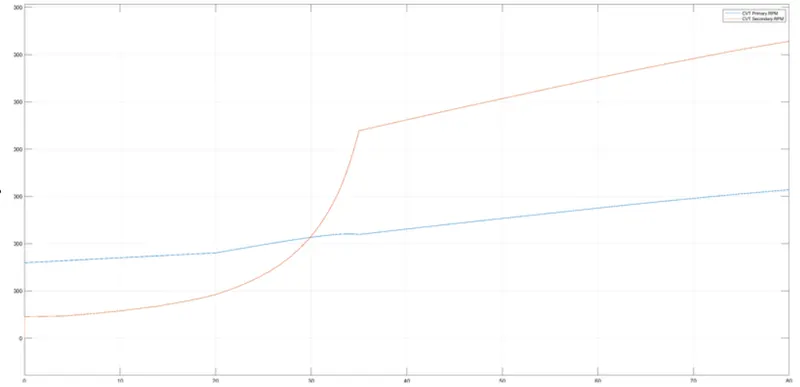
As the speed increases secondary shaft speed increases leading to a lower CVT ratio as matching with the loop up table values.
STUDY-4 SIMULATION OF BAJA ATV WITH SIMULATION AND DASHBOARD
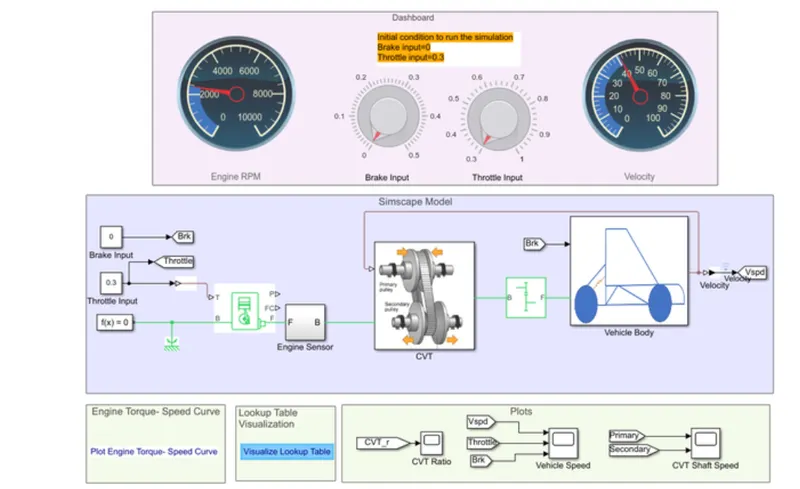
With help of a knob, it is possible to control the throttle and brake inputs.
• A lookup table is used to establish a relationship between vehicle speed and CVT.
• The initial input value for throttle is 0.3 but for brake is 0.
RESULTS FOR THE OUTPUT OF STUDY CASE-4
ENGINE TORQUE VS SPEED CURVE
CVT RATIO
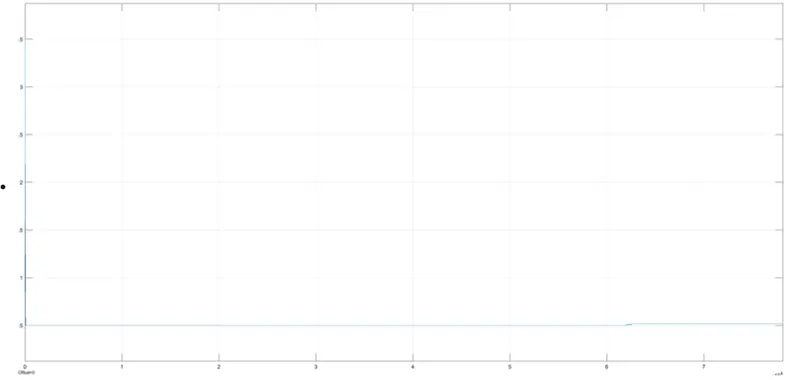
The input value of the throttle is set as 0.3 so there is gradual decline in CVT Ratio but a speed fall at start itself can be seen.
VEHICLE SPEED CURVE
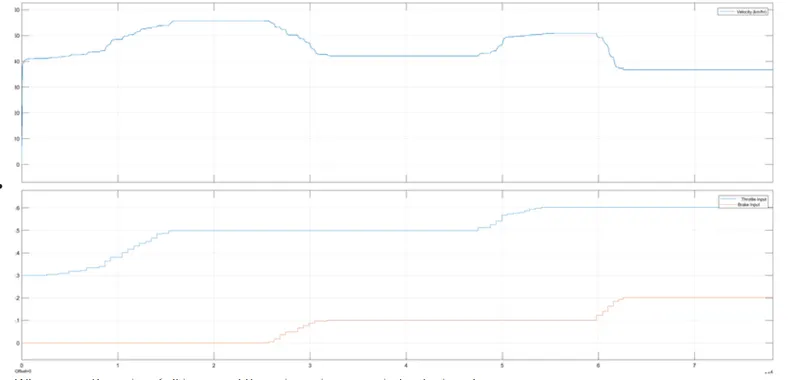
If there is a fall in speed there is increase in the break input
CVT SHAFT SPEED
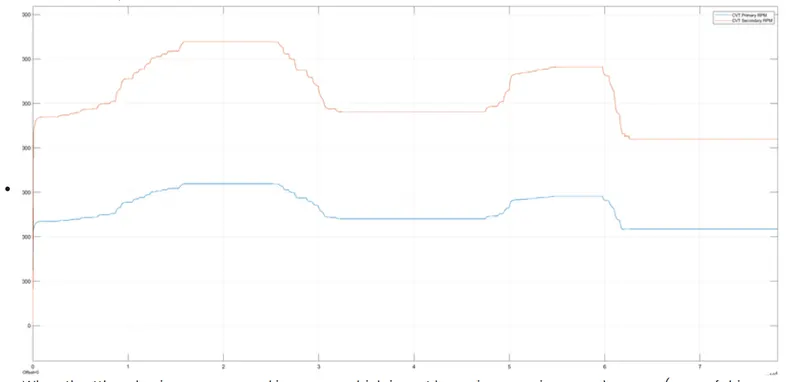
When thorttle value increases speed increases which is met by an increase in secondary rpm ( rpm of driven shaft) and during uniform speed the CVT ratio doesnt change which can be seen via seondary and primary rpm remain constant during these periods.
CONCLUSION:
(1) Successfully studied and carry out a system-level simulation of an all-terrain vehicle of SAE BAJA.
(2) Observed the vehicle speed, CVT shaft speed and Torque-Speed curve graphs when changing the values of throttle and brake at the input.
(3) The speed becomes constant after certain rpm and decreases when the brakes are applied at different time.
The quality of output of a simulation depends on type of input
- In real-time scenarios it is better to vary values in real-time than a signal builder input.
- Lookup table makes output curves smoother. If the lookup table does not explicitly define the input values, Simulink helps by estimating an output value using interpolation, extrapolation, or rounding giving better quality results
- To achieve the desired output, it is always good to use feedback.
- Dashboard elements help to provide instantaneous inputs.
- As a throttle input increases there happens an increase in speed but the CVT ratio falls, when there is an increase in brake input the speed falls but there will be an increase in CVT ratio.
- Understanding of working of a CVT.
REFERENCES
https://in.mathworks.com/matlabcentral/fileexchange/70576-baja-all-terrain-vehicle-atv-model
https://www.youtube.com/watch?v=gOFweQcz0XI
https://drive.google.com/file/d/1xDG2krDzhf97VA2pGUwquktNmkIaztb2/view?usp=sharing
https://drive.google.com/file/d/1TPgFEXKjwIX1Cw8sp_gh6nSS5pURaZ4G/view?usp=sharing
https://drive.google.com/file/d/1fQ_Ab74-0U0J42I0DXZMgSQxW_ktDUX7/view?usp=sharing