Week-4 Challenge WOT Condition Part-2
1.
Engine :
The Mapped Engine block implements a engine model using power, air mass flow, fuel flow, exhaust temperature, efficiency, and emission performance lookup tables.
The dynamic model gives engine characteristics that are separated into lower-level components. By combining components in this way, the models capture the dynamic effects.
Motor/Generator:
The Mapped Motor block implements a mapped motor and drive electronics operating in torque-control mode. The output torque tracks the torque reference demand and includes a motor-response and drive-response time constant. Use the block for fast system-level simulations when you do not know detailed motor parameters.
The dynamic model gives motor characteristics with lower level components like Interior permanent magnet synchronous motor (PMSM) with controller, source inverter.
It is same for the generator block also.
Steps to choose the variant :
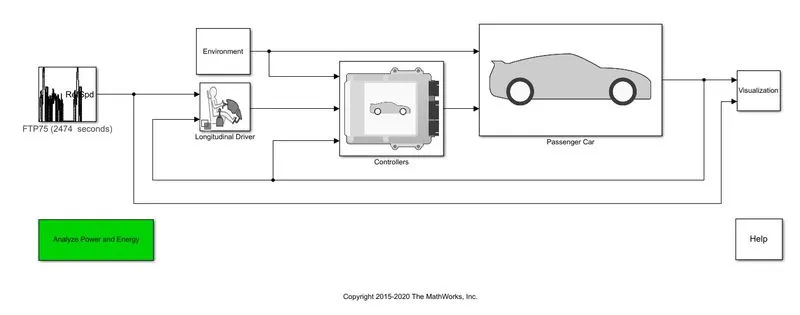
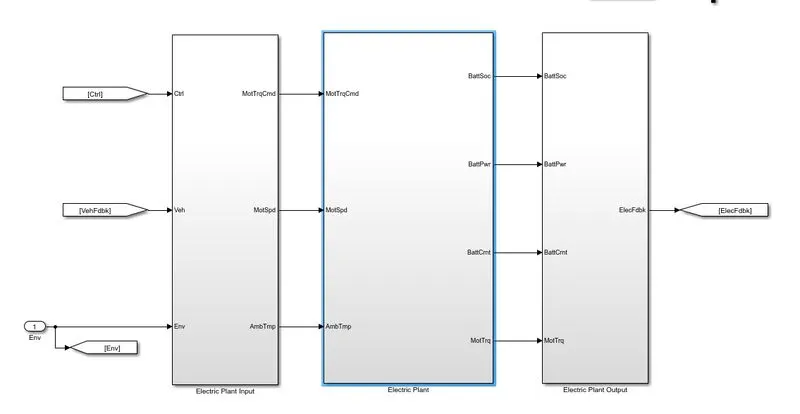
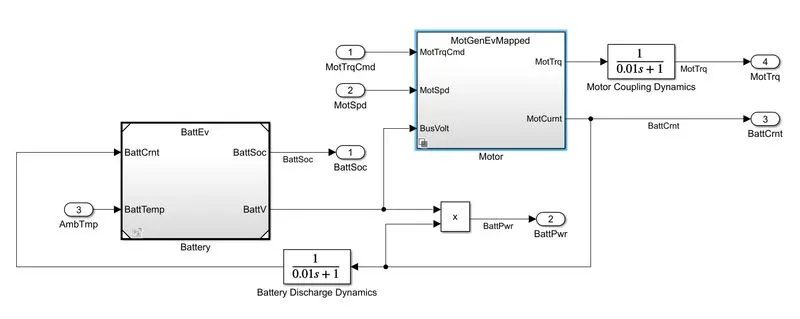
Right click on the window, Choose Variant and open label mode active choice.
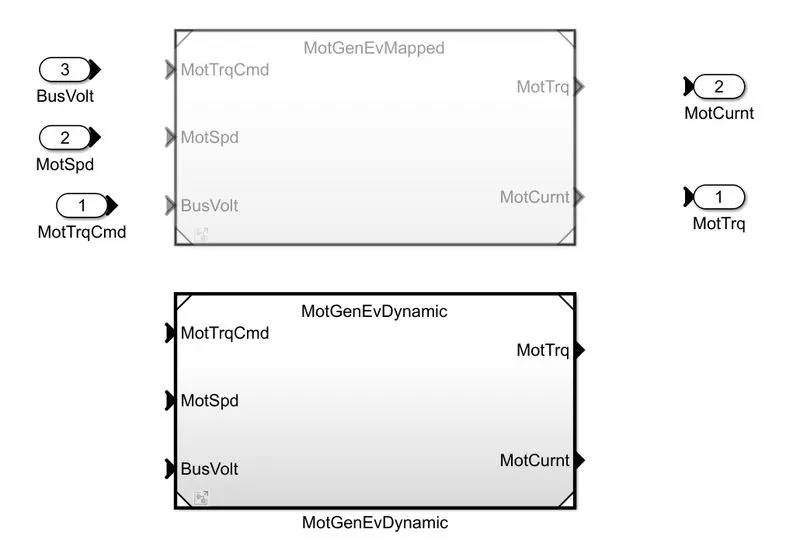
2.
Below the block for peformance calibrations :
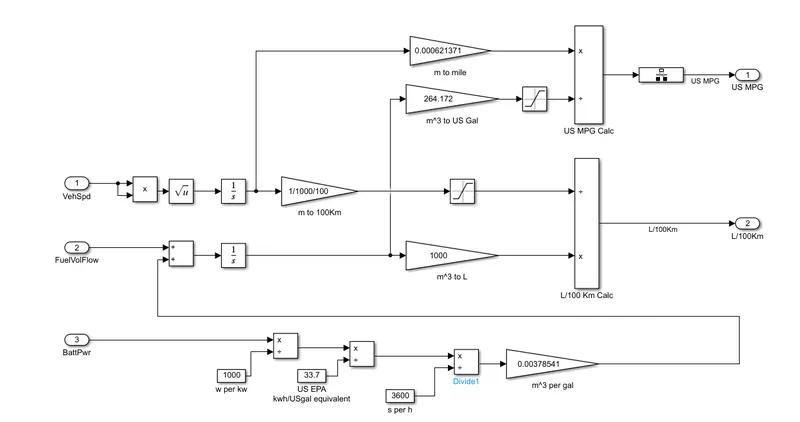
Its divided into three flow :
Vehicle Speed (1)
Fuel Volume flow (2)
Battery Power (3)
Battery Power:
Battery power from the used by the vehicle in Watts is first converted to KWH.
Then divided by 33.7 to convert KWH to US Gallon, which then is divided by 3600 for US gal/s
Multiply it by constant 0.00378541 to convert cubic meters per gallon
Add the final battery power to fuel volume flow (2) and integrate it. Multiply it by constant 264.17
to convert cubic meters to US gallons.
Vehicle speed(1) is multiplied by itself, square rooted and then integrated and multiplied by
constant 0.000621371 to convert meters to miles.
Finally divide miles by US gallons to give US MPG Calc.
So for the factors which are considered for fuel flow are
Vehicle Speed (1)
Fuel Volume flow (2)
Battery Power (3)
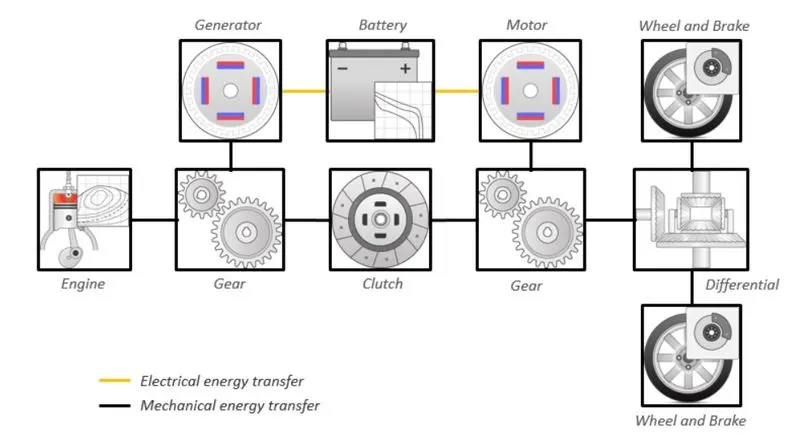
3. Hybrid Electric Vehicle Multimode Reference Application
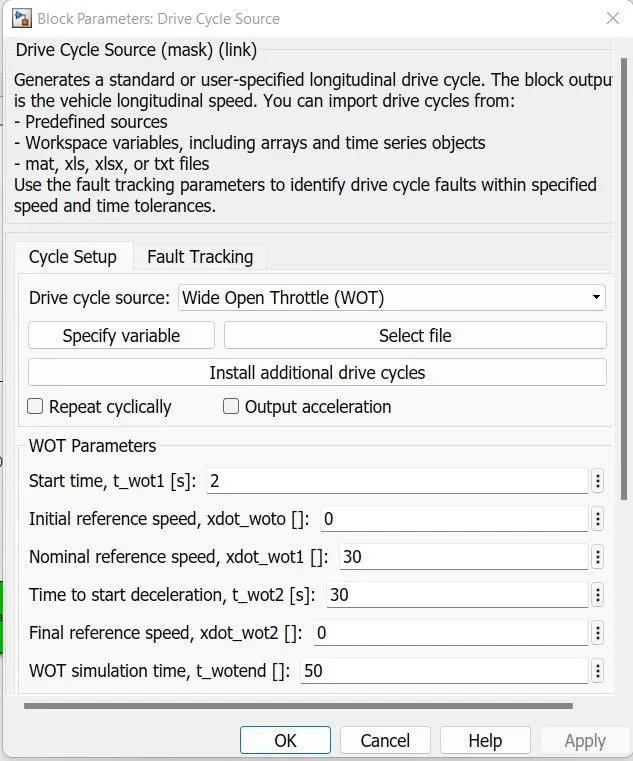
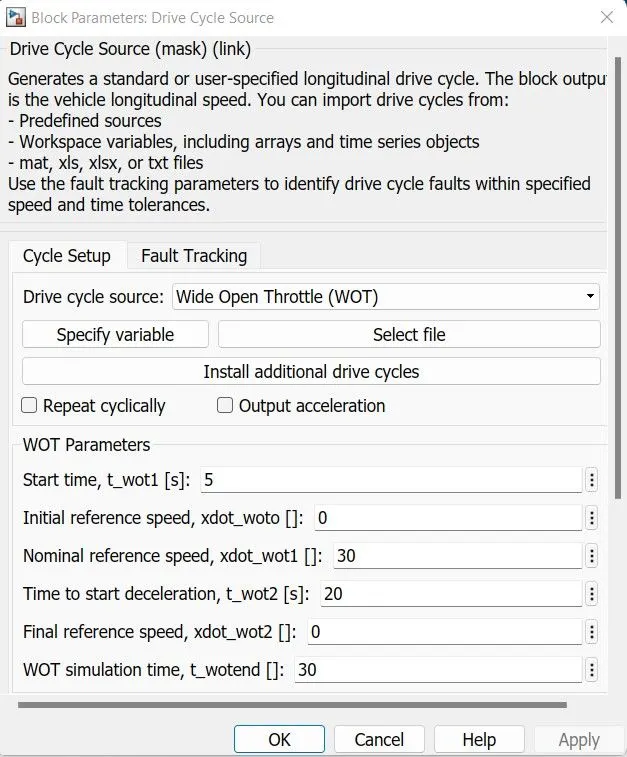
Changing from default parameters to WOT Drive cycle.
WOT parameters are changed, with a simulation time of 50 seconds
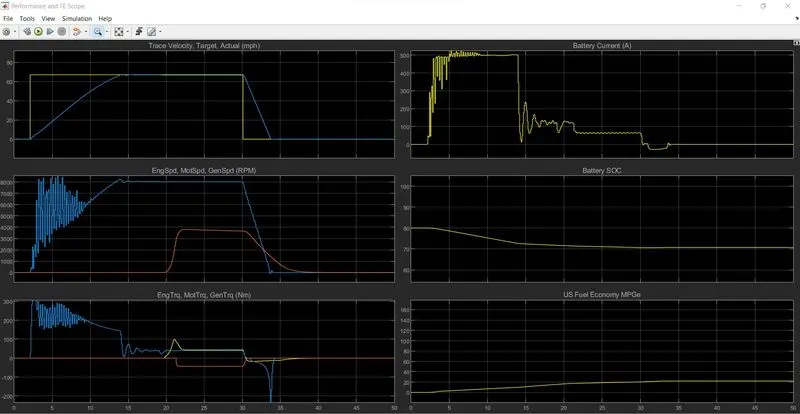
After running the simulation, with default environmental conditions, we get the below graph.
By changing the wind velocity and grade costants to 5, we get the below graph.
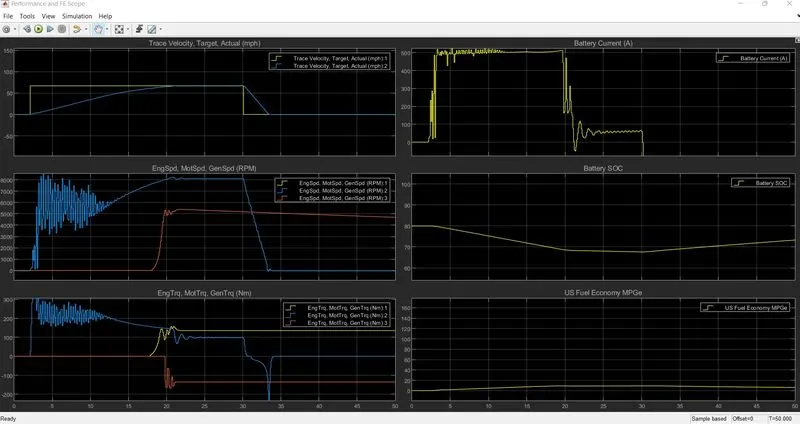
Trace velocity : Target vs Actual
Blue line indicates the speed at which the vehicle travels. The velocity increases gradually, and there is sudden downfall in the curve during the deceleration after 30 seconds.
Eng speed vs Motor Speed vs generator speed
Engine speed (Yellow) is overlapped with generator speed (Orange), since engine rotates the generator, they both run at the same speed. For motor indicated by blue line, is high at the starting region, when the battery power is more, when the SOC of battery goes below 70 %, motor speed decreases. Then the engine power is used to run the vehicle.
Torque comparison:
Motor torque is high until the vehicle starts running, then motor moves from constant torque region to constant power region. Then the motor produces a negative torque when there is decceleration.
Engine torque will start acting when the SOC goes below 70% and provides torque to run the vehicle.
Generator torque is constant when motor torque is acting and produces negative torque which inturn is used to charge the battery.
Battery current :
Battery current is high when the battery operates and becomes stable during charging mode.
Battery SOC:
State of charge decreases when the motor is running , and battery starts to charge when the SOC level hits below 70%.
US Fuel economy:
Fuel consumed is zero during motor torque region, and starts to consume when the engine starts to operate until the battery is fully charged. Then the cycle continous.
4. Hybrid Electric Vehicle Multimode Reference Application is taken as example 1.
Keeping the WOT parameters same for both HEV and EV
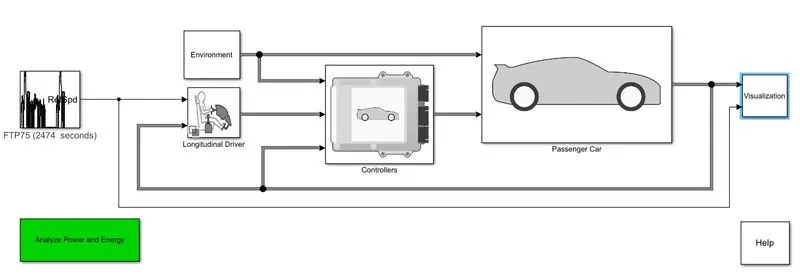
Simulation keeping the default parameters.
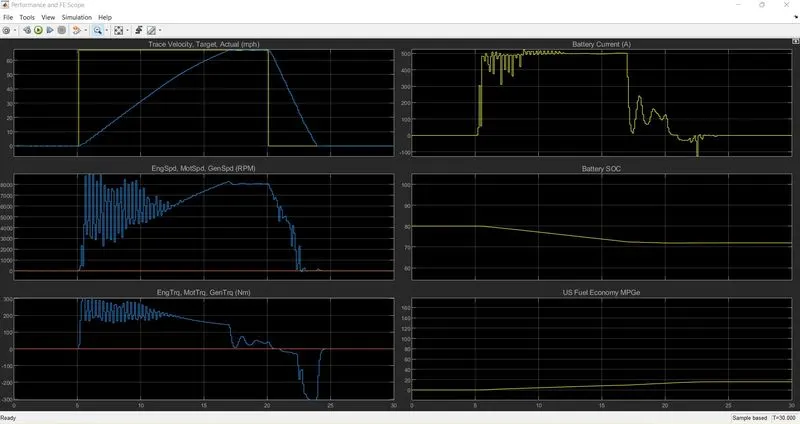
Electric Vehicle Reference Application is taken as example 2.
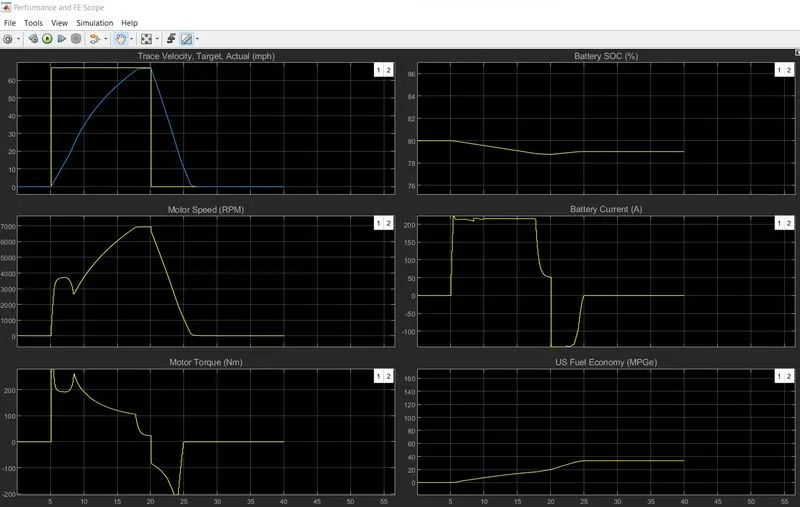
Comparing the two vehicles, most of the parameters remains the same.
Peak velocity is achieved a little faster in EV application as compared to HEV application.
EV battery SOC has an efficiency of 78% whereas for HEV battery SOC is around 70%
Fuel economy is higher for EV up to 40 MPG, whereas for HEV it is below 20 MPG.
To conclude EV characteristics generate a smooth curve because of less active components, for HEV too many fluctuation because of engine, generator, motor as moving components.