Week-4 Challenge WOT Condition Part-2
Week-4 Challenge
Aim: To study the vehicle models in the powertrain blockset.
i) Objective: To differentiate between mapped and dynamic models of engine, motor and generator. Also, to show how we can change the model type.
Solution:
| Mapped | Dynamic |
|
1)Implements a mapped model using ‘lookup tables’. |
Implements a model that takes values from all subsystems and generates instantaneous outputs. |
| 2) Steady state. | As the name suggests it’s dynamic and instantaneous. |
| 3)Takes less time for simulation as the inputs are steady state. | Takes more time as for simulation as inputs are dynamic. |
| 4) Accuracy of the results is less as the model deals with only the ‘macros’ of the system. | Results are more accurate as the model deals with the ‘micros’ of the system. |
Now, to change the model type we have two ways:
a) We can change the model type by going to the ‘Modeling’ section on the toolbar. In it go to the design section and find variant manager and click on it. Then go to the component for which you have to change the model and in it right click on the required model. From the menu select ‘Label Mode Active Choice’.


b) Simply go to the subsystem where both the models lie. Right click anywhere and a menu will appear. Go to variant -->Label Mode Active Choice --> Select the desired model.

ii) Objective: To find how the model calculates miles per gallon and which factors are considered to model fuel flow.
Solution:
So, to calculate the miles per gallon, the model has a subsystem in the visualisation subsystem called the performance calculations. Let’s open it and look at the execution of the equations involved. The first input is the vehicle speed (m/s) that is taken from the vehicle plant. Now this vehicle speed is integrated over time to get the distance travelled by the vehicle. We get the distance in metres, which has to be converted into miles. Hence, it is multiplied by the conversion factor of 0.000621371 to convert to miles.
As this is a Hybrid Electric Vehicle there are two power sources, one is the engine running on mineral oil (gasoline in our case) and the other is the battery. Hence, both sources contribute to the generation of the vehicle power. Now both these sources are distinct and the units of measurements of their outputs are also different. To get the outputs of the vehicle as a whole, we will have to convert the units of one into another. For this the United States Environmental Protection Agency came up with a conversion factor, MPGe. Miles per gallon gasoline equivalent (MPGe or MPGge) is a measure of the average distance traveled per unit of energy consumed. MPGe is used by the EPA to compare energy consumption of alternative fuel vehicles, plug-in electric vehicles and other advanced technology vehicles with the energy consumption of conventional internal combustion vehicles rated in miles per U.S. gallon. The MPGe metric was introduced in November 2010 by EPA in the Monroney sticker of the Nissan Leaf electric car and the Chevrolet Volt plug-in hybrid. The ratings are based on EPA's formula, in which 33.7 kWh (121 MJ) of electricity is equivalent to one (U.S.) gallon of gasoline, and the energy consumption of each vehicle during EPA's five standard drive cycle tests simulating varying driving conditions. All new cars and light-duty trucks sold in the U.S. are required to have this label showing the EPA's estimate of fuel economy of the vehicle.
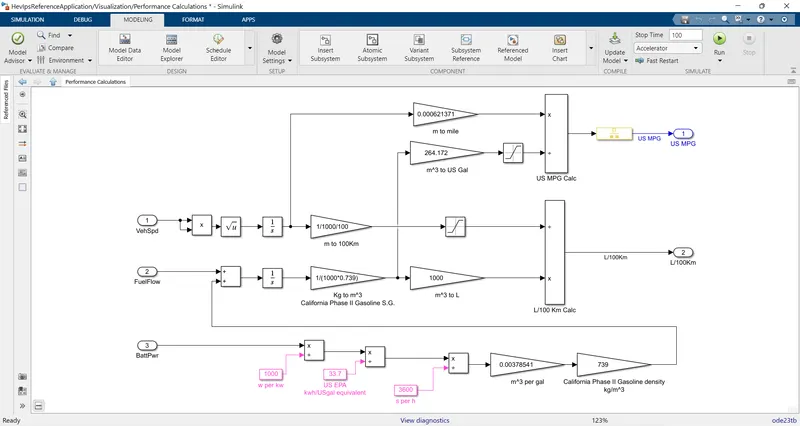
Let’s have a look at how this conversion is done in the battery. As we know, battery power is given in watts (W). This power is obtained from the DC-DC converter, which is connected to the battery source. Let us assume the power to be ‘x’. It is converted to kW by dividing it with 1000. So we have ‘x’ KW. Now the above conversion factor is brought into use to convert into Gallon equivalent(Gae) the discharge of the battery. Hence, after dividing the power with 33.7 we now have ‘x’ Gae/h. We require our discharge or flow to be at the rate of a second. We know that 1 hour equals 3600 seconds, hence dividing by 3600 and we have ‘x’ Gae/s of battery discharge. Further, we convert this flow into m3/s by multiplying with a factor of conversion of 0.00378541. Lastly, we convert this volume flow(m3/s) to mass flow(kg/s) by multiplying with the density of gasoline(in USA) i.e 739 kg/m3.
Now, this converted battery discharge is added to the engine fuel (gasoline) flow obtained from the engine block of the vehicle plant. Upon integrating this mass flow over time we get the mass of fuel. Again converting this mass to the volume by dividing with the density of gasoline. This volume of fuel is then converted to US gal by multiplying with a conversion factor of 264.172. The distance travelled by the vehicle (in miles) when divided by this quantity gives us the miles travelled by the vehicle per gallon of fuel.
The factors considered to model the fuel flow are- vehicle speed, fuel flow from the engine and the battery power.
iii) Objective: To run the HEV Reference Application with WOT drive cycle, change the grade, wind velocity in the environment block and comment on the results.
Solution:
Here we have to run the HEV Reference Application with the same drive cycle (Wide Open Throttle) but for different gradient and wind velocity conditions. Let’s have a look at these:
a) For Wide Open Throttle (WOT) with no or zero gradient or wind velocity.
So, for this we will first change the drive cycle to WOT which by default is the FTP cycle. After that, we will parameterise the cycle and change the nominal reference speed to 45 m/s, the time to start the deceleration to 65 seconds and the simulation time to 100 seconds as shown.
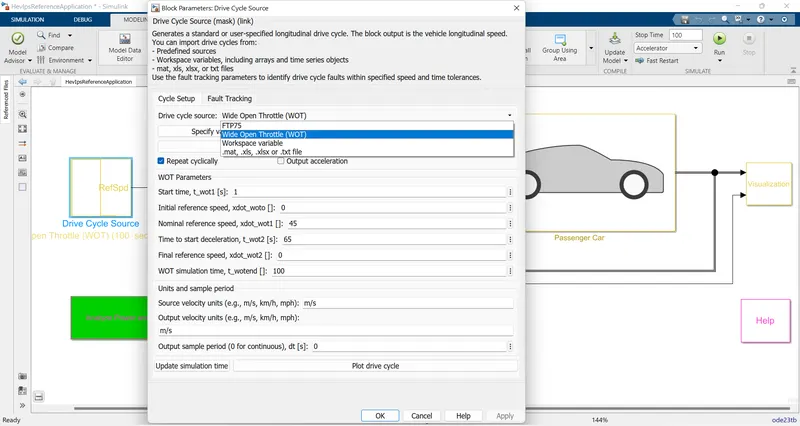
Without any other changes let’s simulate this model and see for the results.
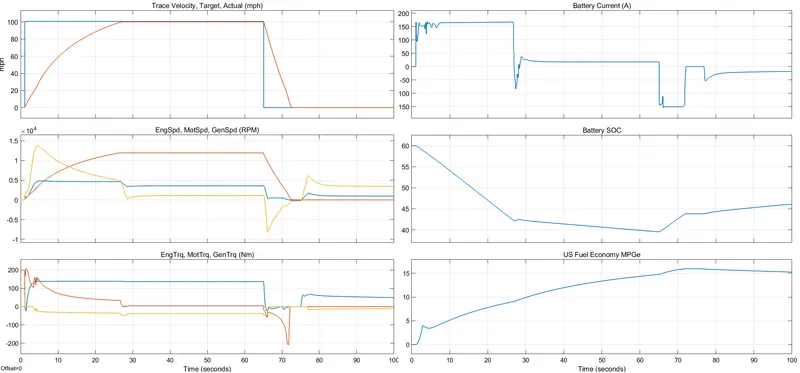
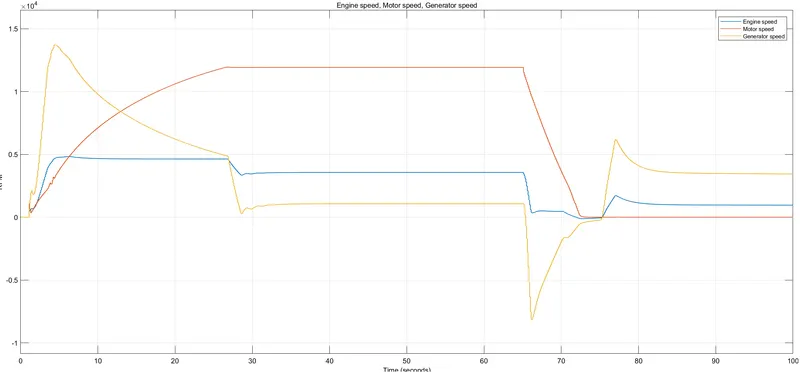
As can be seen, the speed of the vehicle rises constantly and reaches the peak of 100 mph after 26.91 seconds. The Engine speed rises rapidly, attains a maximum of 4825 rpm @ 6.3 seconds and stays around this region (lower than the maximum) until the deceleration begins. The motor speed on the other hand, rises gradually, attains a maximum of 11937.9 rpm @ 26.7 seconds and stays around this region until the start of deceleration. After deceleration, the motor speed goes down and reaches 0 and stays so after that unlike the engine which goes down at first and then rises again to rev at about the 4600 levels. This is so because the engine drives the generator which charges the battery. Hence, the State of Charge (SoC) increases during deceleration. The torque obtained from the engine rises rapidly and attains a maximum of 138.79 Nm in 6.3 s. The motor torque however rises sharply in the beginning to reach a maximum of 207 Nm @1.56 s. Hence, the motor satisfies the torque requirements of the vehicle with a larger share, at the beginning. However, the motor torque decreases gradually and the Engine takes charge. The MPGe also increases gradually and attains a maximum of 15.95.
b) For Wide Open Throttle (WOT) with gradient and velocity at 10 each.
Upon simulation the results obtained are as shown.
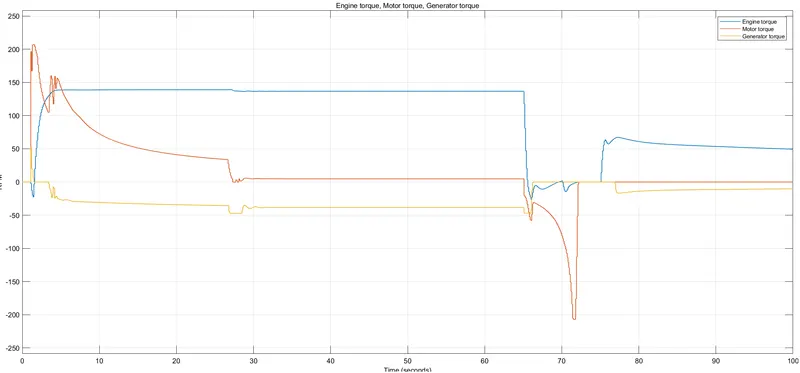
Here, things have changed a lot, as the vehicle has resistances in the form of gradient and wind velocity to oppose its motion. Here the vehicle could reach a maximum speed of 59.2 mph in 44.41 s. The engine speed rises a bit gradually now and attains a maximum of 4656 rpm after 10 s. The motor speed has a greater deflection as it reaches a maximum speed of just 7161.29 rpm in 45.5 s. The engine torque rises rapidly and attains a maximum of 139.86 @ 6.5 s. The motor torque rises even sharply and attains the maximum of 207 Nm in 1.67 s. The catch here is that, the motor after providing the initial torque doesn’t descend to zero now as it has to suffice the additional load requirements of the vehicle. Hence, the motor operates at lower speeds to fulfil the torque requirements. The battery SoC under these conditions also drops to below 20% as against the 45% in the above case. Hence, more work is done by the motor in this case. The MPGe also could reach a peak of 7.18 signifying a reduction in mileage of the vehicle.
iv) Objective: Keeping all other parameters same, compare the simulated results of hybrid and pure electric powertrains.
Solution:
The WOT conditions of the HEV have been discussed above. We will be taking only the no load condition into our consideration. So lets discuss and compare the EV with the above results.
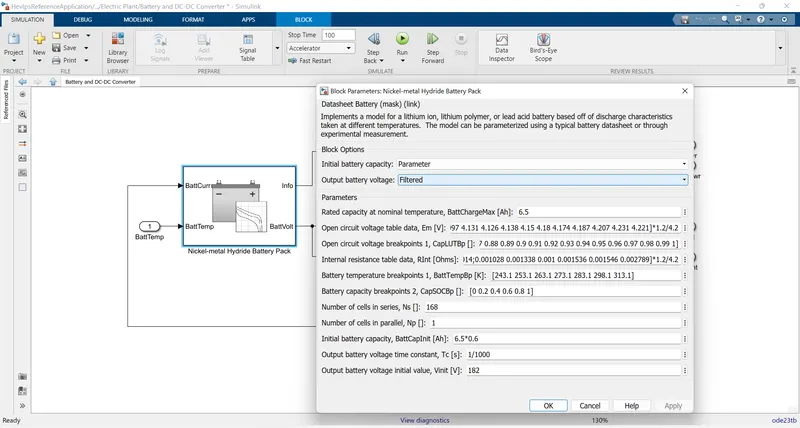

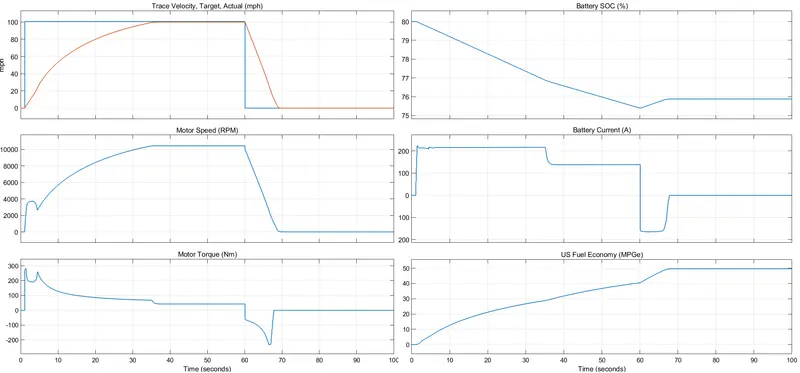
As can be seen the pure EV has only one source of power, the battery. The battery in the vehicle carries a capacity of 32.5 Ah while in the HEV it carries just 6.5 Ah. The initial state of charge in the EV is 26 Ah or 80% while in the HEV it is 60%. The vehicle in the pure EV model reaches the maximum speed after 36.82 seconds about 10 seconds later than the HEV because in the HEV there are two sources of power propelling the vehicle. The motor achieves a maximum speed of 10450 Nm @ 35.2 s and the maximum torque generated by the motor is 280 Nm @ 1.37 s. After this, the torque goes on decreasing and becomes constant at 42.6 Nm after 40.4 seconds. During deceleration, the motor turns into an alternator and recharges the battery. The SoC depreciation though is just 5% as the battery capacity here is greater. Also, the MPGe for the pure EV maximizes at 50.72 way above the HEV MPGe. This goes on to signify that the pure EV is efficient than the HEV.