Week-4 Challenge WOT Condition Part-2
Answer 1) Mapped and dynamic model of Engine, mortor and Genrator
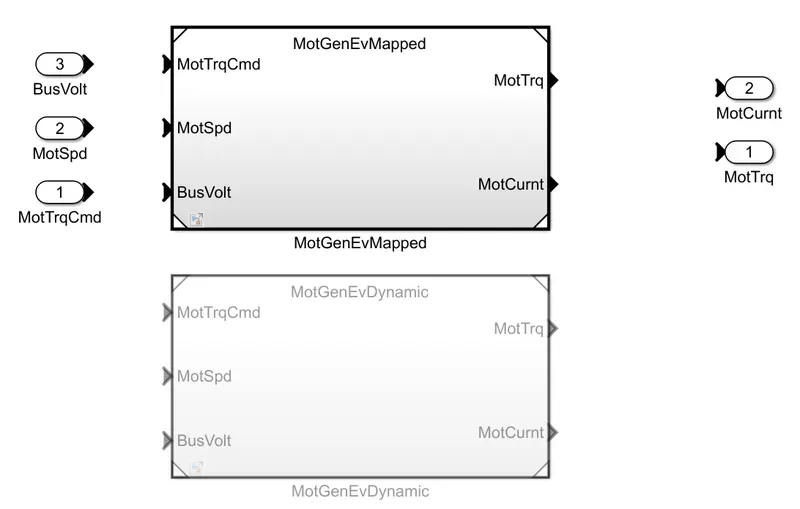
Mapped Model:-
- The mapped model is one type where the date points are pre_assigned in lookup tables.
- The engine or motor torque required is sensed and the motor or engine block generates the requiered torque out put just as required simply without considering the real time motor or engine, parameters.
- The output values are stored for the corresponding given input values of the enine motor and generator.
- The accuracy of this type is not that high but the simulation will be done in much less time as it does not run by real time parameters.
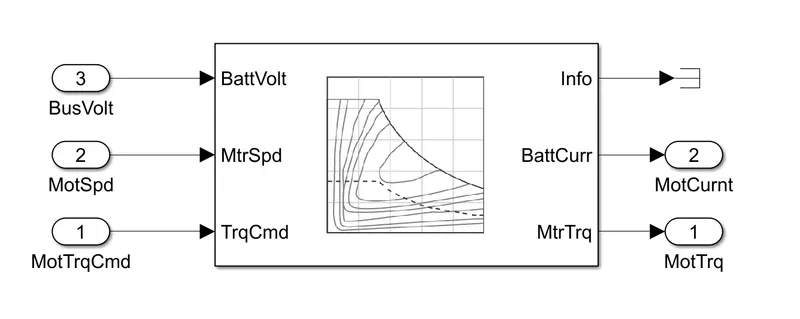
Dynamic Model:-
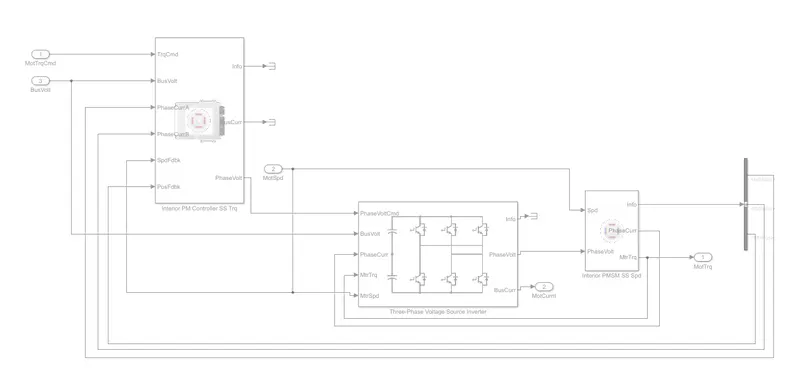
- The dynamic model in other hand uses the combinatio of the outputs from various subsystems to generate the output.
- It runs by real time simulation where the required input from the drive cycle is taken and for that indivicual real time simulation gets performed and summiing all the results of the subsystem gives the output for the simulation.
- As per the drive cycle requirements the intital bus voltage, current is given along with the vehicle feedback so that it runs the actual simulation at that particular moment through the drive cycle.
- The accuracy of this model is very high as it considers the real outputs form all the subsystem to gernerate the output.
- The simulation will take very long time to complete as it has so many individual simulations running by all the subsystme of the engine, motor/generator.
- The figure below shows the working phase of the dynamic model
Steps to selelct the Model type:-
1) In the powertrain blockset modeule we first need to select the vehicle type first wheather it is full electric, full engine or the type of hybrid vehicle.
2) After that the Simulink model appears by showing the work flow blocks of the model.
3)In that we need to go to passenger block Electric plant EV motor/Generator block.
4)After this just right click and go to Variance Label Mode Active choice MotorGenEV Mapped or Dyanamic.
Answer 2)
Miles per gallon
- Miles per Galon is a fuel economy rating determined by how far a car can travel on a gallon of petrol or Diesel for a Engine powered car.
- In case of an electric vehicle ti tells us the energy which is equivalent that of a engine powered car to propel the car through a distance.
- The amount of Fuel Energy required to move a engine powered car through a distance is determined and then it is compared to the equivalent amount of electric engergy required to move the car through the some distance and is expressed as the miles per gallon.
- The powertrain blockset has a model that calculates the miles per gallon for al kinds of vehicle.
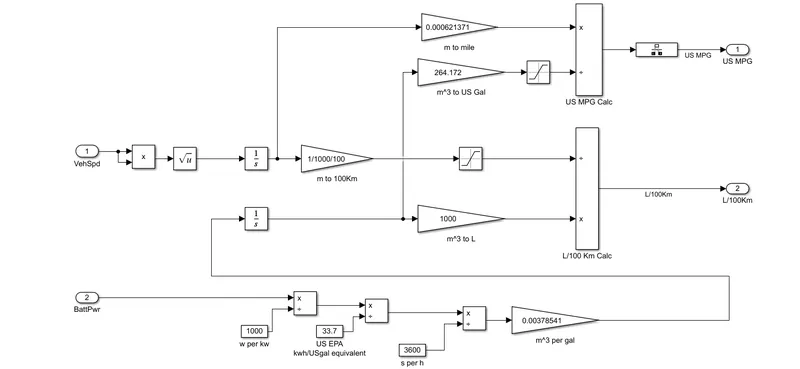
- The above model takes the input of the Vehicle speed, Fuel flow and Battery power to calculate the fuel consumption and the equivalent battery consumption and calculates the miles per gallon.
Vehicle Speed And Fuel Flow:
- The vehicle speed is a important factor while considering the fuel consumption at that particular time, so to determine the fuel consumption through out the drive cycle.
- To convert speed to Distance we can integrate with time and we are doing the same of converting the velocity to get distance covered by integrating.
- Then the fuel flow is expressed a sthe mass flow rate the amoutn of fuel at each moment in kg/sec. Now integrating this will result in the mass of the fuel and by using this 1 we convert it to the volume and by multiply by 1000 to get it in Litres.
- By comparing the two results we can get the amount of litre consumed to Run for 100 km
Battery Power:-
- The amount of Energy from battery power required to propel the vehicle Equivalent ot that of the Enine is calculated here.
- The battery power is given in watts and it is converted to kw by dividing with 1000.
- Then we convert the power into energy by multiplying with the time into kwh.
- Then we convert the Energy from kwh to equivalent energy in US gallon of automotive gasoline by dividing with 33.7. Since we get the energy in US Gallons equal in KWH we are trying to get the energy of equivalent LIS gallons per seconds and we do this by dividing with 3600 and we convert the hour to seconds.
- Then multiplying with 0.00378541 we convert the US gallons per sec to the volume of the fuel flow in and then we multiply with 739 mA3.s* kg.mA3 which gives the result as mass flow rate kg's/
- Then finally the Battery enery ewuivalent in kg/s given as a input for the fuel flow parameter in order to find the equivalent US Gallons energy and estimate the miles per gallons.
Calculating Miles Per Gallon:-
- Then the inputs from the vehcle speed the distance we found is taken into the calculation and it is converted to the miles by multiplying with 0.000621371.
- Then the inputs from fuel flow ( Battery energy+Fuel Energy) taken in mA3 is converted into equivalent US Gallons by multiplying with 264.172.
- Then the two inputs miles convered and equivalent US Gallon is futher divided and the result is got in Miles/Gallon.
Answer 3) Hybrid Electric vehicle:-
- A hybrid Electric Vehicle (HEV) is a type of hybrid type that combines a conventional internal combustion engine(ICE) system with an electric propulsion system
- The presence of the Electric powetrain is intended to achieve either better fuel economy than a conventioanl vehicle ro better performance.
- Example of HEV is Toyota Prius.
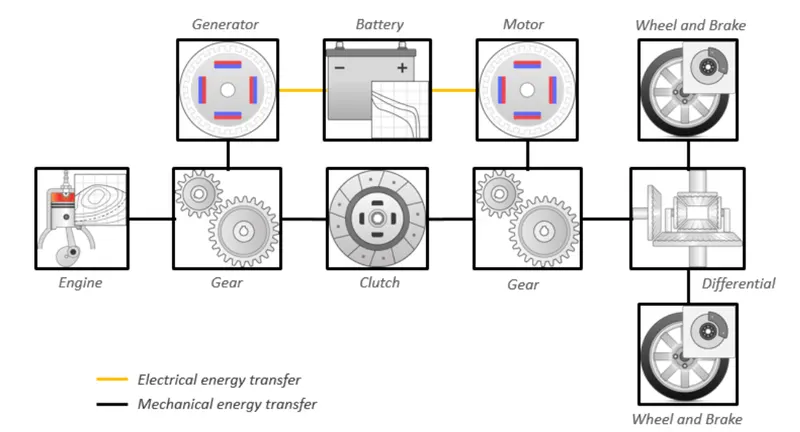
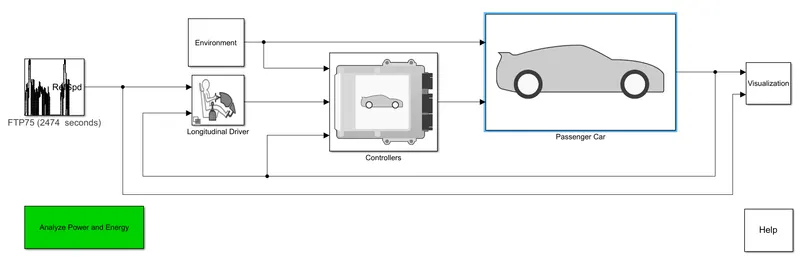
- In the powertrain blockset we have selected the hybrid electric vehicle and this is the simulink model.
- Here we can select the input parameters as we wish and we can Run the simulation to check the results.
Case 1
Simulation condition:-
The simulation is done for Hybrid electric Vehicle with Wide open Throttle Drive Cycle.
The Total Cycle time=100 sec..
The top speed of this cycle=67.1 mph
Time to start deceleration=50 sec
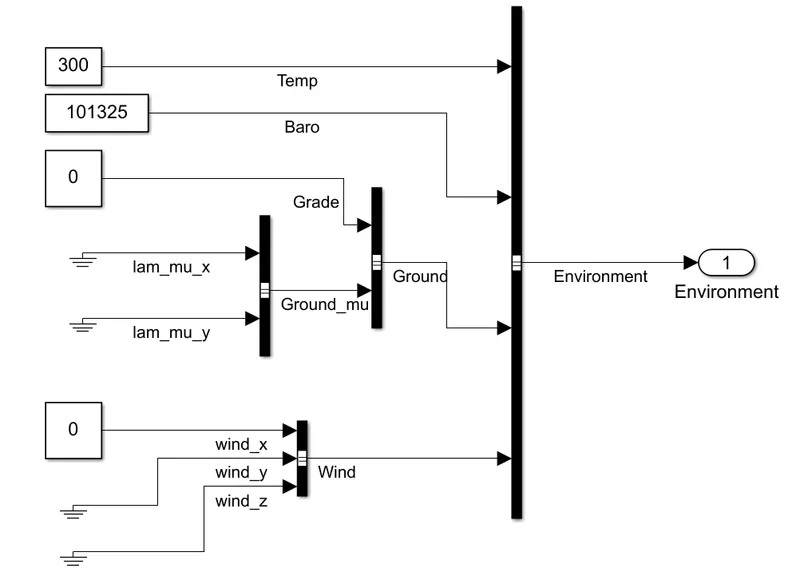
The Grade angle=0 degress
The Wind Velocity=0m/s
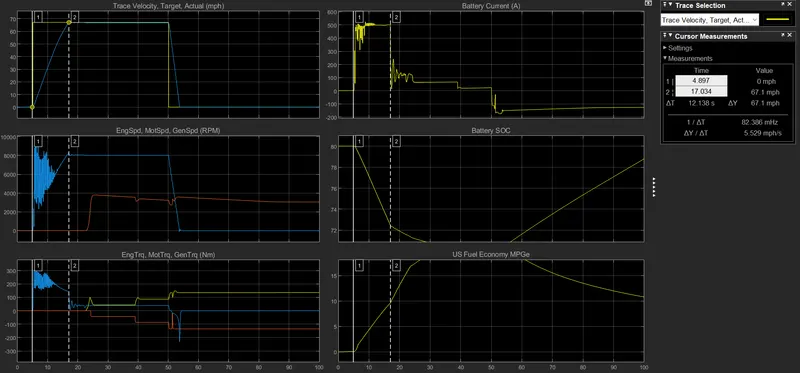
- The above figure shows the results for the simulation and there are totally six plots in them.
- Each plot shows a partivular result and the plots are made in such a way that there is a cursor measurement and if we change the cursor on one plot the cusor moves on the otherplots too which paves way to study the result in a better way.
- The cursor enables us to study the behaviour of other result parameters corresponding to the acceleration of the vehicle.
Plot 1
Show the velocity of the vehicle with respect to the Drive Cycle data with the Time scale on the x axis.
The acceleration time to reach 67.1 mph-12.138 seconds
The deacceleratio time from 67.1 to minimum=3.724 sec.
Plot 2
Shows the changes in speed of the Engine, motor and Generator in RPM thoughout the drive cycle.
Peak engine speed=4780RPM
Peak Motro Speed=8897RPM
Peak Generator speed=3690 RPM
Plot 3:
Shows the Torque charaterstics and its changes of engine, motor and generator in (Nm) thoughout the drive cycle.
Peak Engine torque=138.7Nm
Peak Motor Torque=206.7Nm
Peak Generator troque=42.2Nm
Plot 4
Shows the Battery current values(a) and its changes for various acceleratin inputs as per the Drive Cycle.
The peak current discharge from the battery = 163.5A
The peak current charging to the battery=-150.86A
Plot 5
Shows the Battery state of chage SOC(%) and its changes corresponding to the driving inputs. The state of charge decresed from 80% to 60% increased during normal condition and from 60% to 76% during regenerative braking.
Plot 6
Plot 6 shows the fuel economy
Maximum fuel econom is 20.45 MPG
Minimum fuel economy is 7.18 MPG
Case 2
Cycle time 100 sec
speed 80 mph
Grade angle 5
Wind velociy 5m/s
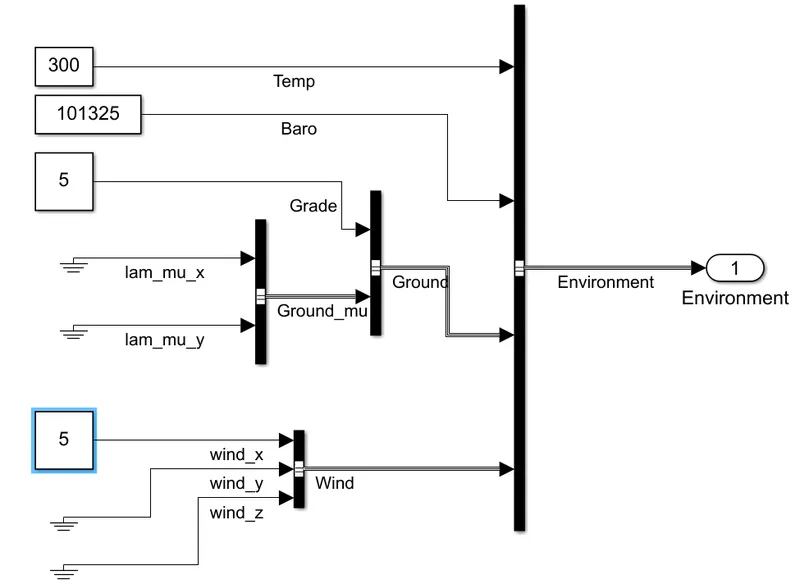
Shows the input values
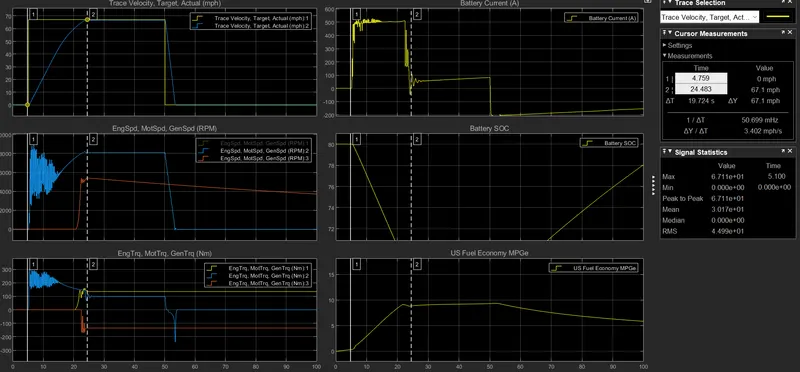
Shows the results with above specifications
Plot 1)
Maximum 67.1mph reached in 24 sec.
Maximum to minimum speed reached in 20 seconds
Plot 2)
Maximum motor speed in 5402 rpm
Plot 3)
Maximum motor torque is 280Nm
Plot 4)
Battery SOC for 80 to 75% in 50 sec.
Plot 5)
Battery current remains constant of 200amps
Plot 6)
Maximum fuel economy is 21 MPG
Answer 4) Keeping all toher parameters same, compare the simulated results of hybrid and pure electric powertrains.
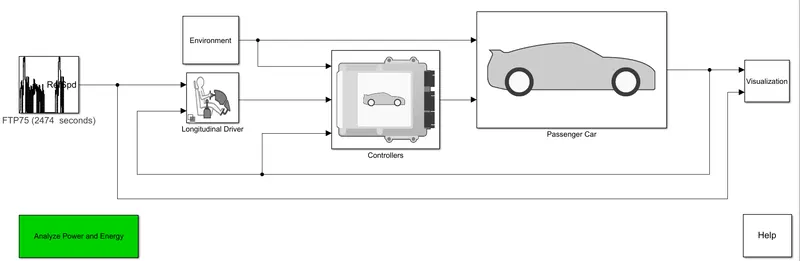
Shows the block diagram of pure electrical vechcle
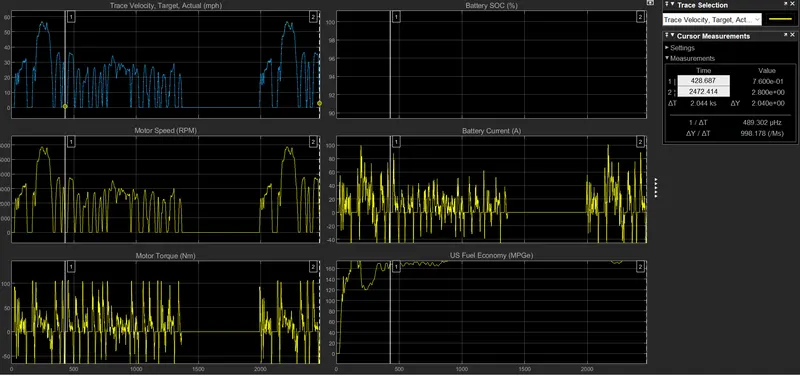
shows the results of pure electrical vehicle
Shows the block diagram of HEV
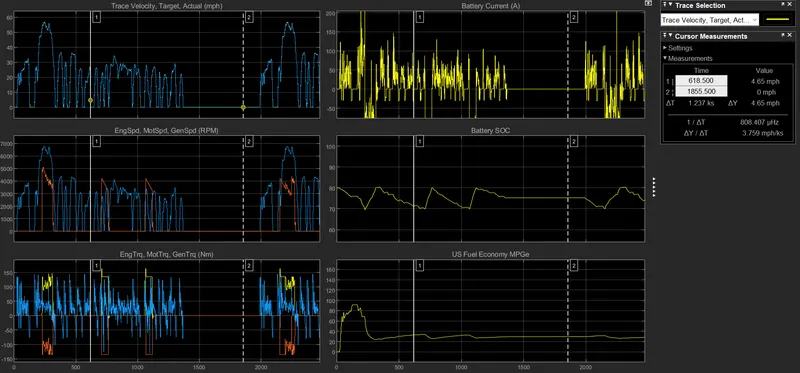
Shows the results for HEV
The difference between EV and HEV is for EV the source is only one i.e. electric source. where as for HEV there are two sources one is fuel and next one is electrical.