Week-4 Challenge WOT Condition Part-2
Q .1
What is the difference between mapped and dynamic model of engine , motor and generator ? how
can you change the model type .
Mapped engine : - Mapped engine is the default setting in power train blockset . it is used to measure to measure
Performance parameter of the vehicle by using standard lookup tables which are prefed to the system .this type of
Modelling is less accurate ,the lookup tables values based on values of brake torque , commanded torque of engine
Speed . if any other parameter like input engine tempreture is selected than lookup table values are also function of the
Tempreture parameter . the data extracted from lookup tables are . air mass flow fuel flow , emission data , exaust
Temprerure and efficiency . this data is used to find out other parameter which are needed by the end user .
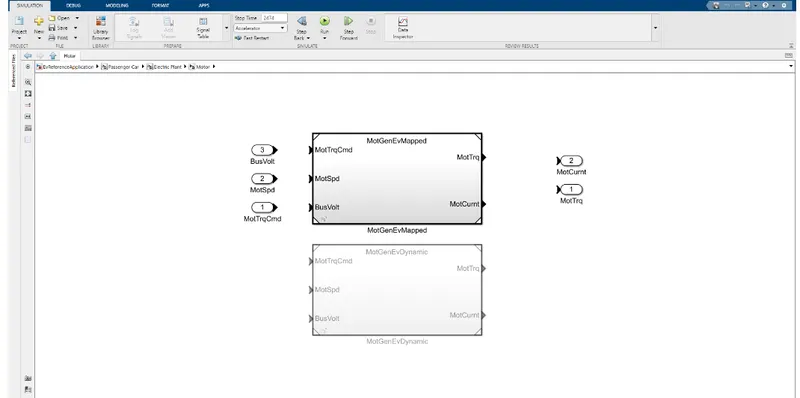
Dynamic engine : - This type of model used real time data fed by the user at run time for modelling . this type of
Model is used when the subsystem of a vehicle is required . we can calculate . brake torque , fuel flow , port gas mass
flow , exaust tempreture mass flow rate of exaust emission .
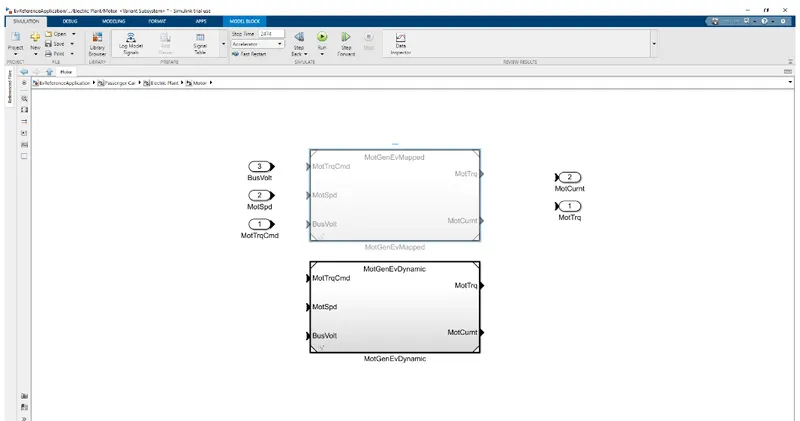
Mapped Generator - The mapped generator block is also similar like other blocks . most of the data required is taken
From lookup tables corresponding to the given input parameter . its simulation is less .
Dynamic Generator - The dynamic generators are involved user entering the parameters manually during the run time
for their particular application . The result take time and are more accurate .
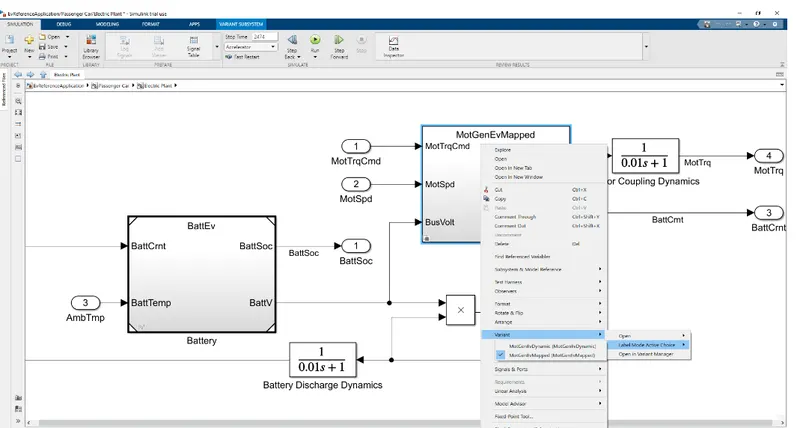
- To change the model from mapped to dynamic : -
Q .2 How does the model calculate miles per gallon ? which factors are considerd to model fuel flow ?
Ans. Miles per gallon (mpg) . however fuel efficiency for hybrid electric vehicles is calculated via miles per
gallon equivalent (pge) , mpg is the number of miles your car can drive per gallon of gas . figuring out an
mpge is the number of rating is a little more complicated . since engines that can use an alternatives source
Of fuel cant be measured by liquid gallons of fuel , the mpge rating is calculated by figuring out the number
Miles a vehicle can go using the same energy as gallon of gas , the epa calculated that 33.7 killowatt hours
of electricity is equivalent to one gallon of gas .
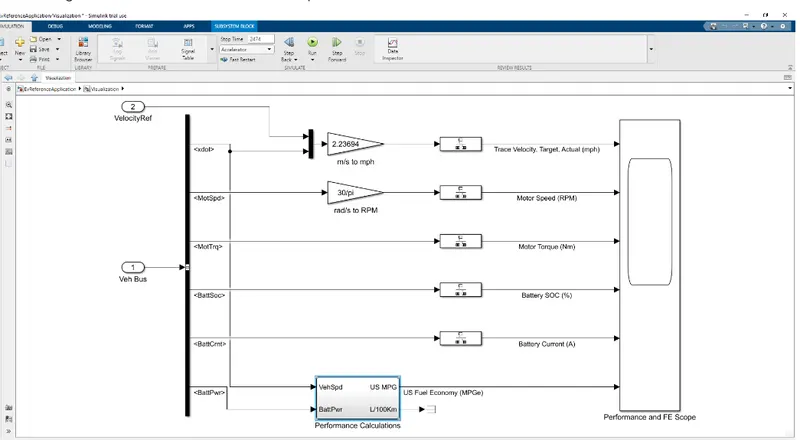
We should go inside ev reference block that is performed calculation .
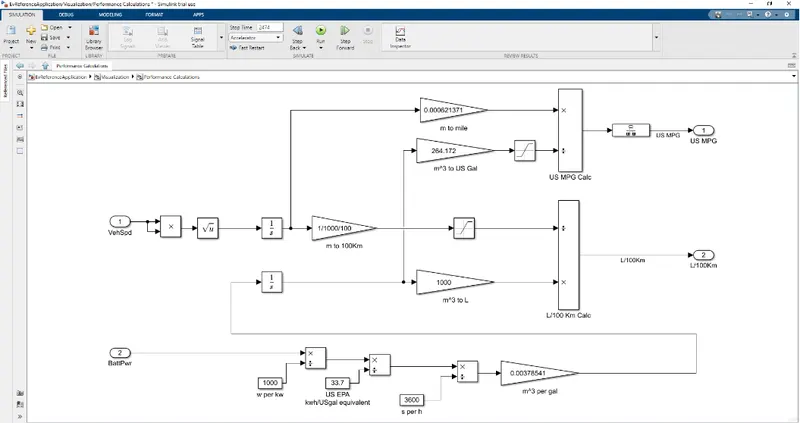
Here , three diffrent inputs are taken into consideration .
1. Vehicle speed
2. Fuel Battery
3. Battery Power
- The vehicle speed inputs is in m/s which is converted in to miles by multiplying with 0.000621371 similarly ,
The killogram of fuel is converted in to miles by multiplying with (1/1000*0.739) .
This cubic meter value is then converted in to gallons by multiplying it with 264.172 . the mile value and gallon value
Is used to find mpg of the vehicle .
Now the battery value is initialy converted from watts to kwh by dividing with 1000 and then to gallon equivalent
by again dividing it with 33.7 ( since 33.7kwh = 1 gallon ).
Then divide value by 3600 to get in per second and multiply by 0.0037854 in to get the value in cubic meter per gallons .
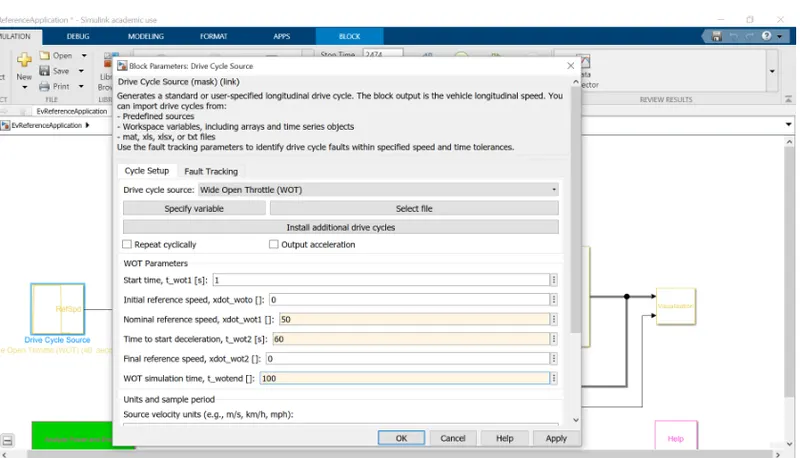
Run the HEV reference Application with WOT drive cycle . change the grade and wind velocity in environment block
- Comment on the results :
-
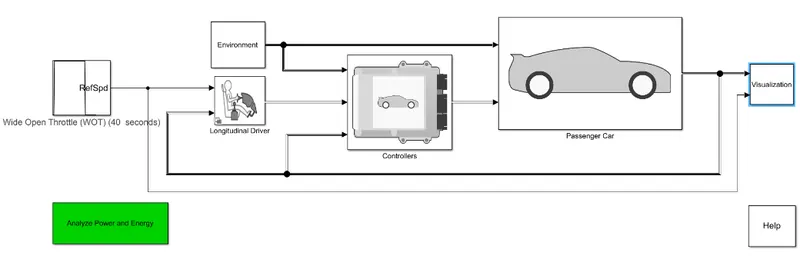
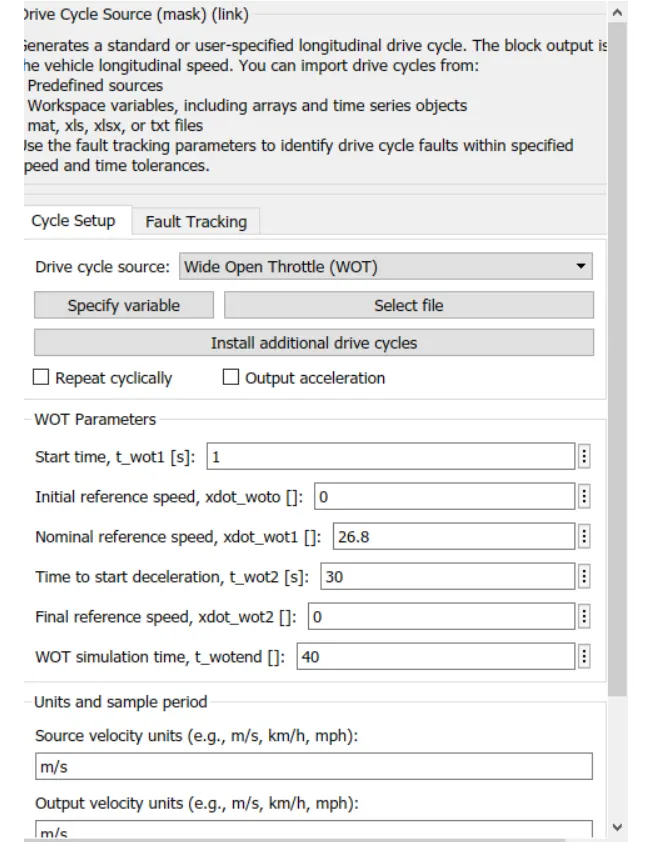
- Here we have changed drive cycle to WOT with a sample time 40 seconds .
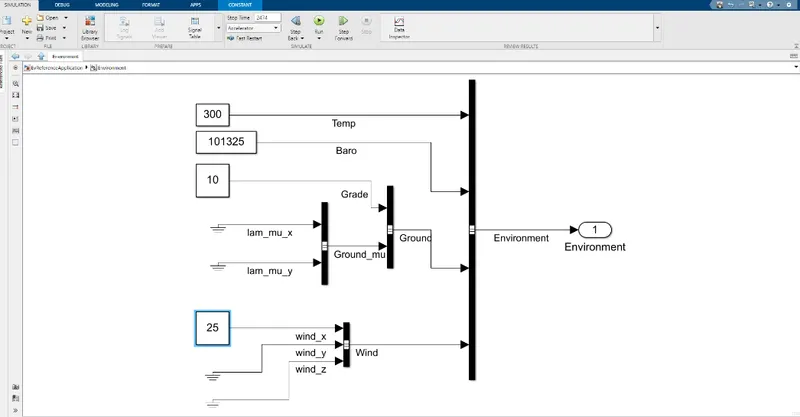
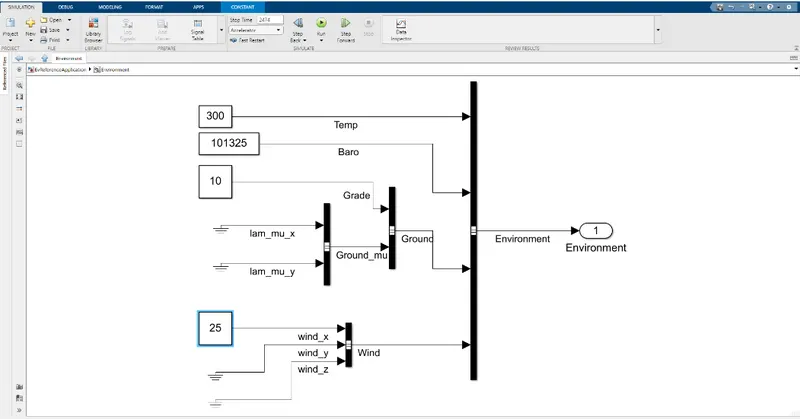
We have also alterd environment block and changed to 25 m/s & grade to 10 .
Environment Block :
Results :
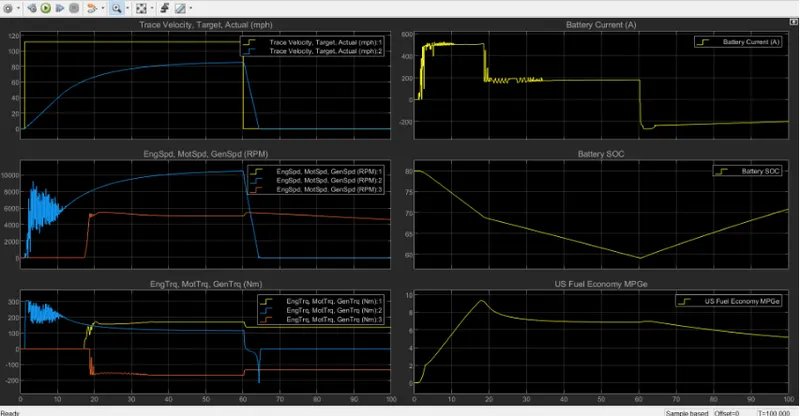
From above graph we can see that ,
Trace velocity target and actual graph : the yellow indicate the desired path and the blue line actual path
So that it can be seen that battery power is not enough to meet the requirement of the grade and wind velocity
Battery current graph : when vehicle is accelerating the battery current is also increasing , when the velocity is
Constant the current requirement is also becomes constant .
We the deacceleration starts the battery currents becomes negative indicating regenerative braking .
Battery SOC : The battery SOC keeps on depleting untill regenerative braking starts .this increase is the SOC
Engine motor and generator Torque : Motor torque is high intially (blue line) and then engine kicks in at a later stage
(yellow line) Generator torque (red line) is negative as its charging the battery .
Q.4 Keeping all the parameter same , compare the simulated results of hybrid and pure electric powertrains .
Ans: Now the EV with WOT drivecycles , wind velocity as 5 m/s , grade as 5 degree and keeping the rest of the parameter
same as above HEV case .
Results :
We get following performance graphs :
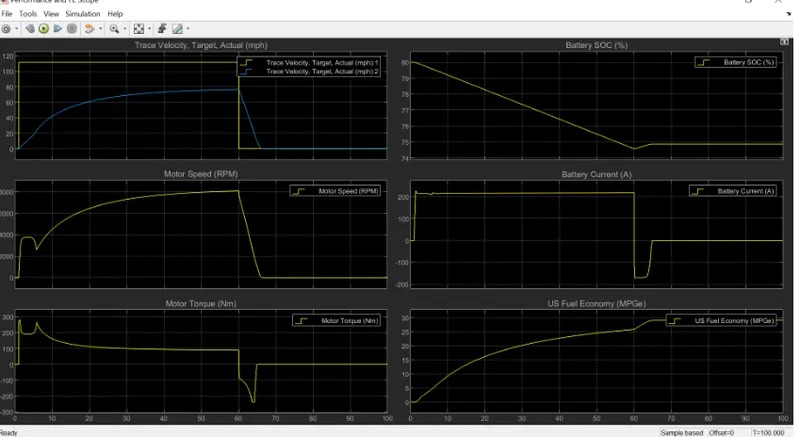
After comparing the graph of above of both EV and HEV following conclusion can be drawn :
1. The first graph ( Torque and actual velocity graph ) performance is almost same . the reason could be that in
that region only motor was operating so the performance in both EV and HEV similar .
2 . The battery current drawn by HEV intially is upto 500A and later decreases to 200A , This can be attributed to
The fact that initially only motor takes all the loads and later engine kicks in so motor load drops thus current
Drawn by motor reduces . And during the deacceleration it is seen that negative current (regenrative braking)
flow for longer time in HEV as compared to EV . so we can say that regenerative braking ,more aggresive in HEV
3 . SOC improvement of almost 15% is seen in HEV during deaccelerion and only 2% improvement can be seen
in EV during decelertion . This can be understood by the same reason explained in point 2 .
4. Motor torque and motor speed are stable in EV and they keep fluctuating a lot in HEV during the starting , also
The peak RPM of the motor in EV is less than HEV . These diffrence can be attributed to the fact of that battery
Power of EV is more than HEV .
5 . Fuel economy of EV is significantly greater than HEV . This is beacause electric motor is more efficient than engine..