Week-4 Challenge WOT Condition Part-2
Answer #1
Aim:
To Differentiate Mapped and Dynamic model of Engine, Motor and Generator in the EV reference model, and change the Mapped to Dynamic type.
Mapped engine:
Mapped engine is the default setting in powertrain block set. It is used to measures the performance of the vehicle by using standard lookup tables which are preferred by the system. The Mapped CI Engine block implements a mapped compression-ignition (CI) engine model using power, air mass flow, fuel flow, exhaust temperature, efficiency, and emission performance lookup tables. You can use the block for Hardware in the loop (HIL) engine control design, vehicle level fuel economy and performance simulations, The lookup tables developed with the Model Based Calibration Toolbox, are functions of injected fuel mass (F), engine torque (T), engine speed (N), and engine temperature (Temp Eng).
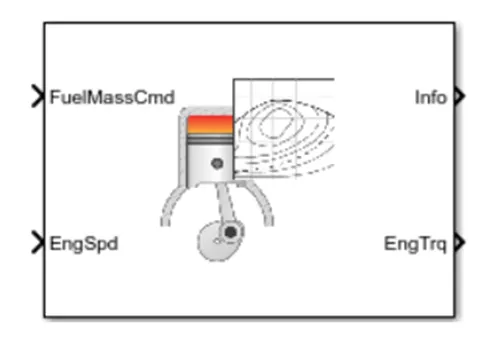
Fig 1.1
The block enables you to specify lookup tables for these engine characteristics:
- Power
- Air
- Fuel
- Temperature
- Efficiency
- Hydrocarbon (HC) emissions
- Carbon monoxide (CO) emissions
- Nitric oxide and nitrogen dioxide (NOx) emissions
- Carbon dioxide (CO2) emissions
- Particulate matter (PM) emissions
Dynamic Engine
This type of model uses real time data fed by the user at the running time of the model. This model is more accurate than mapped engine model. This type of model is used when the data of subsystem of a vehicle is required. We can calculate Break torque, fuel flow, port gas mass flow, exhaust temperature, exhaust mass flow rate and exhaust emissions.
Mapped Motor:
The Mapped Motor block implements mapped motor and drive electronics operating in torque-control mode. The output torque tracks the torque reference demand and includes a motor-response and drive-response time constant. Use the block for fast system-level simulations when you do not know detailed motor parameters, for example, for motor power and torque trade off studies. The block assumes that the speed fluctuations due to mechanical load do not affect the motor torque tracking.
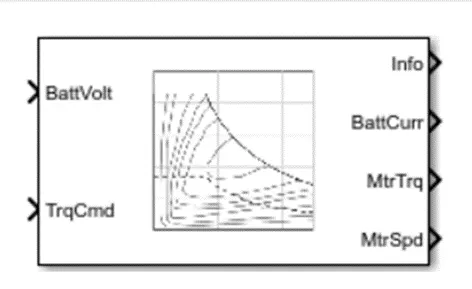
Fig 1.2
Dynamic Motor:
In the dynamic motor is like a three phase permanent magnet synchronous motor used as the model, This type model has the three phase input with the control of each phase current and voltage separately, for allowing to control the motor speed and torque. This block was used in the simulation the programmer must know the parameters are to be used in that simulation.
Mapped Generator:
Basically, the mapped generator block is also have the pre determined data that most of the data is taken from the lookup tables corresponding to the required input and output data it has been compiled during simulation time.
Dynamic Generator:
The dynamic generator block all the input parameters that has to be entered manually during the simulation time, this kind of simulation result is more accurate because the user has enter the required exact data.
Change the Model Type:
If we wish to change the Dynamic or Mapped characteristics we just move on “Modelling Variant Manager” as on fig 1.3.
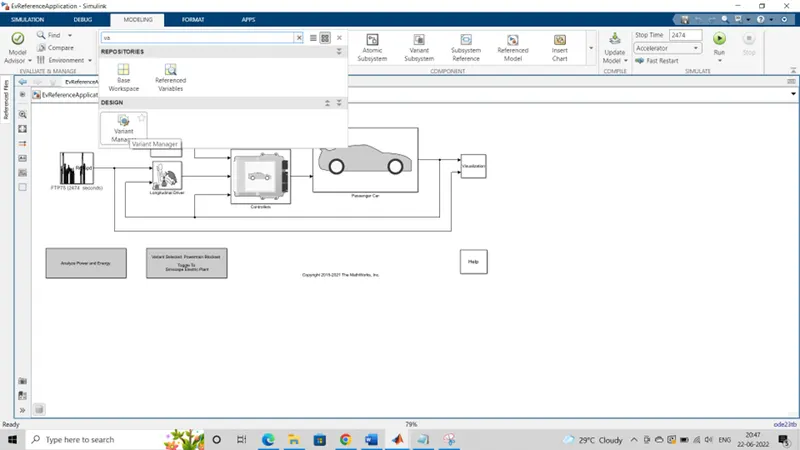
Fig 1.3
In the variant manager window shows in Fig 1.4, we can change the model by Right clicking the required type and Select the option “Set as Label mode Active Choice” and hit the Active button in the left side, the changes will be reflect on your model.
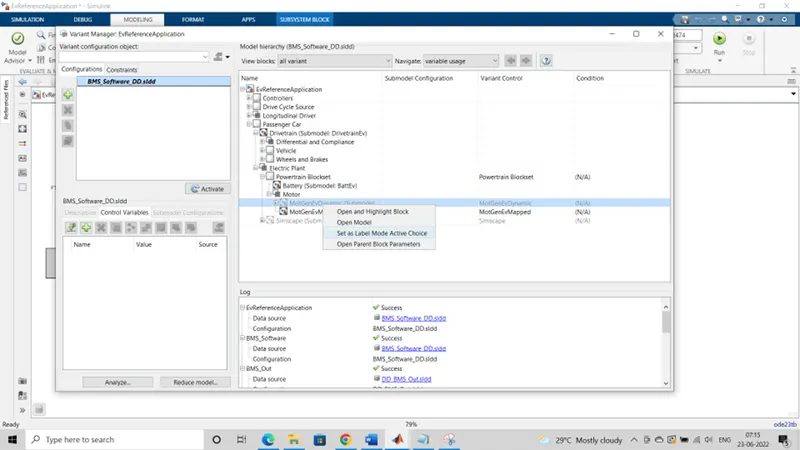
Fig 1.4
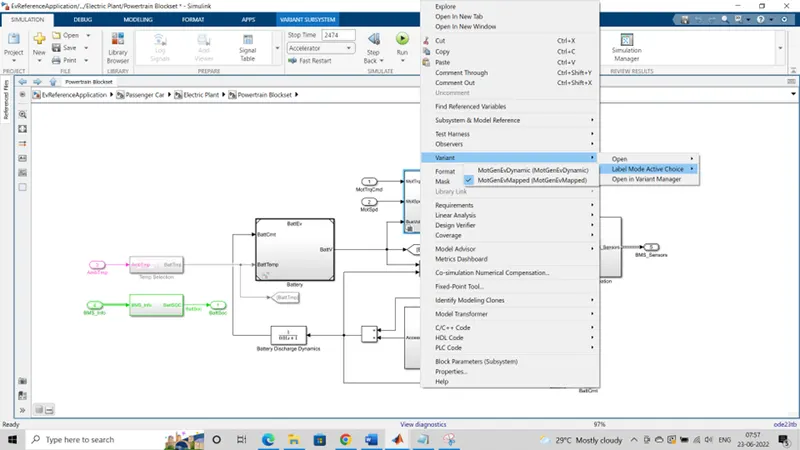
Fig 1.5 shows the another way to change the Mapped and Dynamic variant of Engine, Motor and Generator. Just go deep into sub models and right click model that you have to change, the go to VariantàLabel Mode Active Choice à Select Dynamic or Mapped as per your wish.
Answer #2
Aim:
To find How the model calculate miles per gallon, and which factors are considered to model fuel flow..
Fuel Economy Calculation Basics:
How to Calculate Miles per Gallon or Kilo-meters per Litter
When you calculate miles/gallon (mpg) or kilo meters/litter (km/l) you are calculating fuel economy in terms of distance per unit volume or distance/volume. The following outline is generally applicable to both calculations. When you calculate litters per 100 kilo meters (l/100km) you are calculating volume per 100 units of distance.
If you track your gas usage you can evaluate your vehicle's fuel economy. This is how to calculate your mpg or your km/l yourself.
- Fill up your tank with fuel before you start a long trip or the block of time you want to track. For example, you may just want to track your weekly gas usage.
- Record the trip starting odometer reading at the time you fill up.
- At the end of your trip or week, fill up your tank again.
- Record the number of gallons or litters required to fill the tank once again. This is the total number of gallons or litters you used for the trip (or the time period).
- Record the trip ending odometer reading (this might also be the starting reading for your next trip).
- 4. Calculate your actual miles or kilo meters
- Ending Odometer Reading minus Starting Odometer Reading equals miles or kilo meters travelled
- End - Start = Miles or Kilo meters travelled
- 5.Calculate your rate of gas usage ( mpg or km/l )
- Miles driven ÷ gallons used = miles per gallon = mpg
- Kilo meters driven ÷ litters used = kilo meters per litter = km/l
mpg = miles per gallon
mpg US = miles per United States gallon
mpg Imp = miles per Imperial gallon
km/l = kilo meters per litter
l/100km = litters per 100 kilo meters
Now come to our EV reference module, we have use a Performance calculation block to find out the fuel economy of the over all driving system.
The internal construction of Performance calculation was show in the Fig 2.1
The following factors that we have used for vehicle performance calculation,
1.Vehicle Speed
2.Battery power that has to be taken for charging
US EPA KWH/US gal Equivalent
US mpg calculations and L/ 100KM
This is an EV model so that we consider only Speed of the vehicle and Electrical power for charging the battery, here fuel flow is not applicable.
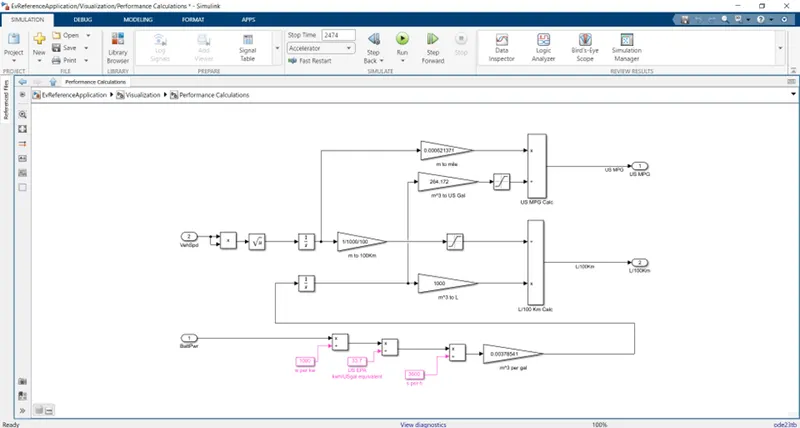
Fig 2.1
Answer #3
Aim:
To Run the HEV reference application with WOT drive cycle. Change the grade and wind velocity in the environment block.
Fig 3.1 Show the HEV Reference Application.
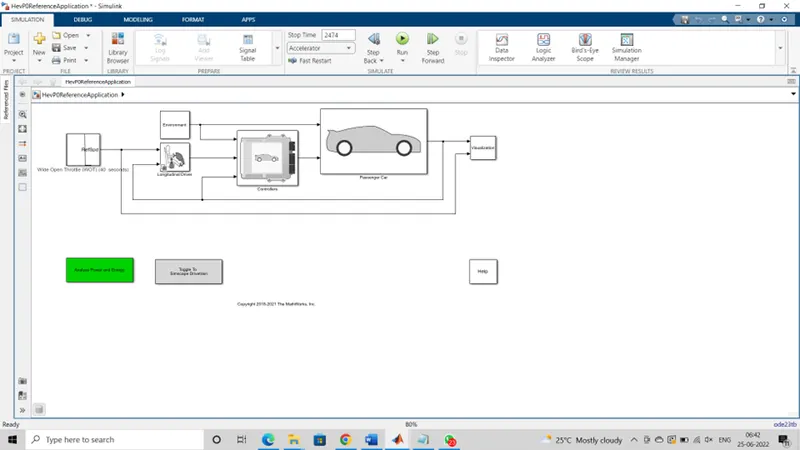
Fig 3.1
The Fig 3.2 shows the Driving cycle change reference, now we change the default driving cycle to WOT wide open throttle cycle as per the given request, kept all the default values remains same.
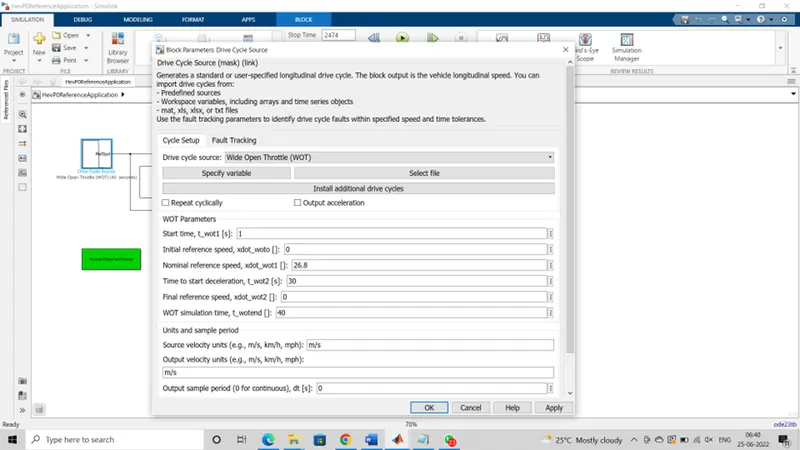
Fig 3.2
The Fig 3.3 shows the environmental block with changed values of wind and grade.
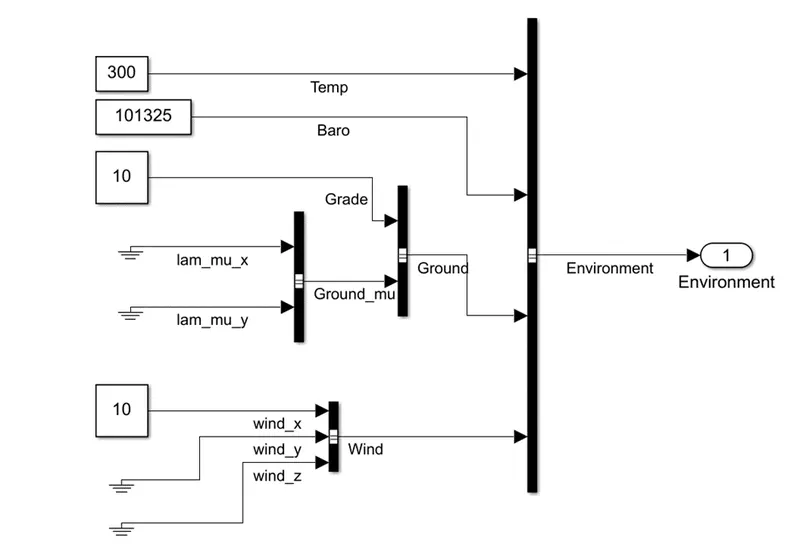
Fig 3.3
1. Trace velocity target and actual graph: The yellow line indicates the desired path and the blue line is the actual path, so the battery power is not sufficient to the requirements.
2. Engine speed and Motor speed graph: Motor speed was varied as per the driving cycle same as the engine speed gradually increased and remain same during the Hybrid mode of WOT condition
3. Engine torque and Motor Torque graph: If The Motor power is not sufficient for traction then the engine will on and produce the torque same time the SOC will considered and the engine share the power to charge the battery even though the SOC get sufficient charge the motor will comes to traction.
4. Battery current: When the SOC is required level the motor is takes place of traction at the point of 16 and 30 the battery gets charge through the engine power.
5. SOC charge curve shows the gradual decrease of charge at the point 16 and 30sec it has charged.
6. US fuel economy MPGe shows the improvements in the fuel usage.
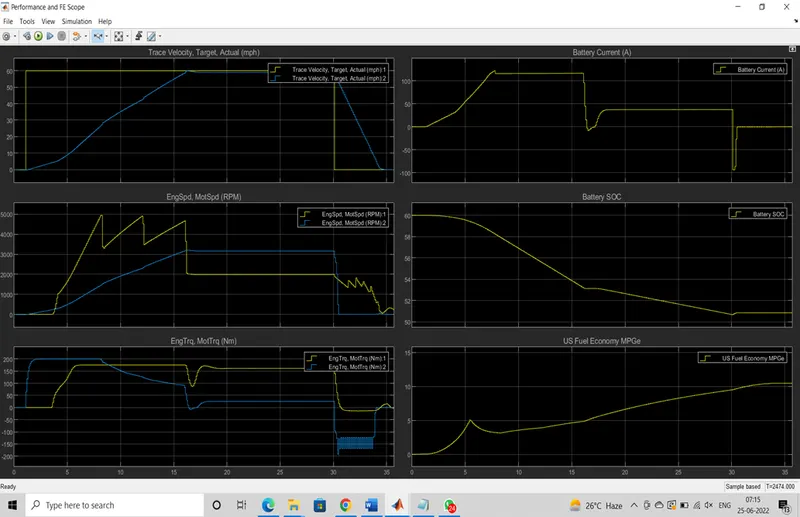
Fig 3.4
Answer #4
Aim:
To Keeping all other parameters same, compare the simulated results of hybrid and pure electric powertrains.
Fig 4.1 Shows the Pure EV powertrain setup with the all default parameters.
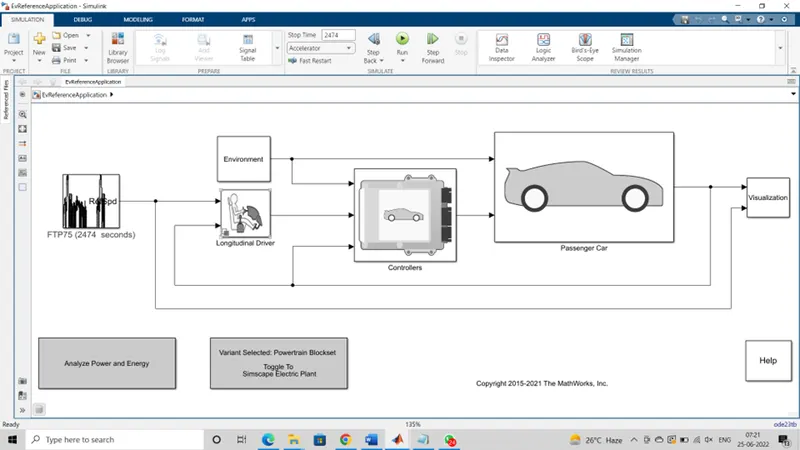
Fig 4.1
Fig 4.2 Shows the Hybrid EV powertrain setup with the all default parameters.
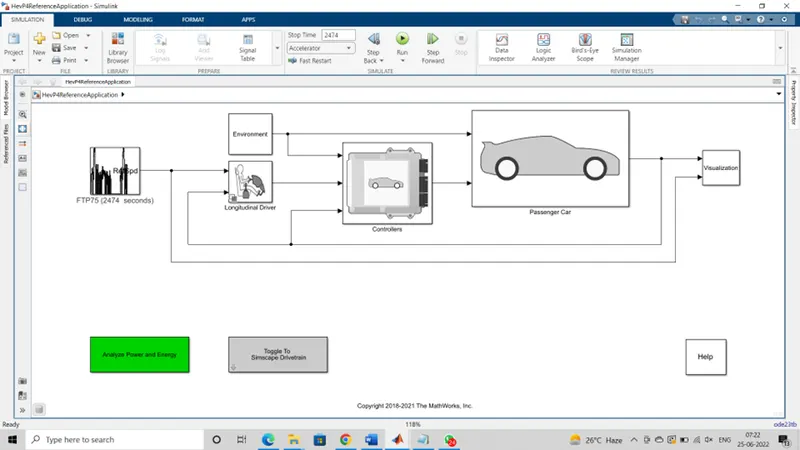
Fig 4.2
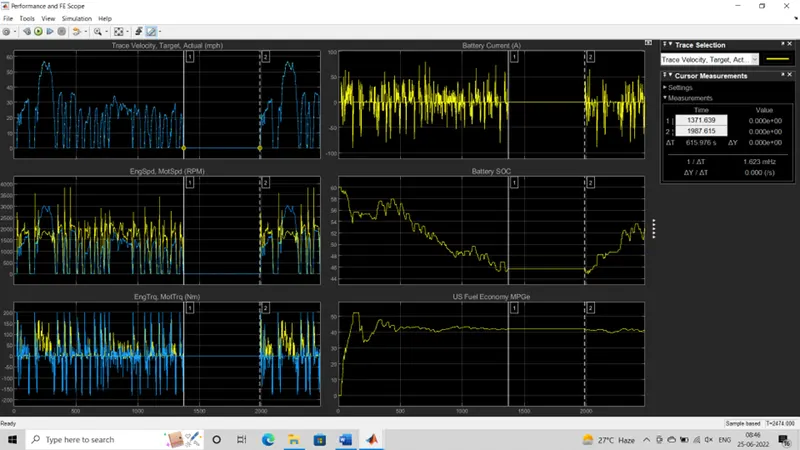
Fig 4.3
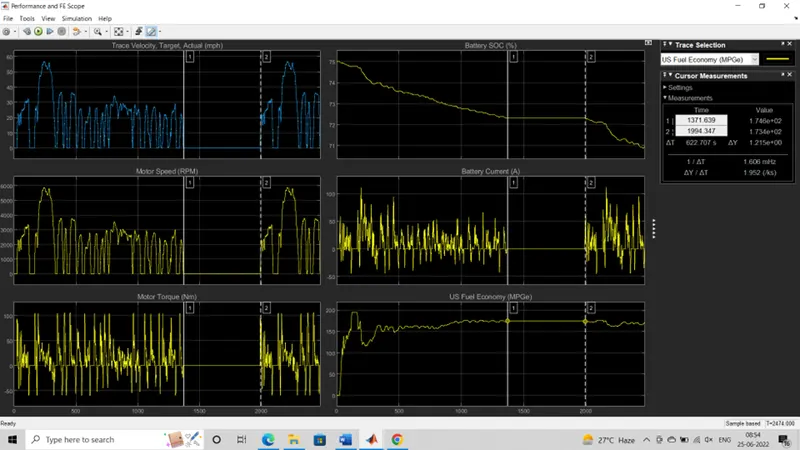
Fig 4.4
Fig 4.3 shows the Output of the HEV and Fig 4.4 shows the Pure EV output.
- The Torque velocity, Target , Actual plot shows the original driving cycle both HEV and EV are same.
- Speed : The motor speed of the EV is same as the driving cycle, but in HEV the motor and also the engine speed is varied based on the traction and SOC of PSS also considered in driving cycle.
- Torque : In EV the motor only play the role of traction, but in HEV at starting use he motor torque and if additional requirement is need the engine will support the taction same time the remaining power of the engine use to charge PSS at that time engine speed and torque will increased base on the PSS requirements.
- Battery current : In EV the battery current is in positive curve when ever the traction is takes place, when the braking takes place that time battery current is negative because the regenerative breaking will charge the PSS, but in HEV the battery has charge during breaking as well as the engine on time also.
- SOC curve: in EV the SOC is reduced gradually small improvement only gets while regenerative brake time only but in HEV the SOC of PSS gets increased were ever the engine in free mode.
- US fuel economy MPGe of EV is higher then the HEV as shown of the plot, because the EV we have charge the PSS separately it may be produced by non-conventional energy sources like Wind and Solar. But in the case of HEV we use conventional energy source to charge the PSS during vehicle running time so the MPGe is low in the HEV.
Conclusion:
- Difference between the mapped and dynamic model of engine, motor and generator has explained and it was changed in the model.
- Miles per gallon calculation explained and the factors are considered in the model also.
- HEV reference application with WOT drive cycle has done, Then Changed the grade and wind velocity in the environment block and it’s output was explained.
- Keep the All parameters are same compare the simulated results of hybrid and pure electric powertrains has explained.