Week-4 Challenge WOT Condition Part-2
1. Difference between mapped and dynamic model of engine, motor and generator :
Mapped Model:
The mapped uses a steady- state lookup to charcterize the engine and generator performance. it is generally used for the quasi- steady-state simulations.
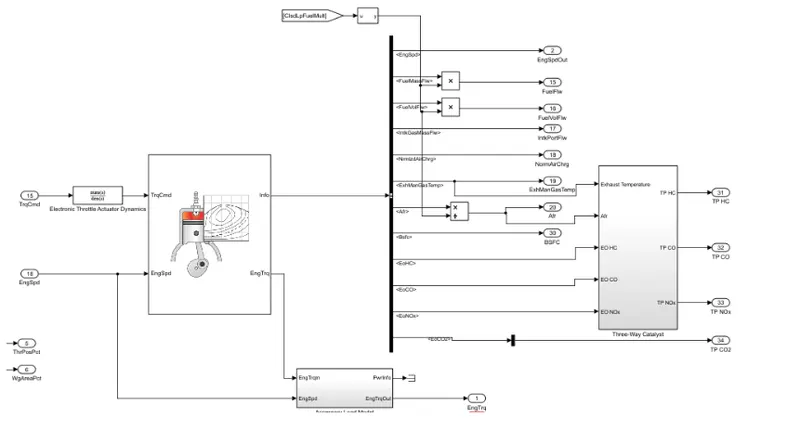
here the above example for mapped engine model using power, air mass flow, fuel flow, exhaust temperature, efficency and emission performance.
Dynamic model :
Here the main model is decomposed into lower level components. by combining this way the model captures the dynamic effects. This actually helps to analyze the individual engine components on the overall performance.
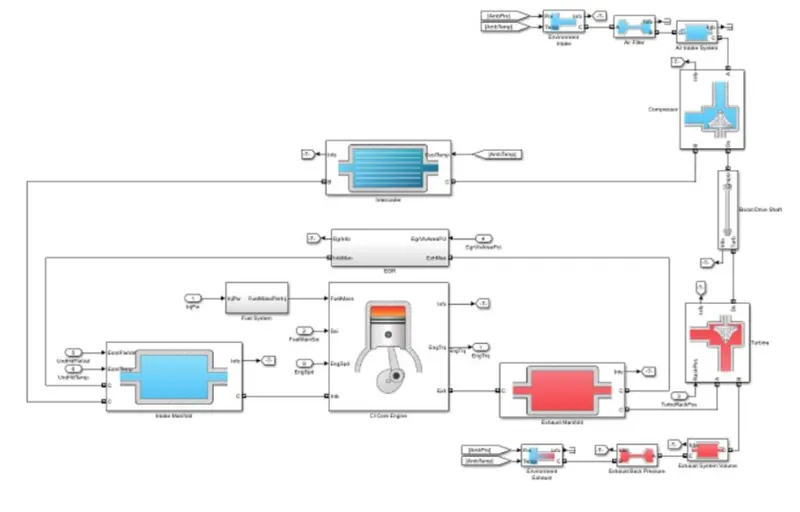
To change the model type from mapped to dynamic, we need to follow this steps.
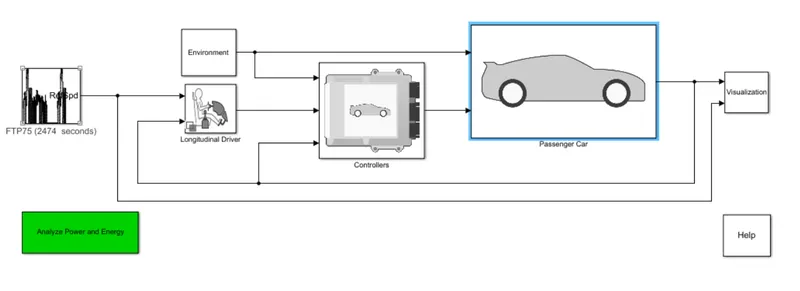
With the selection of passenger car, then choose any model which needs to changed, in this case i have choosen electric plant.
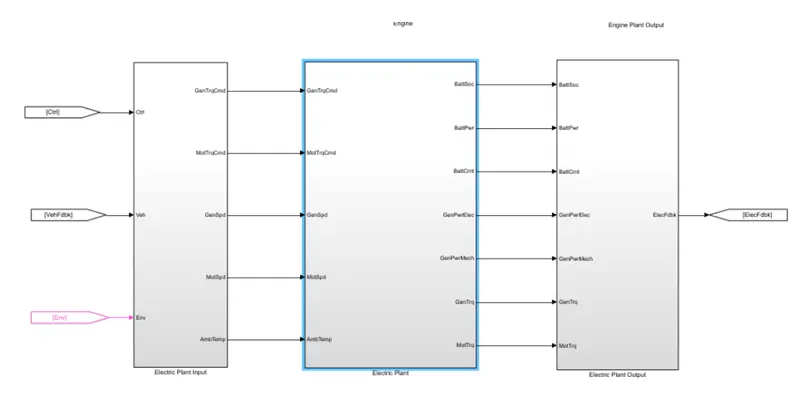
This is followed by choosing the generator model.
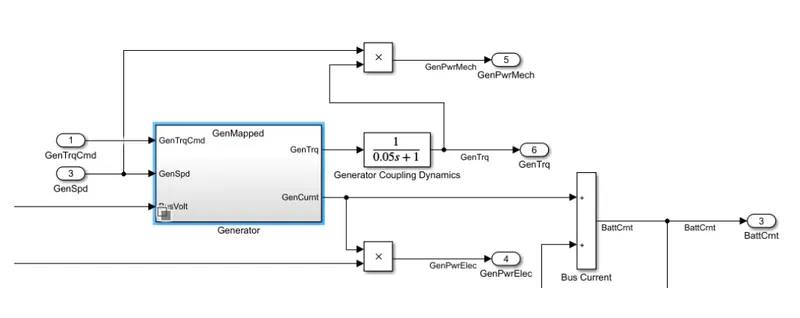
After which we will getting an additional sub block
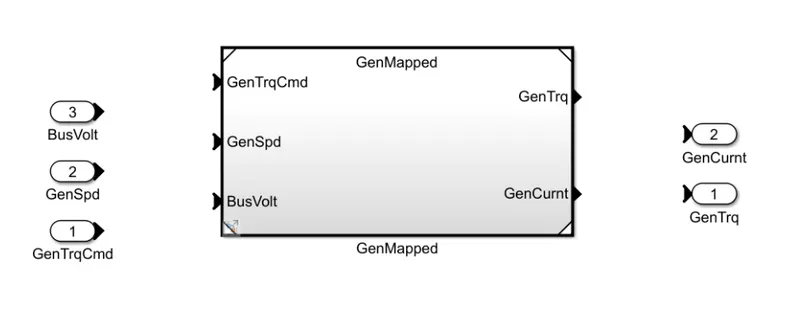
2. How does the model calculate miles per gallon? Which factors are considered to model fuel flow?
Fuel efficiency ia an important parameter that helps determine engine efficiency of vehicle. in case of elctrical vehicle, battery capacity is converted into miles per gallon for the vehicle performance comparision.
miles per gallon is different for every category of vehicle. here we are going to look into different categories of vehicle, one is hybrid electric and another one is pure electric vehicle.
Hybrid Electric Vehicle :
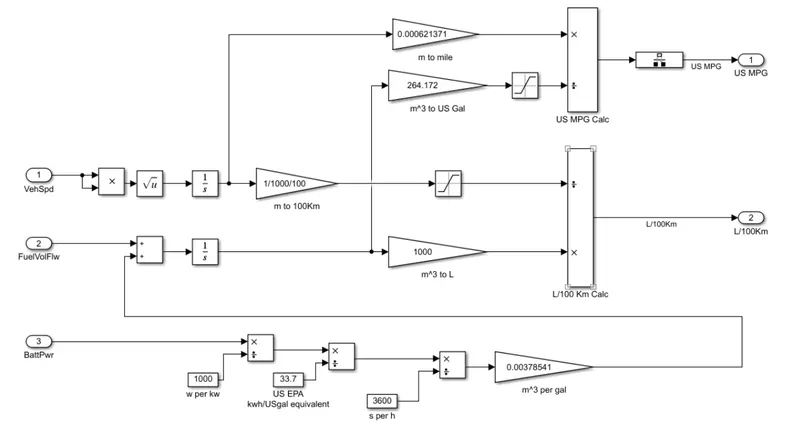
Based on the model it is observed that miles per gallon is based on three categores
i) Battery power
ii) Fuel volume low rate
iii) Vehicle Speed
Battery power :
based in the observation from the block diagram, the following steps have been caried out to covert th eoutput value in m^3 per gal.
- first ouput value divided by 1000, so that W can be converted into KW
- KWH/Usgal equivalent is obtained by dividing th end result by 33.7
- Then KWH to KWS is obtained by 3600
- finally using the gain block the obtained result is multiplied with 0.0037 to get the values in m^3 pder gal.
Fuel volume low rate :
- The vaule of the fuel volume flow rate is added along with output obtained from the battery power using sum block
- Ouput obtained from Sum block is then using integrator block m^3
- M^3 is converted L by multiplying 1000 with it. another output (us gal) is also obtained by multiplying 264.17. this is followed by connecting it to the 'saturation' block
Vehicle Speed :
Vehicle speed value is diverted then into 2 routes one is obtain KM and the ot is also an important parameter to determine the fuel efficiency of the vehicle. here in this block, it is observed that in order to avoid the negative sign in the input vehicle speed by splitting the values and multiplying the same using product block. the same is taken square root to attain the same value without the negative sign. then followed by an integrator block to obtain distance. This distance value is diverted into 2 routes one is to obtain the KM and other is a mile.
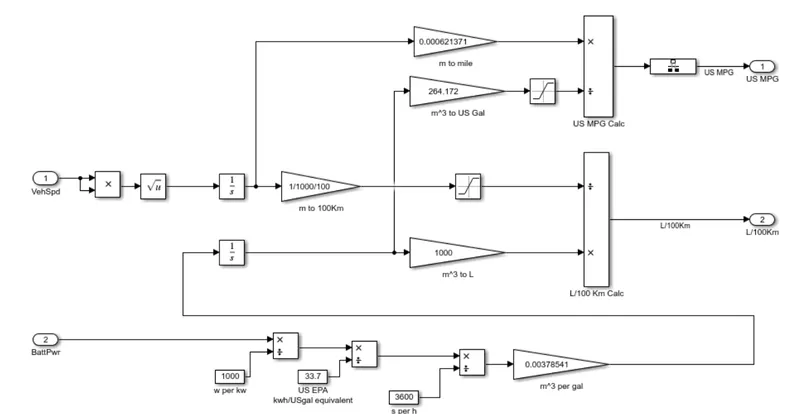
In pure EV, miles per gallon is determined by 2 factors,
- vehicle speed
- battery power
3. Run the HEV ReferenceApplication with WOT drive cycle. Change the grade and wind velocity in the environment block
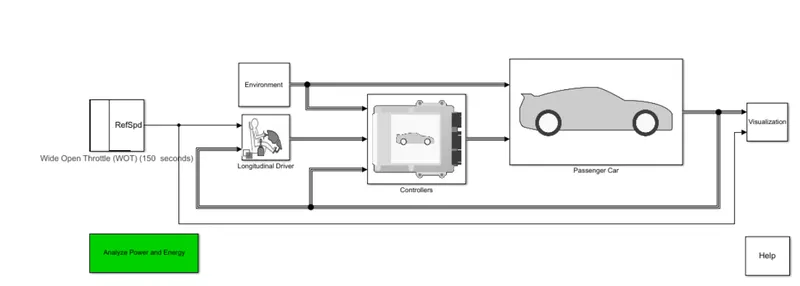
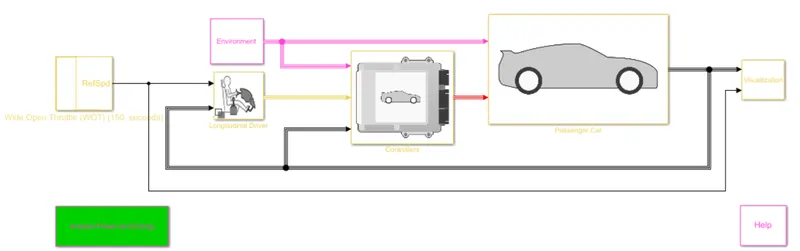
The drive cycle is changed from FTP75 to Wide Open Throttle
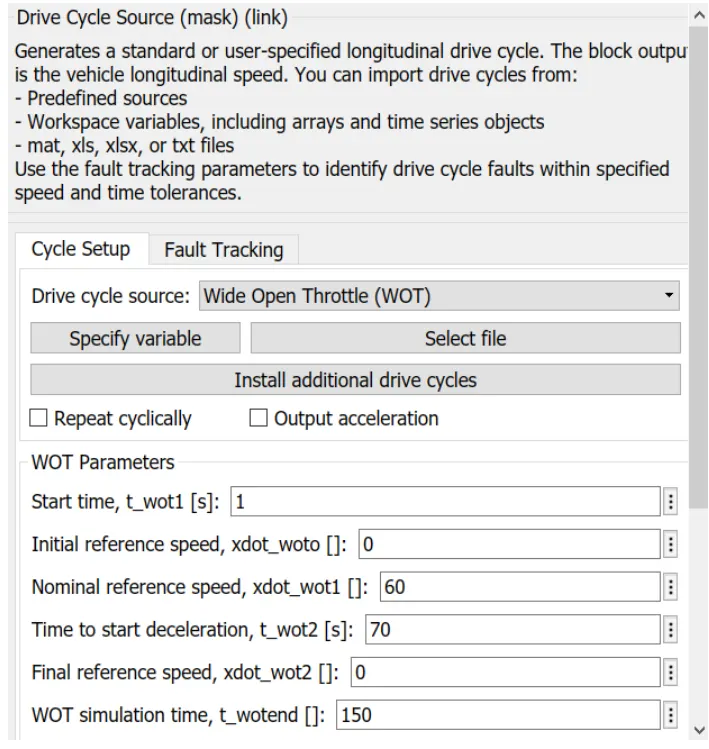
parameter are changed in Wide Open Throttle Drive Cycle.
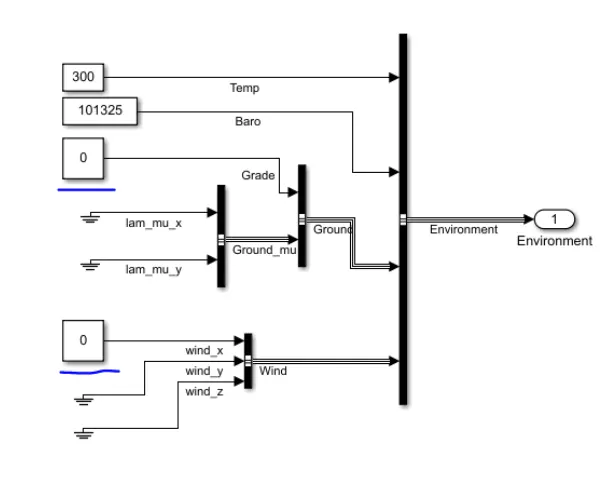
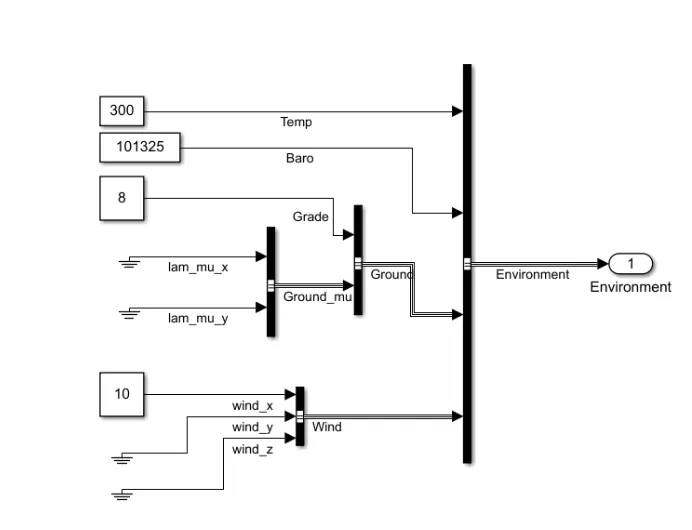
Here i have changed the environment factors, the grade and wind are kept zero
After running simulaion, the resukt graph is shown below
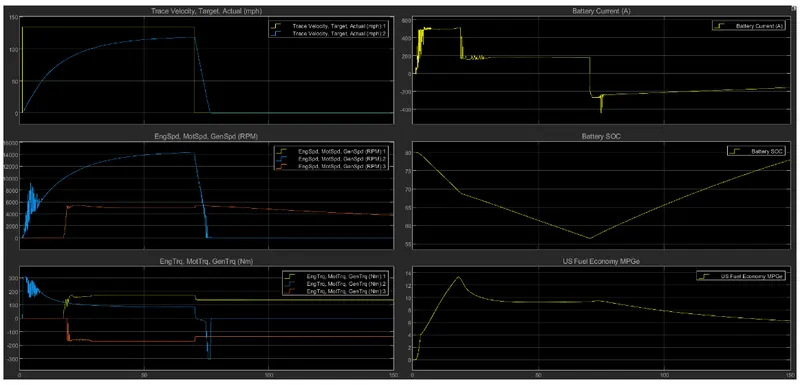
- As the drive cycle is WOT and the speed data input is given in a step format, we can notice that the target velocity increased steeply right after 1 second and ended abruptly after 60 sec. wheras the actual velocity is not matched with the target velocity mainly because of the limitations of the battery capacity and IC engine initial torque to propel the vehicle.
- Based on the graph it is observed the maximum battery capacity is 500A which makes the battery to provide more torque at the initial phase when compared to IC engine
- After 40 sec, the torque from motor is reduced and IC enginee gets stablized. this is supported by battery discharge as well as which is near 200A
- During the braking, we can observe the motor speed and torque isbslumped whereas the en below 58%,
- gine torque remains the same. motor torque and battery dropped to negative values indicate 'regenerative braking' process happening in the HEV
- it is also observed that BMS in HEV is designed in such a way that battery state of charge doesn't go below 58%, below battery get's charged through eithier IC enigne or Plug in
- Maximum fuel efficency is attained when the vehicle travels at speed of 60 to 75 mph
In this second stage of simulation i have cahnged the values of grade and velocity as shown.
Simulation results are shown
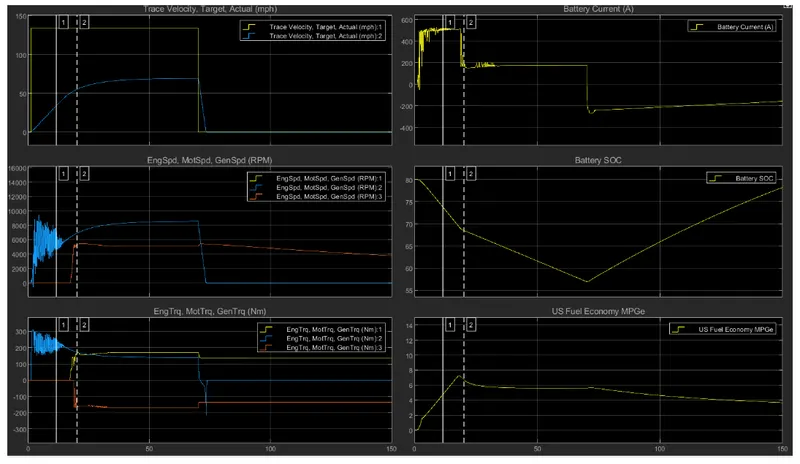
Observation :
- when compared to previous result , the actual velocity has drastically reduced this due to the grade and wind velocity values.
- fuel efficency has also dropped significantly from 12 to 7 MPGE
- Rest of the parameters are the same.
4. Keeping all other parameters same, compare the simulated results of hybrid and pure electric powertrains
The below is a comparison of block diagaram used in HEV and EV
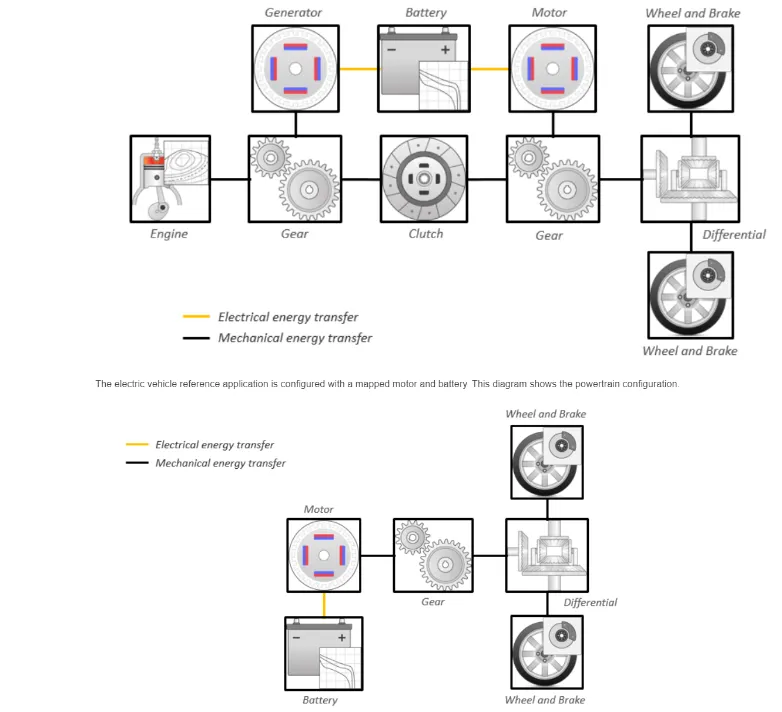
In the EV there is no IC engine, no separate motor and generator because in case of EV the motor itself functions as a genrator during the regenerating braking. Hence one set of gear is sufficient for the EV.
So first case comparision, i have just changed the drive cycle to wot with the same parameters as given in Hev.
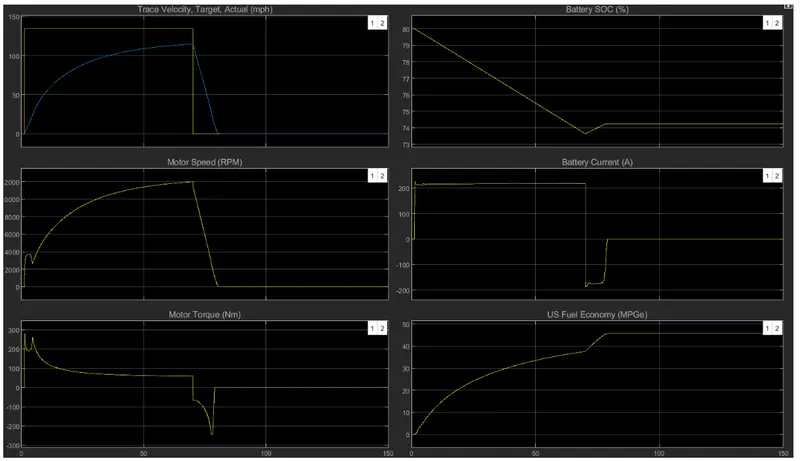
- first comparision is about the target and actual velocity. the graph seems to almost similar to that of HEV this is mainly because of maximum discharge limit from battery, in this case, it is 200A.
- Since here the battery and motor are tge only driving unit for this vehicle, the maximum motor speed is 12000 which is lesser than HEV
- Motor torque at the intial level is lesser when compared to HEV because EV weighs lesser.
- here the fuel economy is higher when compared to HEV.
- The rest are all same, ie., the motor torque goes negative when there is a drop in the velocity and braking by then motor acts as a generator and converts this mechanical to electrical energy and recharges the battery.
Now by changing the parameter of environment similar to the HEV model.
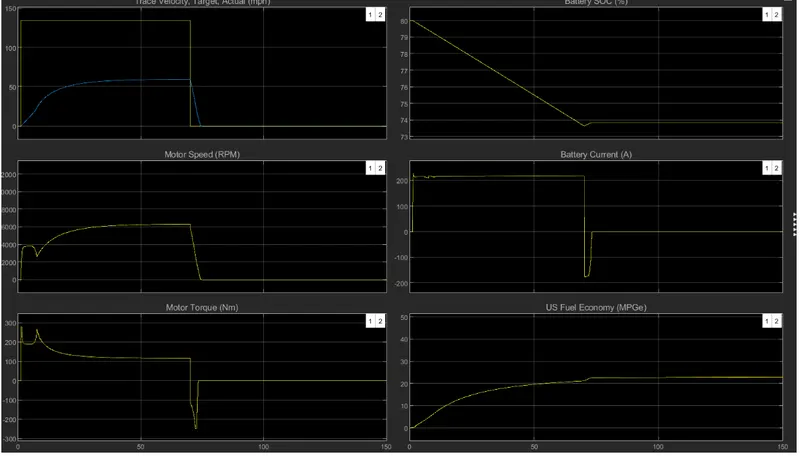
After giving the velocity of grade and wind velocity, the actual velocity dropped much lower than HEV. this is because HEV powered by both battery and IC engine whereas the EV mainly relies on the battery.
Like in HEV motor speed and fuel efficency dropped drastically in the EV model because of the grade and wind velocity values.
Obeservation:
- Mapped system is a block where the simulation is runbased on predefined values whereas a dynamic system ia a block where the simulation is run based on the performance captured from every small component that iscoming under the system
- Difference between HEV and EV model ia analyzed and captured based on simulation resultts.