Week-4 Challenge WOT Condition Part-2
OBJECTIVE:
- Write the difference between the mapped and dynamic model of the engine, motor, and generator and describe how to change the model type.
- Find out how the model calculates miles per gallon and states the factors which are considered to model fuel flow.
- Run the HEV Reference application with WOT drive cycle and change the grade and wind velocity in the environment block.
- Compare the simulated results of hybrid and pure electric powertrains.
OBJECTIVE-1:
Powertrain Block set provides a set of fully assembled reference applications, including gasoline (spark-ignition, SI), diesel (compression-ignition, CI), hybrid, and electric vehicle systems, as a starting point for your powertrain system model.
To model a powertrain system for your project, you can select a reference application based on the powertrain type. Each reference application includes plant models, controllers, a longitudinal driver, and drive cycle data.
The component library in Powertrain Block set provides blocks of physical systems and controllers for:
- Propulsion
- Transmission
- Drivetrain
- Energy storage
- Longitudinal vehicle dynamics
- Drive cycle data and longitudinal driver
Powertrain Block set provides two types of combustion engine models: mapped and dynamic.
Mapped engine:
Mapped engines represent macro engine behavior as a set of lookup tables (brake torque, fuel flow, air mass flow, exhaust temperature, efficiency, and emissions) as functions of commanded load and measured engine speed.
Mapped engine models are suitable for analysis and design activities that do not require engine subsystem dynamic characteristics, for example, in engine and transmission powertrain matching analysis for fuel economy, emissions, and performance trade-offs.
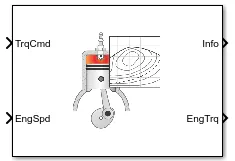
Dynamic engine:
Dynamic engines decompose engine behavior into individual component models that account for engine dynamics, most notably intake airflow and turbocharger dynamics.
Dynamic engine models are suitable for designing control, estimator, and diagnostic algorithms that depend on dynamic subsystem states, for example, in closed-loop AFR control algorithm development.
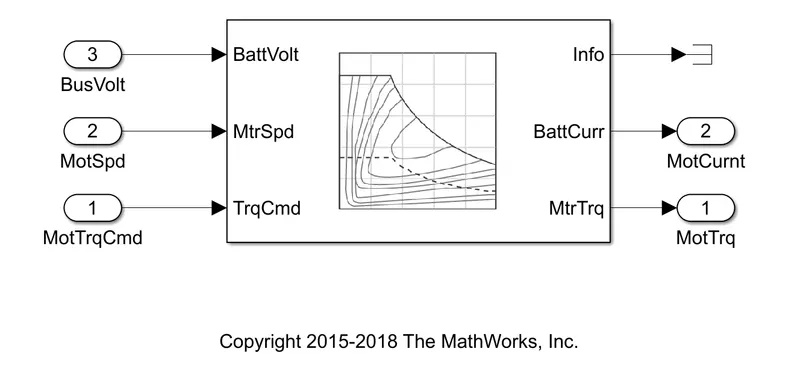
Mapped motor:
- Mapped motor model of motor runs in torque control mode.
- This model specifies the electrical losses as a single operating unit that measures losses across the operating range, maximum efficiency, and speed.
- We use mapped motors when details of the motor are unknown and when quick simulations are required.
- Motor specifications are entered using the lookup tables before simulating the result.
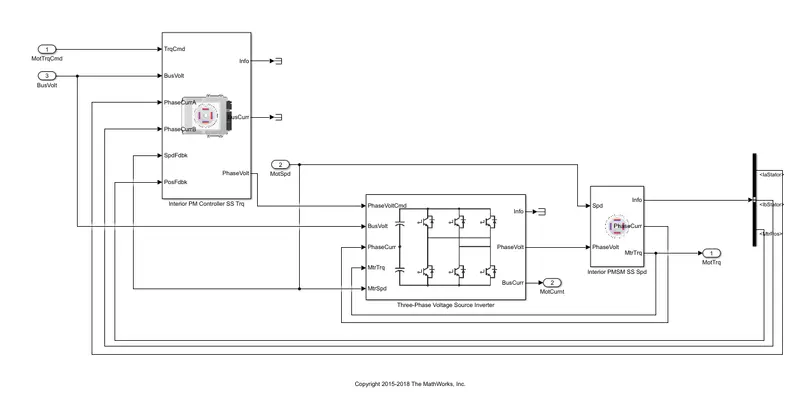
Dynamic motor:
- This model is used when all the parameters are known and use a torque-based field controller for an internal permanent magnet synchronous machine with an optional output loop speed controller.
- These are more accurate when compared to the mapped motors
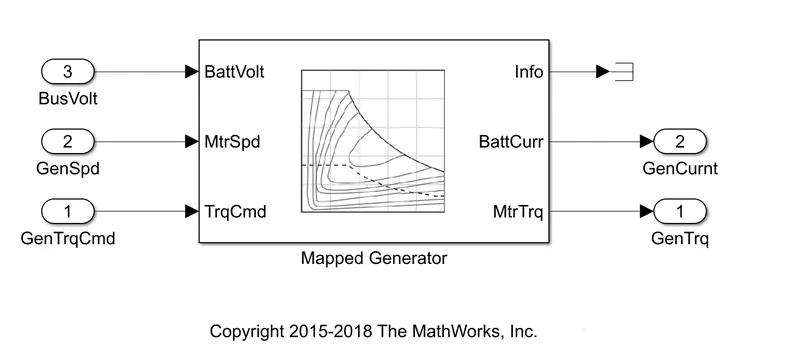
Mapped generator:
we have to give the specifications of battery torque, battery current, and others in the lookup table before simulating the result for the mapped generator.
Dynamic generator:
It performs a real-time simulation of components that takes place in the real system.
In the dynamic model, simulation gives a detailed analysis.
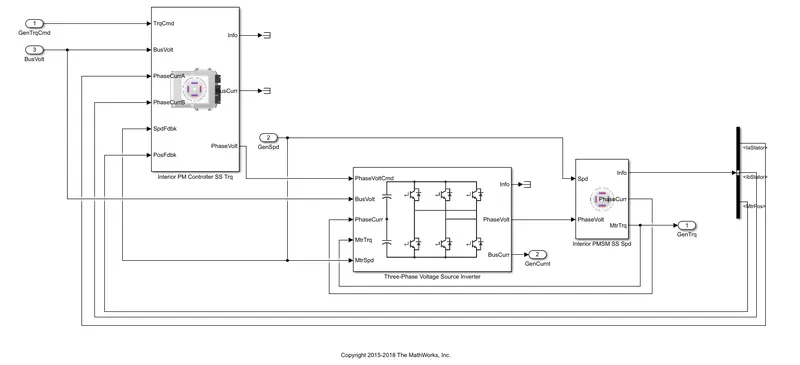
Changing the model type:
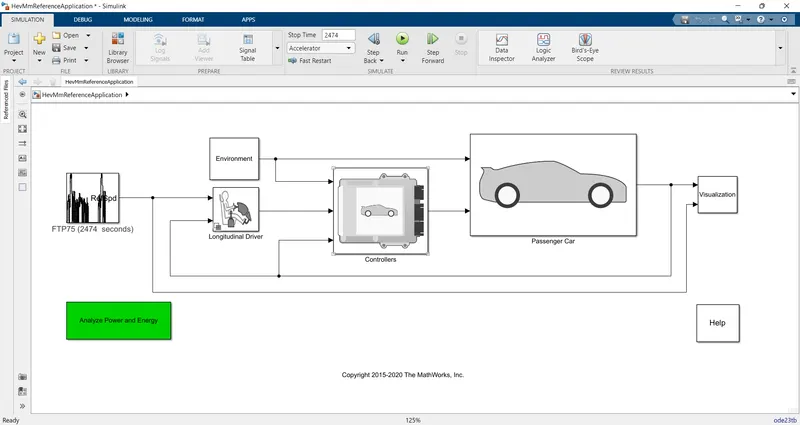
Step-1: Open the HEV Reference model, and double click on the passenger car block to open it.
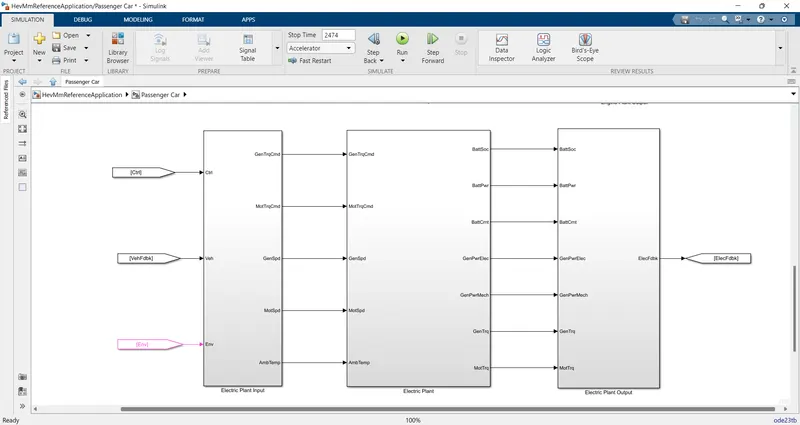
STEP-2: Open the Electric plant model then right-click on the Generator block.
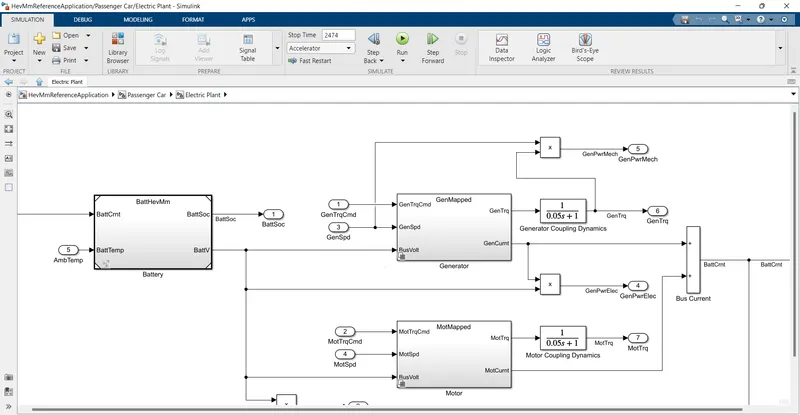
STEP-3: Select the Variant then click Label Mode Active Choice and change the model Mapped to Dynamic.
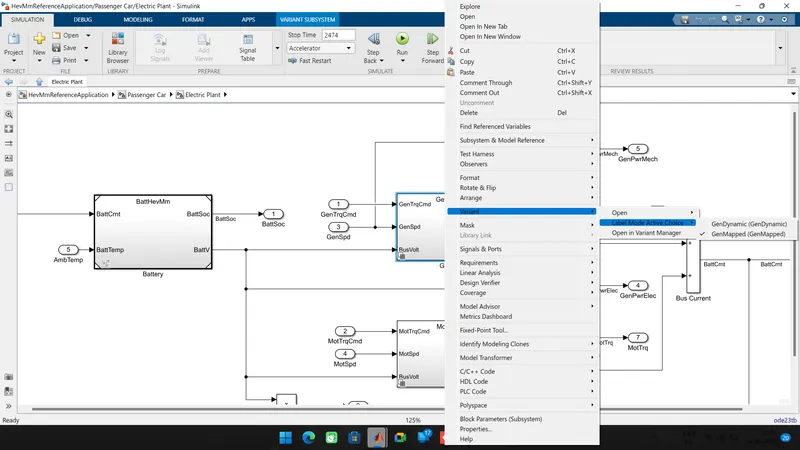
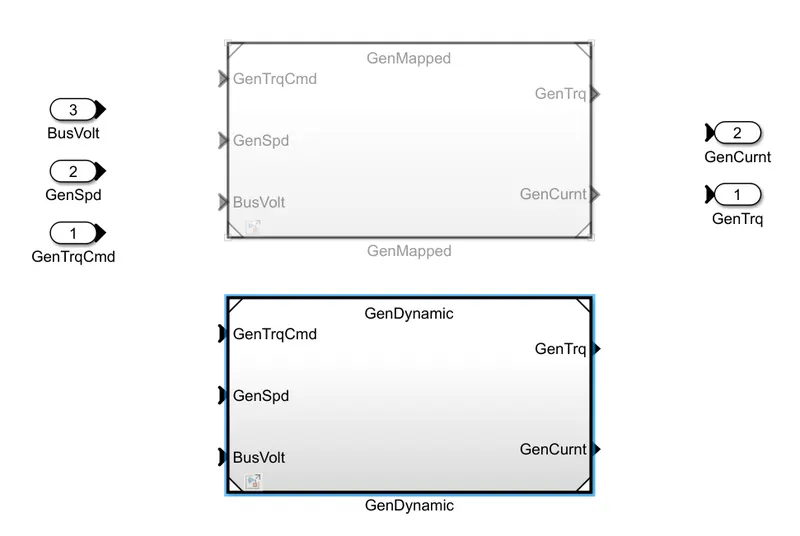
STEP-4: Select the Variant then click Label Mode Active Choice and change the model Dynamic to Mapped.
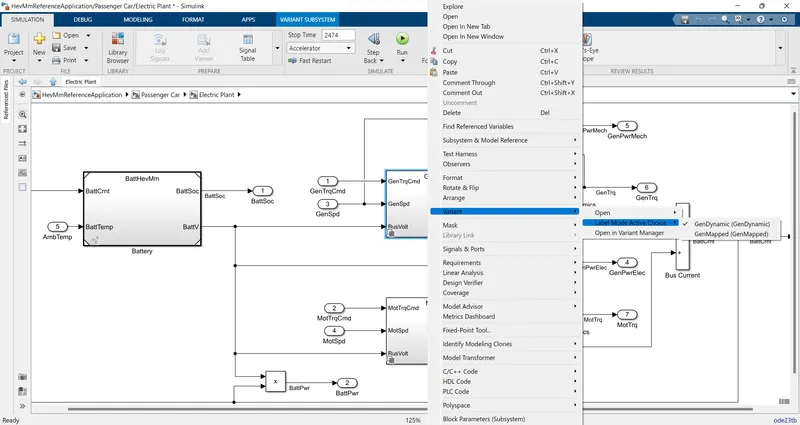
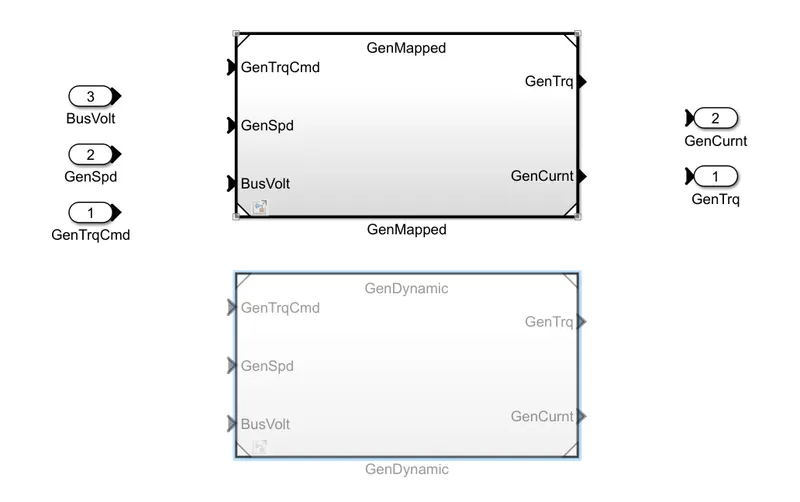
OBJECTIVE-2:
- Miles per gallon is a fuel economy determined by how much distance a car can travel on a gallon of fuel for an engine-powered car.
- The amount of fuel energy required to move on engine power car through a distance is determined.
- Then it is compared to the equivalent amount of electrical energy required to move the car through the same distance and it is expressed as the miles per gallon.
- The powertrain block set model calculates the miles per gallon for all kinds of vehicles.
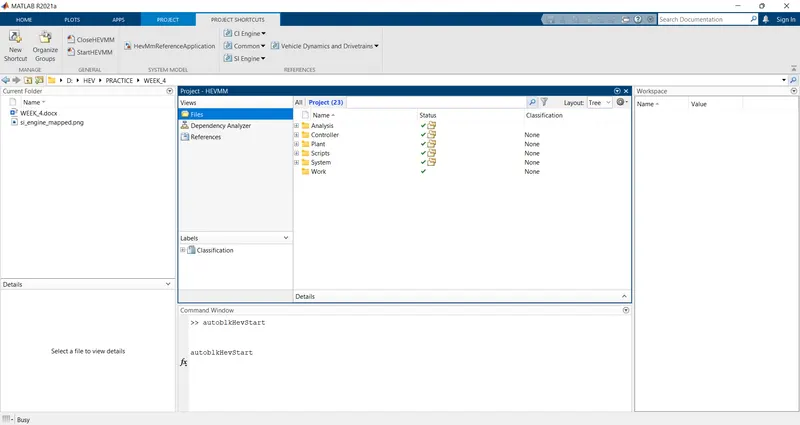
Open the Hev reference model by using a command (autoblkHevStart) in the command window.
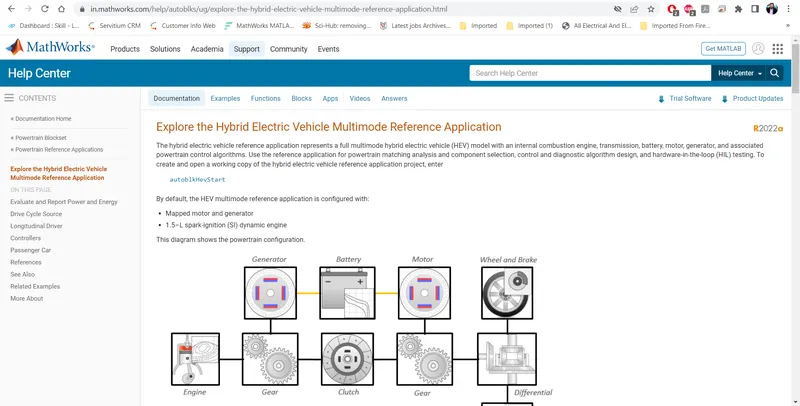
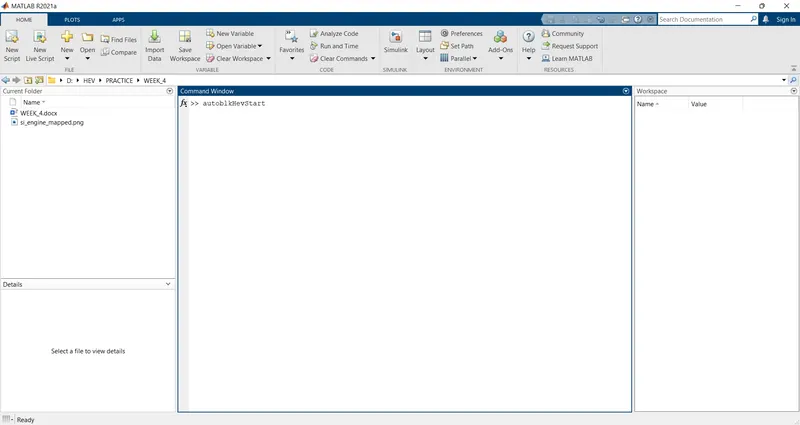
after entering the command in the command window new window will open and then the Hev Reference model automatically open.
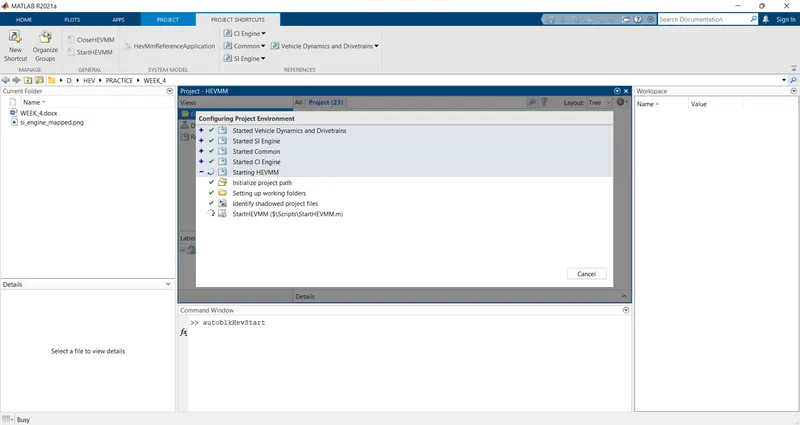
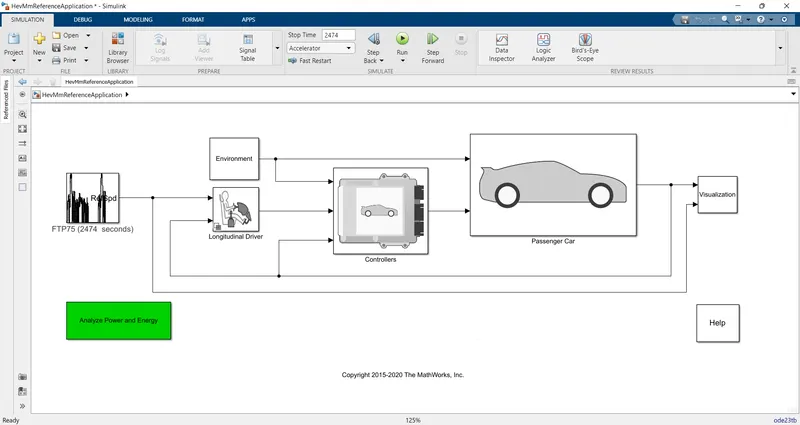
Open the visualization block and then open the performance calculations block to calculate the fuel calculations.
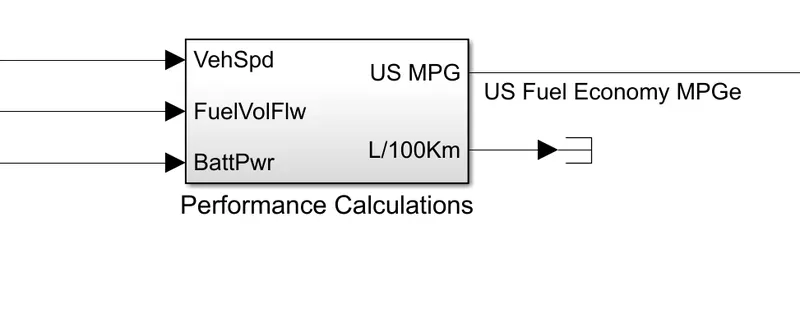
after opening the performance calculations block we can see the vehicle speed, fuel consumption flow, and battery are taken as inputs.
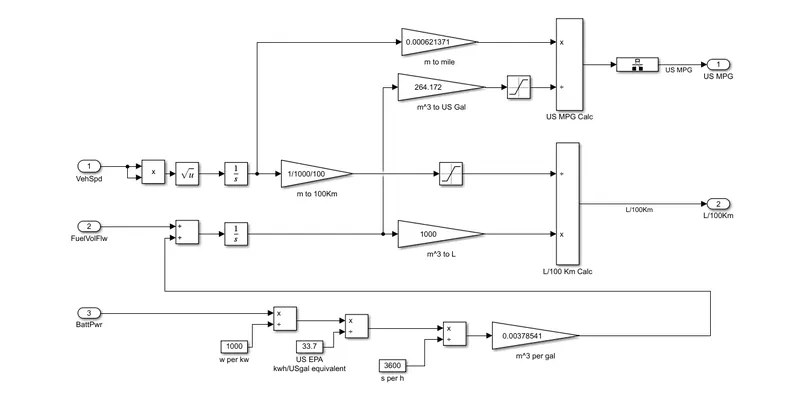
- The battery power is converted to kw by dividing it by 1000 and then it is converted into kWh by multiplying it with time.
- Then converting it from kwh to equivalent energy in gallons by diving it with 33.7. and to get the gallons per second it is converted from hour to sec, by dividing by 3600.
- Then us gallon per second is multiplied by 0.0037841 to get the volume of fuel flow in m^3/g. Then multiplied by 739 to get the mass flow rate in kg/s.
- Integrating the result in the mass of fuel, and dividing the mass by the fuel density converts it to the volume, and then multiplying by 1000 we can get it in liters.
- The vehicle distance is taken in meters and then multiplied by 0.000621371 converted to the miles.
- then the inputs from fuel flow, battery energy, fuel energy, and fuel energy in m^3 are converted into us gallons by multiplying with 264.172.
- The two inputs miles converted and equivalent us gallon are further divided and the result is miles per gallon.
Factors are considered to model fuel flow
- Fuel Economy
- Fuel Consumption
Major Factors to Consider in model fuel flow:
- Vehicle speed
- Fuel Flow
- Battery power
OBJECTIVE-3:
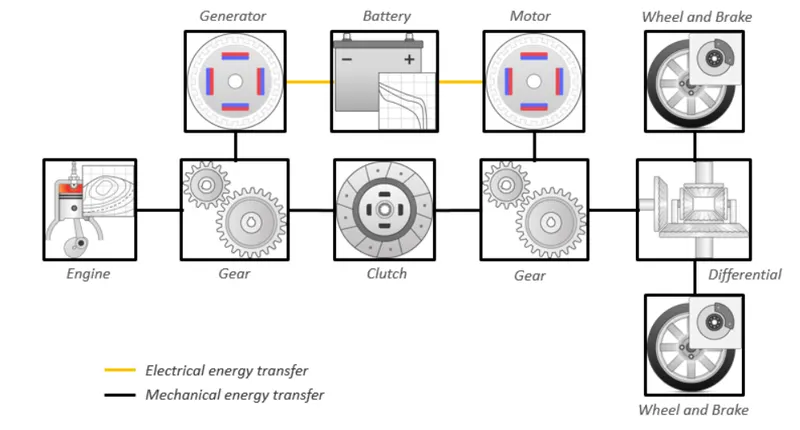
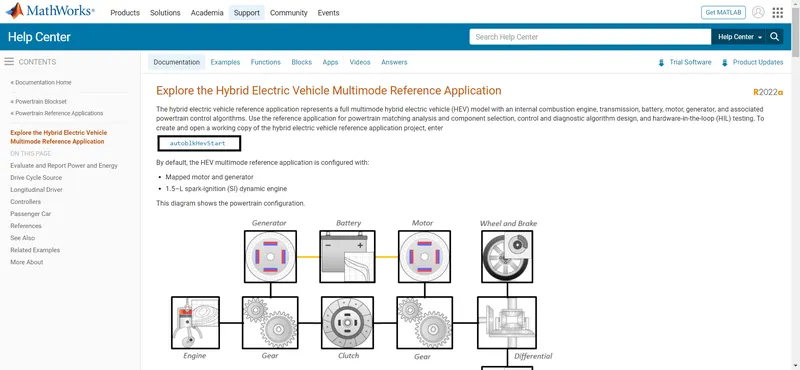
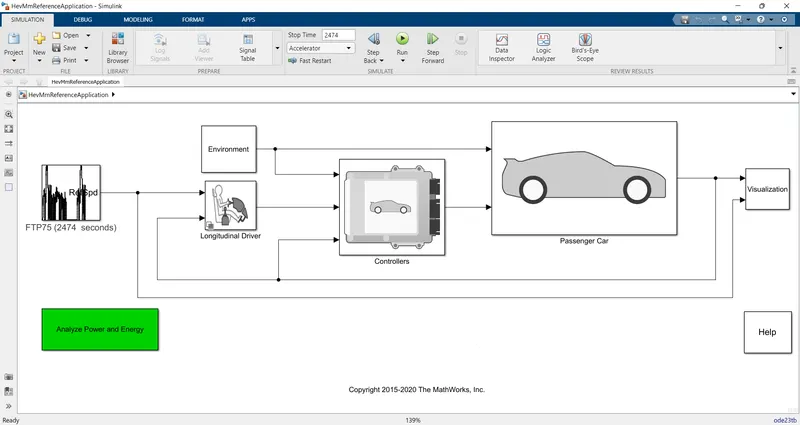
The hybrid electric vehicle (HEV) multimode reference application represents a full multimode HEV model with an internal combustion engine, transmission, battery, motor, generator, and associated powertrain control algorithms. Use the reference application for powertrain matching analysis and component selection, control and diagnostic algorithm design, and hardware-in-the-loop (HIL) testing.
This diagram shows the powertrain configuration.
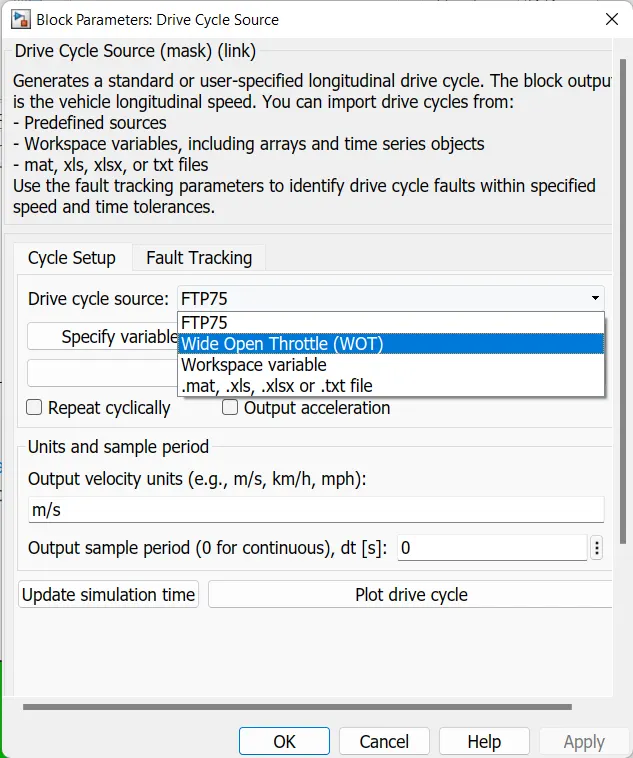
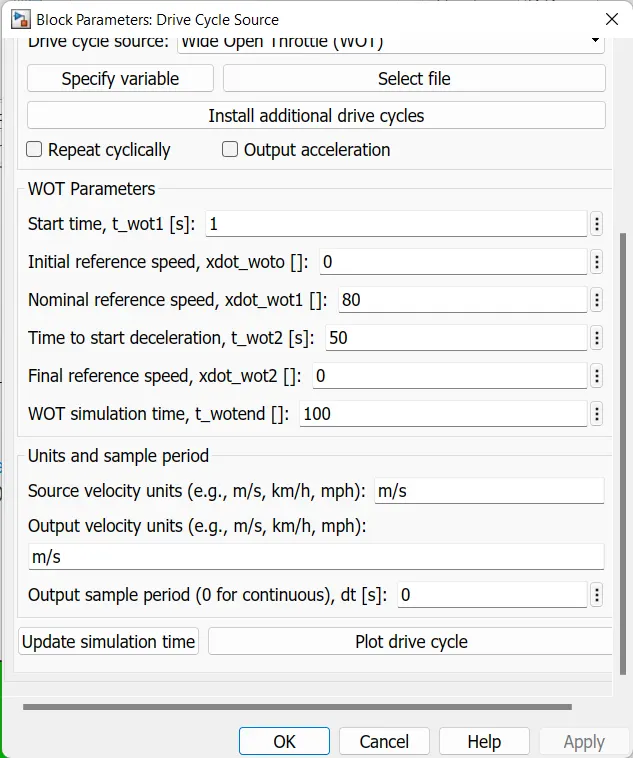
The total cycle time = 100 seconds
The top speed of this cycle = 80 mph
Time to start deceleration = 50 seconds
The Grade angle = 0 degrees.
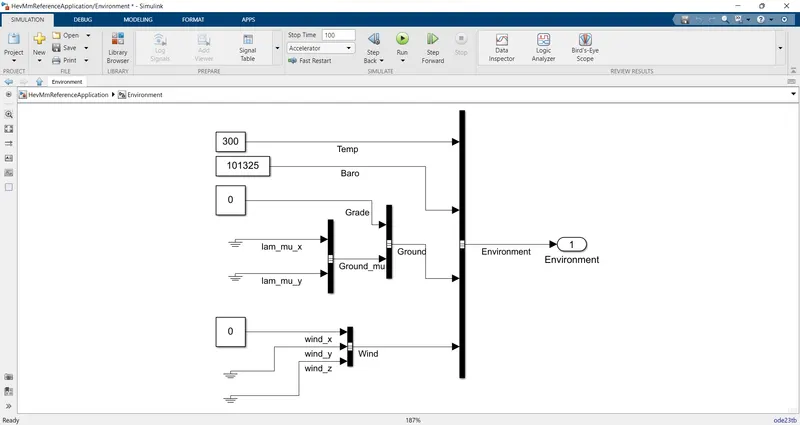
The simulation runs for 100sec and observes the output. The below figure shows the HEV model simulation results.
There are a total of six plots have been observed in this simulation and each plot represents the different parameters.
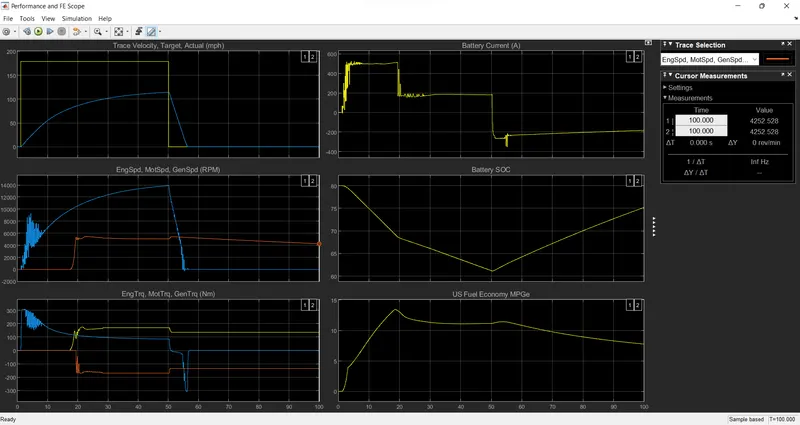
PLOT_1: Trace velocity, Target, Actual (mph)
In this plot, we can observe the Time on X-axis and velocity on Y-axis.
The maximum velocity attained is 115 mph.
Time taken to achieve the maximum Acceleration is 50sec.
The time it has taken to decelerate from 115mph in 6.3 sec.
PLOT_2: Engine Speed, Motor Speed, Generator Speed (RPM)
In this plot, we can observe the Engine, Motor, and Generator’s speed in rpm throughout the drive cycle
Peak engine speed = 5068 rpm
Peak motor speed = 13895 rpm
Peak generator speed = 5068 rpm
PLOT_3: Engine Torque, Motor Torque, and Generator Torque
In this plot, we can observe the Engine Torque, Motor Torque, and Generator Torque characteristics.
Peak engine Torque = 170nm
Peak Motor Torque = 307nm
Peak Generator torque =170nm
PLOT_4: Battery Current (A)
In this plot, we can observe the Battery current charging and discharging conditions throughout the driving cycle.
Peak Current discharge = 520A
Peak Current Charge = -182
PLOT_5: Batter SOC
In this plot, we observe the Battery State of Charge (SOC) in the Percentage (%), and changes in the corresponding given inputs.
SOC is decreased from 80% to 61.2% of charge in the time of 50.88sec.
PLOT_6: US Fuel Economy MPGe
In this plot, the Fuel Economy is calculated in US Miles per Gallons.
The maximum distance (miles) that a car can run per gallon of fuel is 13.41mpg.
The total cycle time = 100 seconds
The top speed of this cycle = 80 mph
Time to start deceleration = 50 seconds
The Grade angle = 6 degrees.
The wind velocity =10m/s
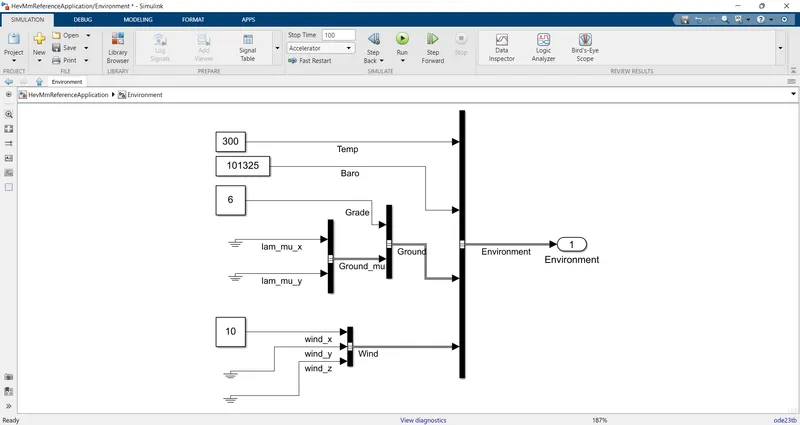
The simulation runs for 100sec and observes the output. The below figure shows the HEV model simulation results.
There are a total of six plots have been observed in this simulation and each plot represents the different parameters.
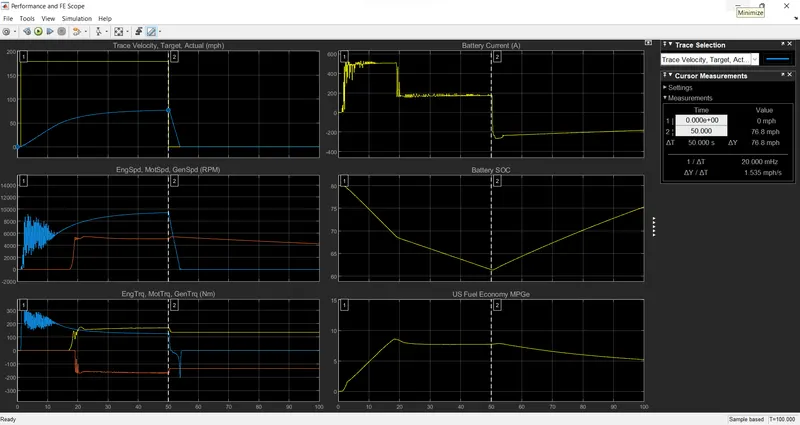
PLOT_1: Trace velocity, Target, Actual (mph)
In this plot, we can observe the Time on X-axis and velocity on Y-axis.
The maximum velocity attained is 76.8 mph.
Time taken to achieve the maximum Acceleration is 50sec.
The time it has taken to decelerate from 76.8 mph in 3.7 sec.
PLOT_2: Engine Speed, Motor Speed, Generator Speed (RPM)
In this plot, we can observe the Engine, Motor, and Generator’s speed in rpm throughout the drive cycle
Peak engine speed = 5408 rpm
Peak motor speed = 9426 rpm
Peak generator speed = 5408 rpm
PLOT_3: Engine Torque, Motor Torque, and Generator Torque
In this plot, we can observe the Engine Torque, Motor Torque, and Generator Torque characteristics.
Peak engine Torque = 169 nm
Peak Motor Torque = 205 nm
Peak Generator torque =170 nm
PLOT_4: Battery Current (A)
In this plot, we can observe the Battery current charging and discharging conditions throughout the driving cycle.
Peak Current discharge = 528A
Peak Current Charge = -266
PLOT_5: Batter SOC
In this plot, we observe the Battery State of Charge (SOC) in the Percentage (%), and changes in the corresponding given inputs.
SOC is decreased from 80% to 61.4% of charge in the time of 48sec.
PLOT_6: US Fuel Economy MPGe
In this plot, the Fuel Economy is calculated in US Miles per Gallons.
The maximum distance (miles) that a car can run per gallon of fuel is 8.58mpg.
Conclusion:
- The top speed achieved by the vehicle is less in case-2 as compared to case-1 due to the grade angle and wind force acting on the vehicle.
- The State Of Charge (SOC) is also compared in Case-1 and Case-2, then the Discharge is high in Case-2.
- The fuel economy is also less in Case-2 as compared with Case-1.
- The Efficiency of the No-load vehicle with default conditions is high as compared with the Loaded vehicle and other forces acting on it.
OBJECTIVE -4:
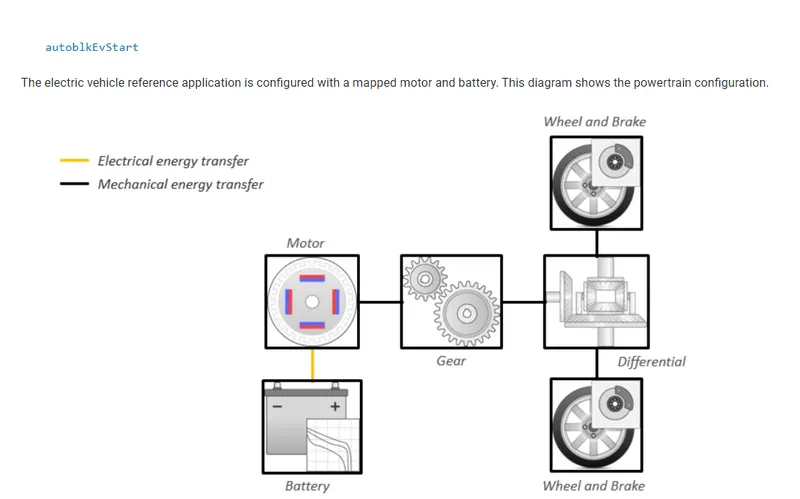
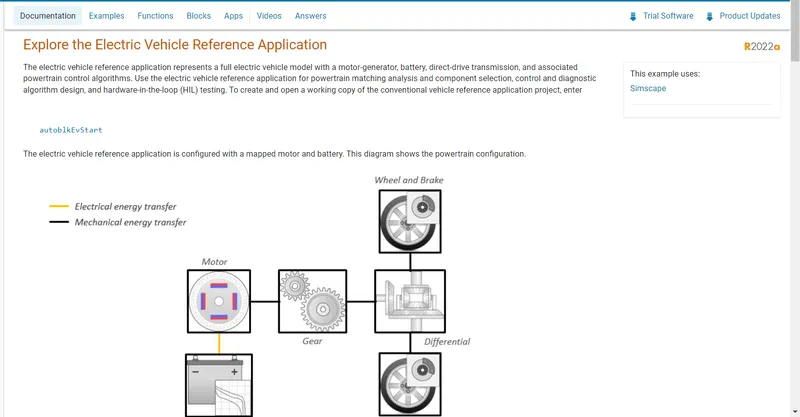
The electric vehicle (EV) reference application represents a fully electric vehicle model with a motor-generator, battery, direct-drive transmission, and associated powertrain control algorithms. Use the electric vehicle reference application for powertrain matching analysis and component selection, control and diagnostic algorithm design, and hardware-in-the-loop (HIL) testing.
This diagram shows the powertrain configuration.
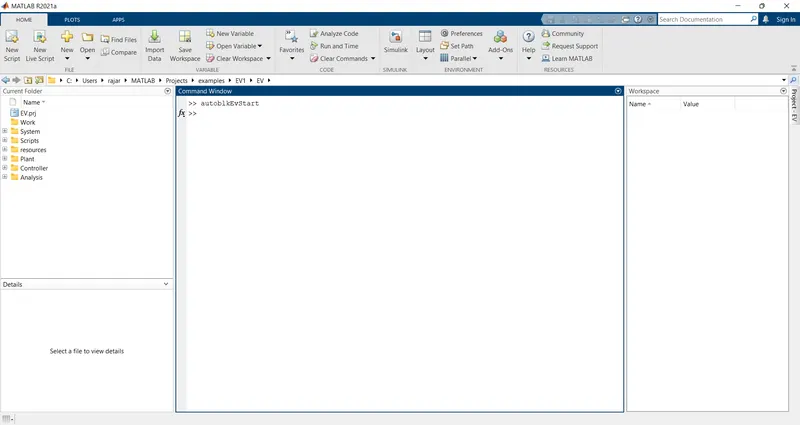
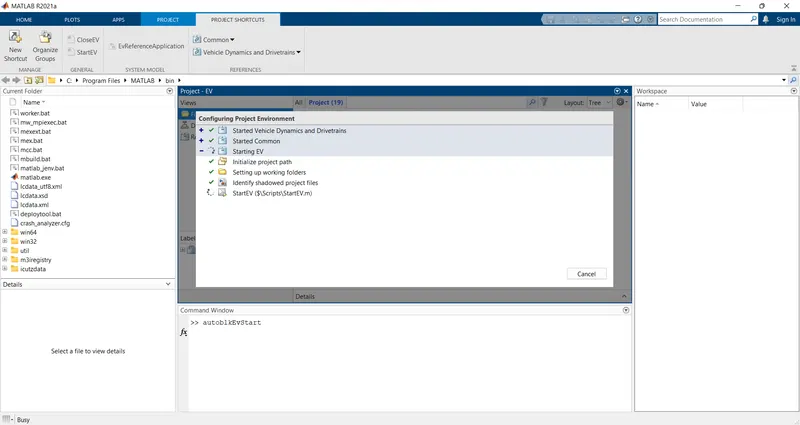
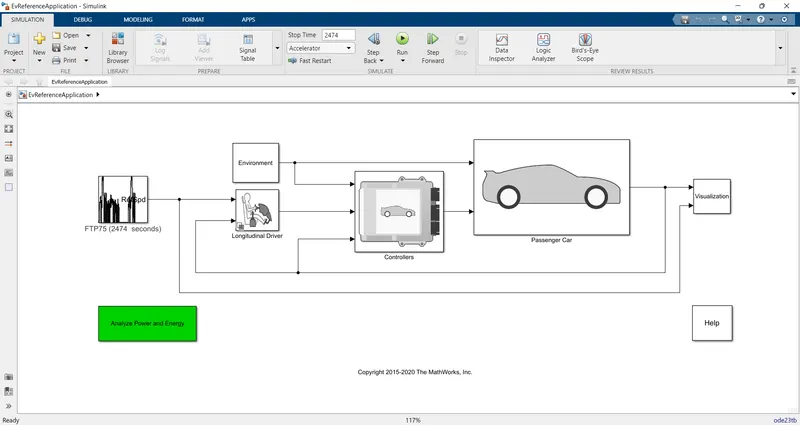
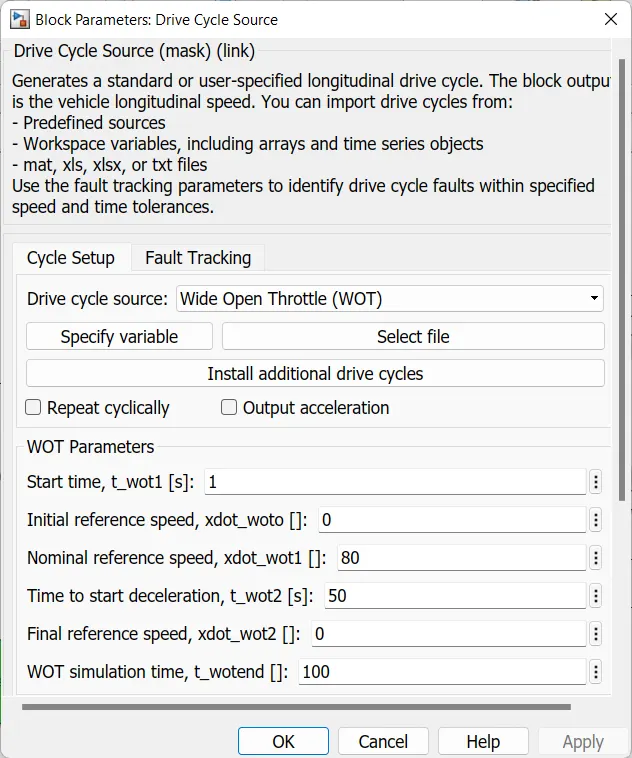
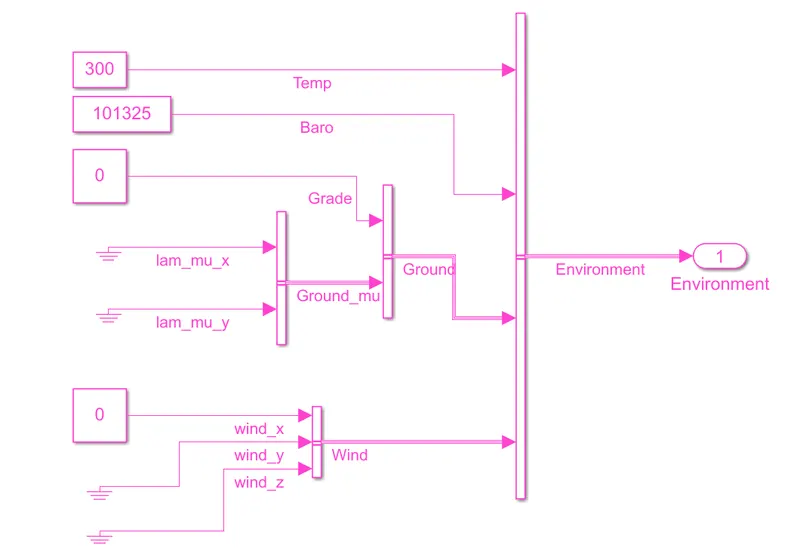
The simulation runs for 100sec and observes the output. The below figure shows the EV model simulation results.
There are a total of six plots have been observed in this simulation and each plot represents the different parameters.
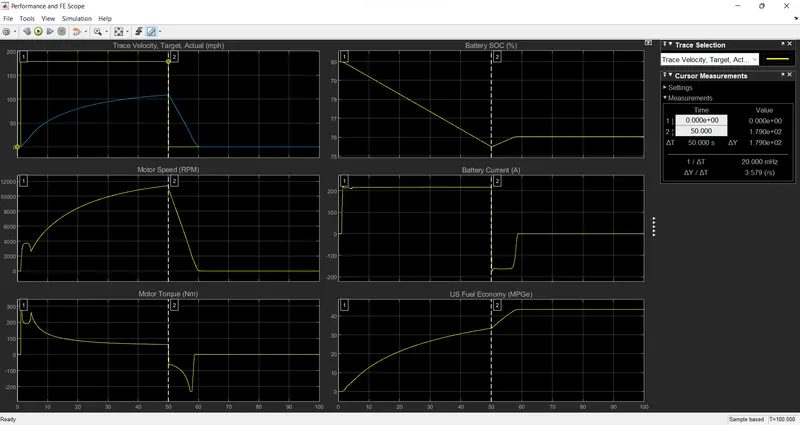
PLOT_1: Trace velocity, Target, Actual (mph)
In this plot, we can observe the Time on X-axis and velocity on Y-axis.
The maximum velocity attained is 108 mph.
Time taken to achieve the maximum Acceleration is 50sec.
The time it has taken to decelerate from 108 mph in 10.6 sec.
PLOT_2: Motor Speed (RPM)
In this plot, we can observe the Motor speed in rpm throughout the drive cycle
Peak motor speed = 1141 rpm
PLOT_3: Motor Torque (Nm)
In this plot, we can observe the Motor Torque characteristics.
Peak Motor Torque = 280 nm
PLOT_4: Battery Current (A)
In this plot, we can observe the Battery current charging and discharging conditions throughout the driving cycle.
Peak Current discharge = 221A
Peak Current Charge = -173.3A
PLOT_5: Batter SOC
In this plot, we observe the Battery State of Charge (SOC) in the Percentage (%), and changes in the corresponding given inputs.
SOC is decreased from 80% to 75.5% of charge in the time of 49.03sec.
PLOT_6: US Fuel Economy MPGe
In this plot, the Fuel Economy is calculated in US Miles per Gallons.
The maximum distance (miles) that a car can run per gallon of fuel is 43.45mpg.
- Here we are comparing the default HEV and EV Reference models.
- The Electric vehicle is when compared to Hybrid Electric Vehicle (HEV) with the same Driving Cycle (WOT) Electric Vehicle achieves a Less top speed as compared to the Hybrid Vehicle.
- The Battery discharging Capacity of Pure EV is high and then the rate of charging is high.
- In the pure EV, Lithium Batteries are used, also Nickel-metal hydride batteries are used in HEV.
- The SOC of the battery efficiency of Pure EV is higher as compared to the HEV.
- The EVs Produces Zero emissions as compared to HEV produces gas emissions.