Week-4 Challenge WOT Condition Part-2
1. Differences between mapped and dynamic model of engine, motor and generator :
| MAPPED ENGINE MODEL | DYNAMIC ENGINE MODEL |
| The model uses a set of steady-state lookup tables to characterize engine performance | The model decomposes the engine behaviour into engine characteristics that are seperted into lower level components. By combining the components in this way, the model captures the dynamic effect entirely. |
| The table provides overall engine characteristics including the actual torque, fuel flow rate, BFSC and engine-out exhaust emissions. | We use this model inorder to obtain a dynamic model and have a component-level data. |
| We use this model, if we have a engine data from a dynamometer or a design-tool like GT-POWER. We also use this model for quasi steady-state engine simulations. | It is used mainly to analyse the impact individual engine components on the overall performance. |
| MAPPED MODEL | DYNAMIC MODEL |
| The mapped motor block implements a mapped motor and drive electronics operating in torque-control mode. | It contains an interior PM model, three phase voltage source inverter and internal permanent magnet synchronous machine (PMSM). All these combinations give an EV dynamic. |
| The output torque tracks the torque reference demant and include a motor response and drive-response time constant. | The parameters of motor, current, electrical etc are given. |
| Maximum power, maximum torque, and time control along with time constant needs to be given. Here, electric losses needs to be specified, if present. |
CHANGING THE MODEL TYPE :
- Open the EV_reference _application simulink model, where the model contains drive cycle, driver, environment conditions, controllers and passenger cars. For getting the result, open the visualisation option (as in fig 1.1).
- Open the passenger car subsystem and it contains the drivetrain, electrical plant inputs and output blocks (as in fig 1.2).
- Open the electric plant which contains motor, battery and other calculation blocks (as in 1.3).
- Open motor block, containing both mapped and dynamic block systems (as in fig 1.4).
- By default, mapped motor is selected.
- To change the mapped to dynamic blockset,we need to right click on the screen and select the varient option (fig 1.5)
- Then, select the label mode activate choice and select Mot_Gen_EV_Dynamic(fig 1.6).
The step-by-step process is given below with help of the figures.
fig 1.1 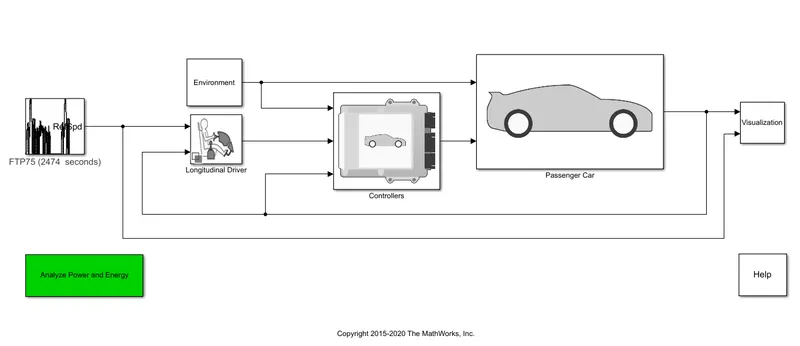
fig 1.2 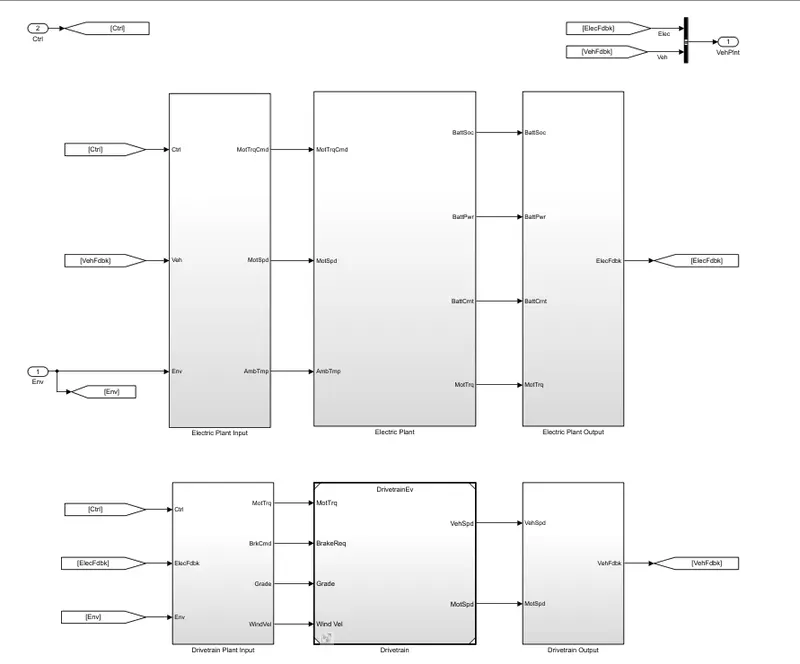
fig 1.3 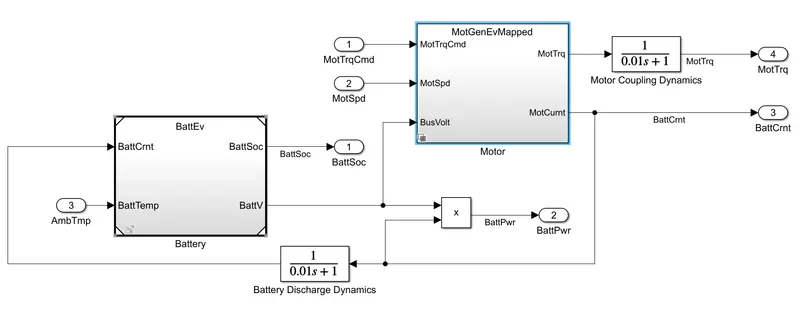
fig 1.4 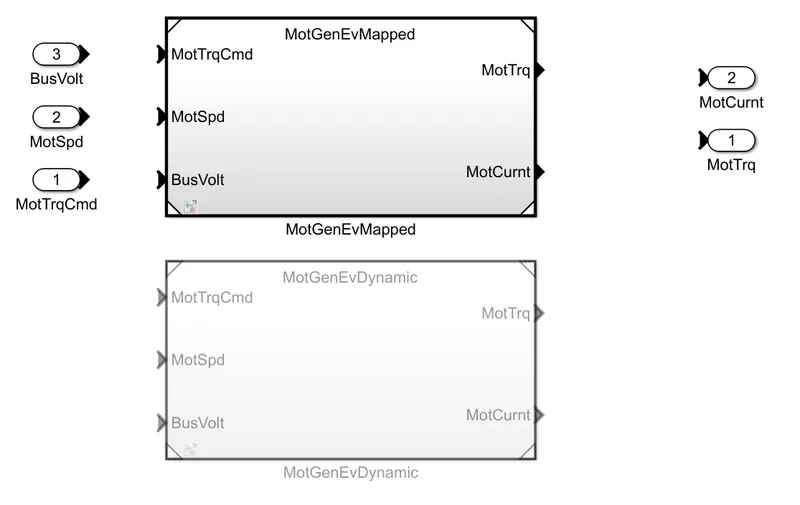
fig 1.5 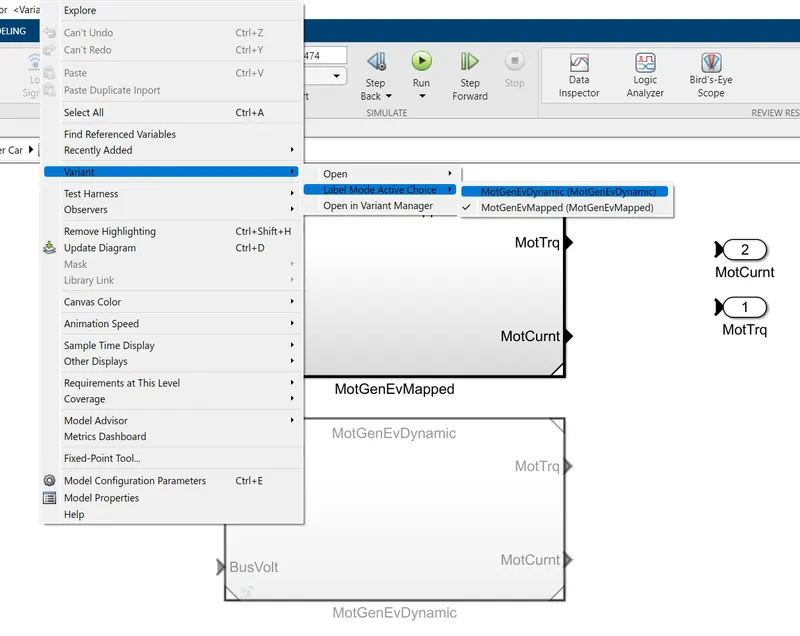
fig 1.6 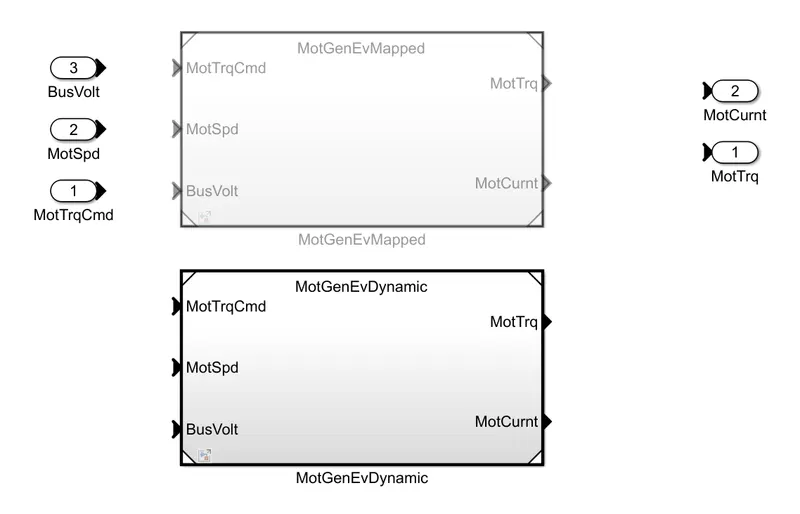
2. CALCULATION OF MILES/GALLON OF THE MODEL :
Calculation of battery power and vehicle speed in miles/gallon is used to find how much economical is the battery in comparison with the engine fuel consumption. The miles/gallon is equal to the energy generated by electric power. It helps us to understand the economy of both vehicles.
- The block diagram represents the powertrain blockset of EV vehicle to calculate the miles/gallon, where the given parameters are fuel flow, vehicle speed and battery power to find the fuel efficiency of the vehicle.
- Distance is calculated by integrating the vehicle speed with respect to time and converted to miles.
- Battery power is consumed by which the total distance is covered and converted from watt to kilowatt.
- The volume flow rate of the fuel is expressed and converted to gallons and integrated with respect to time for calculating the fuel volume.
So, miles/gallon is calculated for the performance of the fuel economy of the car or commercial vehicle. ie, if your car performs at 50 mpg, that means that you will be able to ride 50 miles on every gallon of petrol that you put in the tank.
fig 2.1 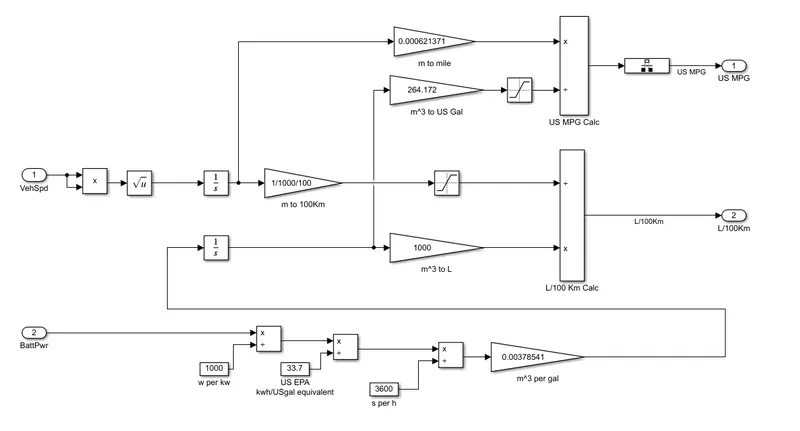
FACTORS TO BE CONSIDERED FOR THE MODEL FUEL FLOW :
- The energy content of the fuel type to be considered.
- The availability of the type of the fuel source wanted.
- The cost of acquiring and using the fuel for each specific situation.
- How safe it will be to use the fuel under consideration.
- Vehicle speed.
3. Run the HEV ReferenceApplication with WOT drive cycle. Change the grade and wind velocity in the environment block. Comment on the results.
The hybrid electric vehicle reference application represents a full multimode hybrid electric vehicle (HEV) model with an internal combustion engine, transmission, battery, motor, generator, and associated powertrain control algorithms. Use the reference application for powertrain matching analysis and component selection, control and diagnostic algorithm design, and hardware-in-the-loop (HIL) testing.
By default, the HEV multimode reference application is configured with:
-
Mapped motor and generator
-
1.5–L spark-ignition (SI) dynamic engine
This diagram shows the powertrain configuration.
fig 3.1 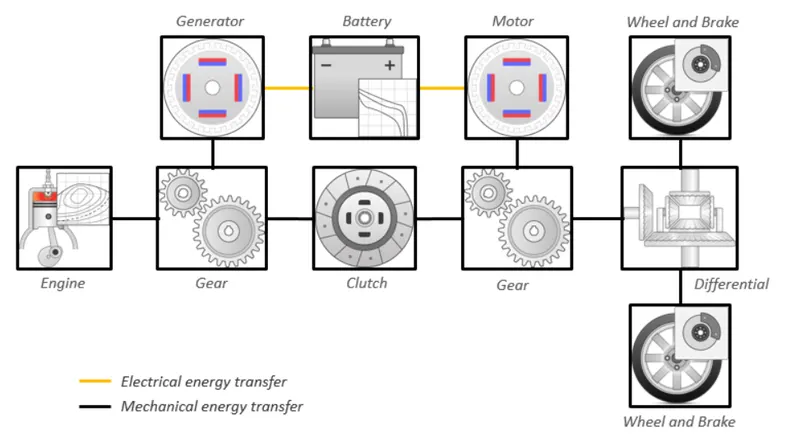
At first, open the HEV reference_application with wide open throttle(WOT) drive cycle for a time interval of 50 sec, in which autoblkHevStart model is selected from the matlab help file. Within the model, it has environment sub-system block, drive cycle source block, longitudinal driver sub-system block, vehicle controller sub-system, passenger car sub-system and a visualization sub-system block(fig 3.2). The grade and wind velocity to be changed is present in the environment sub-system block. Inside the environment sub-system block, it has temperature, wind pressure, gradeability and wind velocity measurement systems as in fig 3.4
fig 3.2 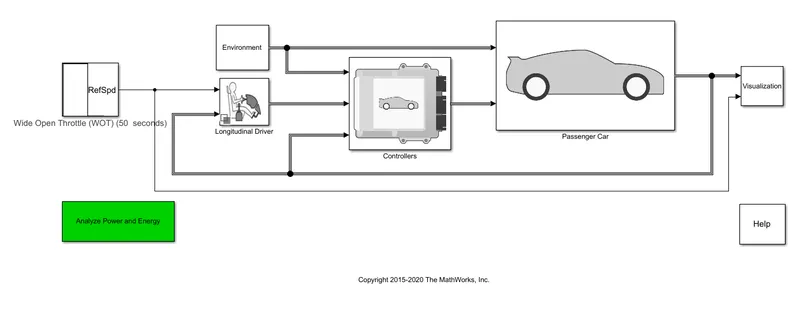
fig 3.3 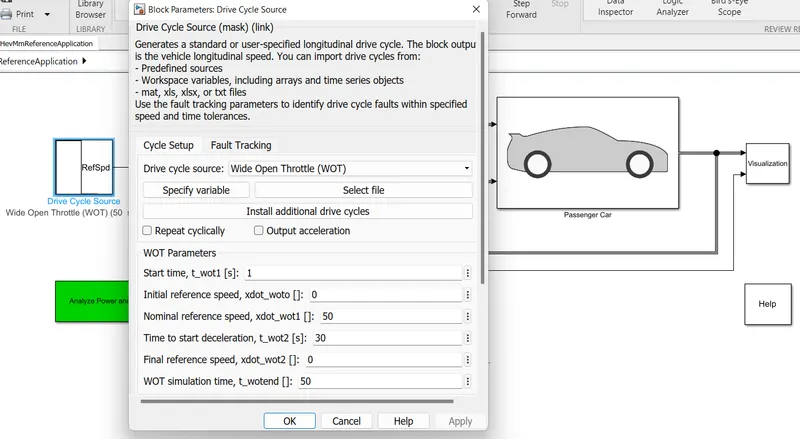 fig 3.4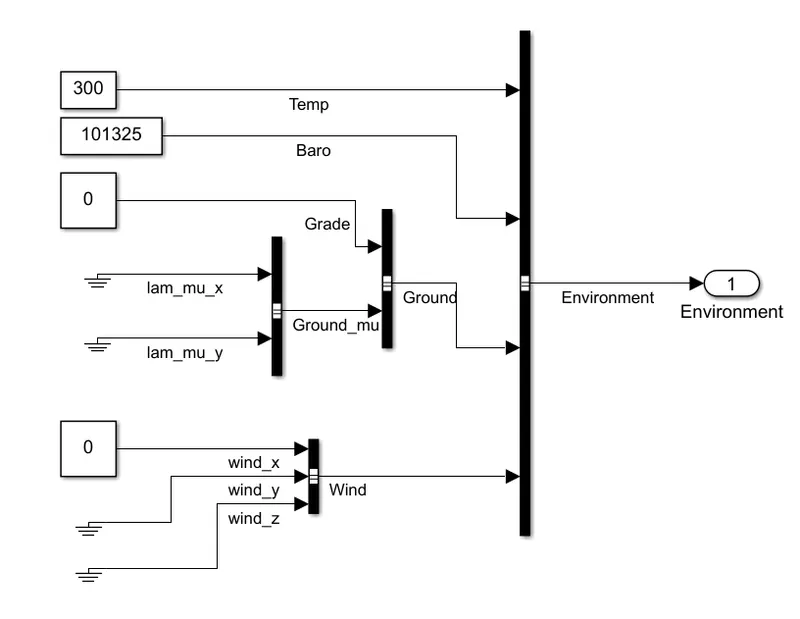
Here, the simulation is done for a HEV with WOT drive cycle, having the parameters; total cycle time= 50 sec, the top speed of the vehicle= 50 mph and time to start deceleration= 30 sec the default parameters are set up(fig 3.3). Inside the environment sub-system block, no change in gradeability and wind velocity (0) as in fig 3.4 , Then, after running the simulation with a stop time of 60 sec, six plots are obtained indicating trace velocity, battery current, speed of motor, engine and generator, battery SOC, torque of motor, engine and generator and US fuel economy parameters respectively (fig 3.5). Also, there is a cursor measurement enabling the better measurement and study of these six plots.
fig 3.5 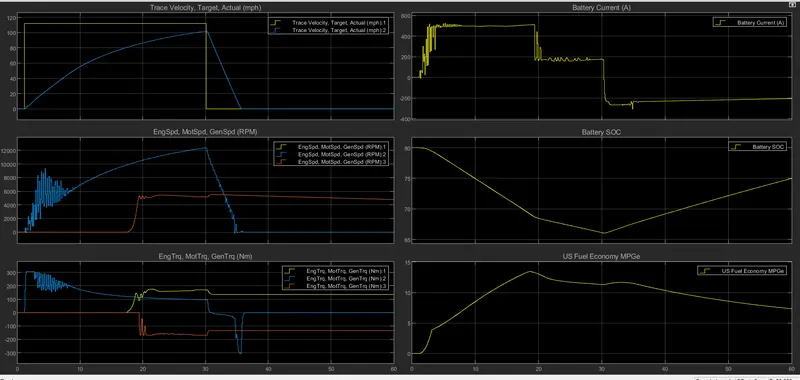
PLOT OBSERVATIONS :
- For the Trace velocity: target and actual velocity(mph) plot, the drive cycle used is wide open throttle(WOT), where the speed data input is given as a step signal of a magnitude of 110 mph approximatly for a time of 30 sec and becomes decelerates to 0 mph at 30 sec. Here, the trace velocity increases steeply from 0 at t= 1 sec to 100 mph at 30 sec and then decreases to 0 mph at 35.8 sec. Here, it is observed that the actual velocity is not matched with the target velocity mainly because of the limitations of the battery capacity and IC engine initial torque to propel the vehicle.
- For the Battery current(A) plot; it is observed that the maximum battery capacity is about 520 mph approximately, which makes the battery to provide more torque at the initial phase when compared to the IC engines.
- For the Engine speed, Motor speed and Generator speed (rpm) plot; motor speed increases steeply from 0 to 12200 rpm approximately and generator speed increases gradually from 0 to 5300 rpm at a time of 30 sec, while the IC engine gets stabilized at the 30 sec mark. Then, after 30 sec, the torque and the motor speeds reduces, while the IC engine is stabilized, which is supported by the battery discharge as well.
- In the Engine torque, Motor torque and Generator torque (N-m), it is seen that during braking, it is observed that the motor speed and torque is slumped but the engine torque remains the same. The motor torque and the battery values are dropped to negative values indicating regenerative braking process happening in the HEV vehicle.
- In the Battery SOC plot, it is observed that the BMS in the HEV vehicle is designed in such a way that the battery state of charge(SOC) does not go below 66.48%, after which the battery gets charged through either IC engine or plug-in.
- The US fuel economy(in MPGe) shows miles/gallon equivalent to run the vehicle, where the fuel needs is high as the vehicle speed is high and the fuel requirement decreases as the vehicle decelerates.
Now we have changed the gradeability to 5% and wind velocity to 10 m/s as shown in fig 3.6 , Then , the following resulting points are given in fig 3.7
fig 3.6 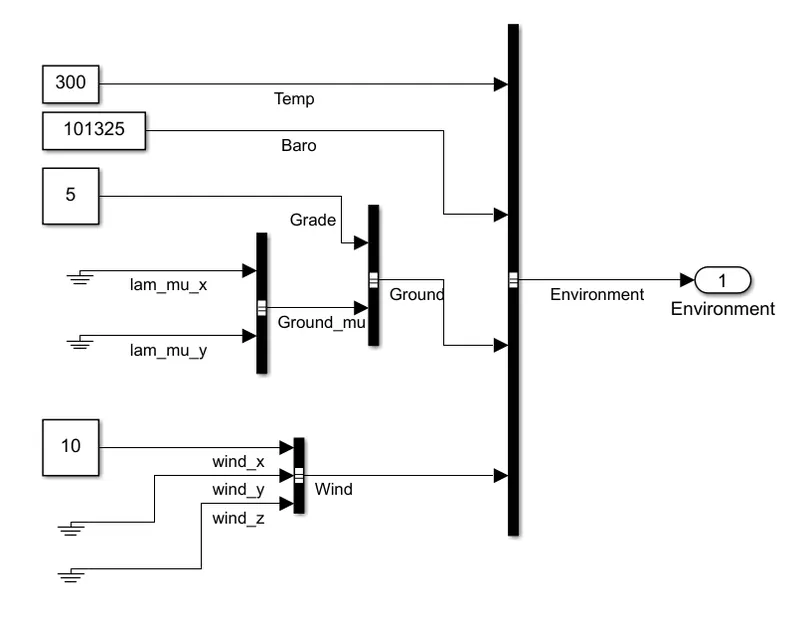
fig 3.7 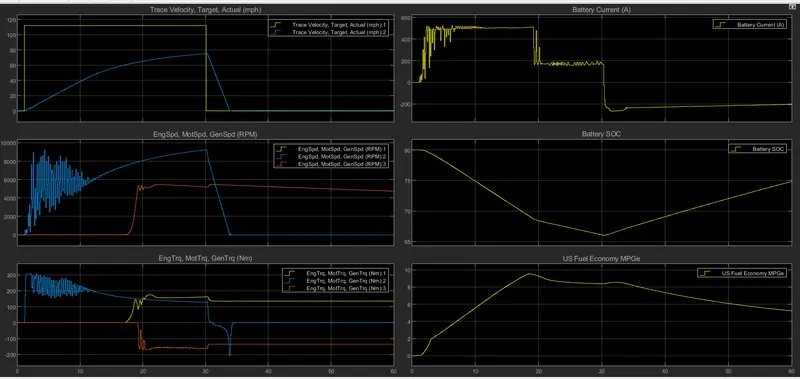
PLOT OBSERAVATIONS :
- When compared to the previous results in the trace velocity plot, the actual velocity(mph) has drastically decreased from 110 mph to 73 mph at 30 sec, due to the change in gradeability and wind velocity from 0 to 5 and 10 respectively.
- The fuel efficiency has also dropped significantly, as compared to the previous results in the US fuel economy(in MPGe) block.
- The rest of the plots are parameters are the same.
4. Keeping all other parameters same, compare the simulated results of hybrid and pure electric powertrains.
Here, the two models: hybrid and pure electric powertrains are compared by keeping all the parameters same, ie we select all the parameters as default values: no changes in gradeability and wind velocity (0), except the drive cycle is selected as WOT drive cycle with the total cycle time= 50 sec, the top speed of the vehicle= 50 mph and time to start deceleration= 30 sec. In EVs, there is no IC engine, no separate motor and generator because in the case of EV, the motor itself functions as a generator during regenerative braking mode. Hence, one set of gear is sufficient for EVs rather than in HEVs. The following EV model autoblkEvStart(fig 4.1) is selected.
fig 4.1 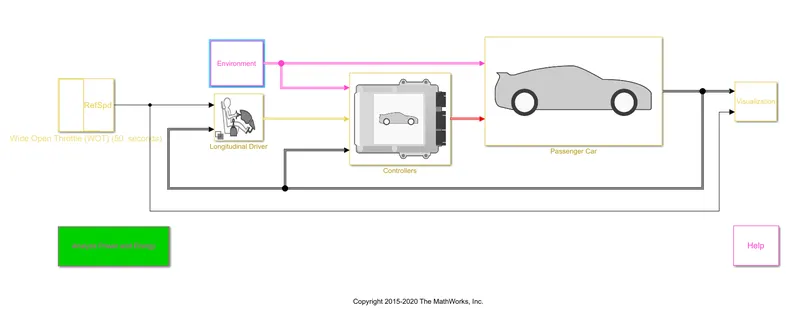
fig 4.2 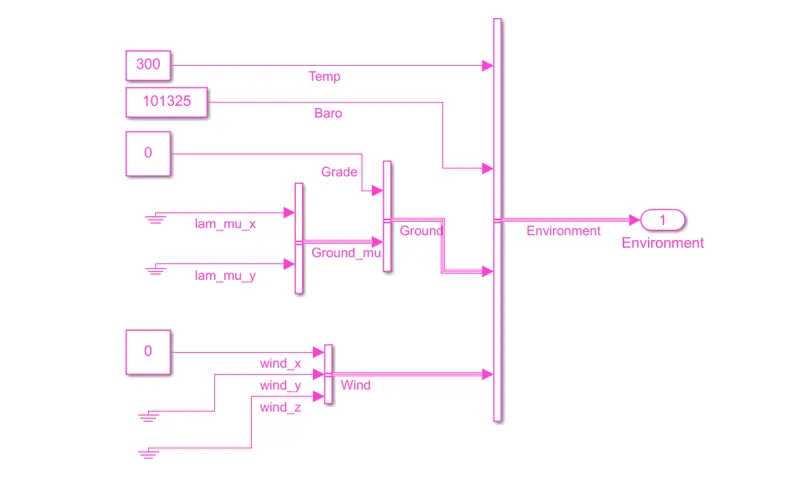
The results of the simulation of the above model are given below in fig 4.3
fig 4.3 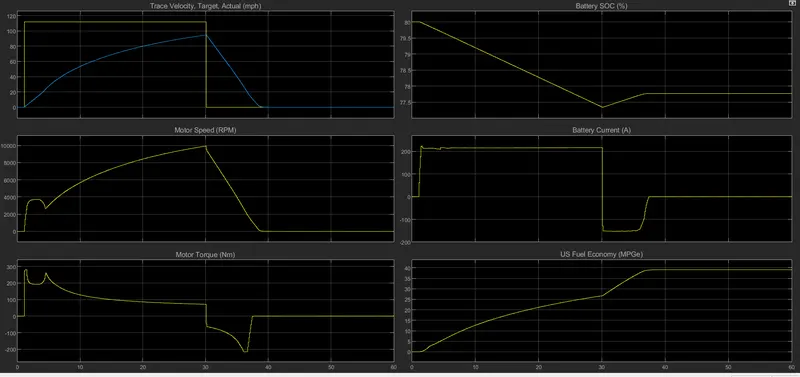
PLOT OBSERVATIONS :
- For the Trace velocity: target and actual velocity(mph) plot, the graph seems almost similar to that of the HEV model, which is mainly because of the maximum discharge limit from the battery, which is 200A.
- For Motor speed(rpm) plot, as battery and motor are the only driving units of this EV, then the maximum Motor speed(in rpm) is approximately 10000 rpm which is less than the maximum Motor speed of the HEV vehicle which was 12200 rpm approximately.
- For the Motor torque(N-m) plot, the motor torque at initial level of an EV (about 280 N-m) is less than that of the HEV (approximately 300 N-m), as the weight of the EVs is lesser than the HEVs.
- Here, the fuel economy is higher in EVs than as compared to the HEVs.
- The rest of the plots and parameters are the same as in HEVs.
- The pure EV drive achieves less Top Speed compared with HEV.
- Instantanous Torque at the start is more in EV compared with HEV or conventional vehicles.
- The conventional HEV uses Lead Acid Bttery whereas EV uses Lithium iron Battery which is more potential.
- Motor used in EV must be of more capacity than the one used in HEV.
Here, the observation and the result of simulationof HEVs with WOT drive cycle with the total cycle time= 50 sec, the top speed of the vehicle= 50 mph and time to start deceleration= 30 sec and keeping all the parameters same as in EVs, ie default values (gradeability and wind velocity = 0) is given with the necessary figures is given in the 3rd question above as reference of this comparison with EVs.