Week-4 Challenge WOT Condition Part-2
1. Difference Between Mapped and Dynamic Model
| MAPPED MODEL | DYNAMIC MODEL |
| The model uses a set of steady-state lookup tables to characterize engine performance. | The model decomposes the engine behavior into engine characteristics that are separated into lower-level components. |
| The tables provide overall engine characteristics, including actual torque, fuel flow rate, BSFC, and engine-out exhaust emissions. | By combining components in this way, the models capture the dynamic effects. |
| Mapped engine models are suitable for analysis and design activities that do not require engine subsystem dynamic characteristics. | Dynamic engine models are suitable for designing control, estimator, and diagnostic algorithms that depend on dynamic subsystem states, for example, in closed-loop AFR control algorithm development |
To change between mapped & dynamic model:
- Open the powertrain module blockset for the required vehicle.
- Click on passenger car/ vehicle block and select electric plant or engine.
- Right-click on Engine/ EV motor/ generator based on vehicle model and select variant.
- Under variant, scroll to label model active choice and choose mapped or dynamic for the required calculation.
2. Miles Per Gallon
Kilowatt-hours is the standard energy unit for electricity. In simplified terms, if an electric vehicle can travel 100 miles on 33.7 kWh of electricity, the EPA rates it at 100 MPGe. As you can see, this would be a very efficient vehicle, because a gas car would have to travel 100 miles per gallon to be equivalent. One gallon of fuel is 3.785 litres of gasoline.
BLOCK DIAGRAM:
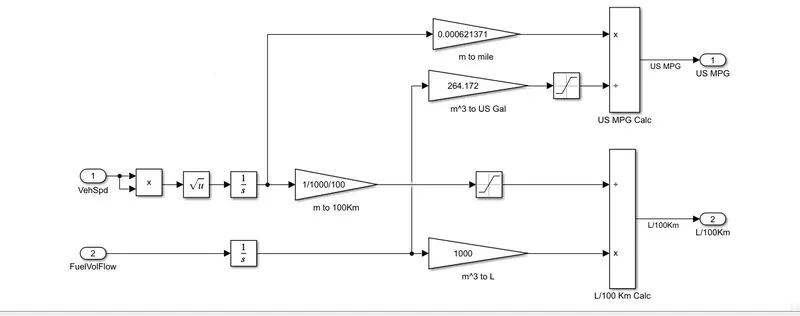
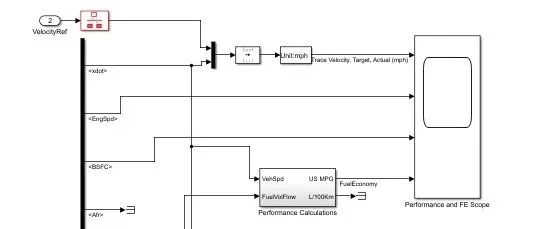
- The above block diagram represents the powertrain blockset of the EV vehicle to calculate the miles per gallon. Given input parameters are fuel flow, vehicle speed & battery power to find the fuel efficiency of the vehicle.
- Distance is calculated by integrating the vehicle speed with respect to time and converted into miles.
- Battery power is consumed by which the total distance is covered & converting from watt into Kw.
- The volume flow rate of the fuel is expressed & converted into gallons & integrated with respect to time for calculating the volume of fuel.
Thus Miles per Gallon is calculated for the performance of the fuel economy of the car or commercial vehicle. In simple terms, if your car performs at 40mpg it means that, on average, you will be able to drive 40 miles on every gallon of petrol that you put in the tank.
Factors that are to be considered for the model fuel flow;
- the cost of acquiring and using the fuel for each specific situation.
- the energy content of the fuel type being considered.
- the availability of the type of fuel source wanted.
- How safe it will be to use the fuel under consideration.
3) HEV REFERENCE APPLICATION
Hybrid Electric Vehicles are powered by an internal combustion engine in combination with one or more electric motors that use energy stored in batteries. HEVs combine the benefits of high fuel economy and low tailpipe emissions with the power and range of conventional vehicles.
POWER TRAIN CONFIGURATION:
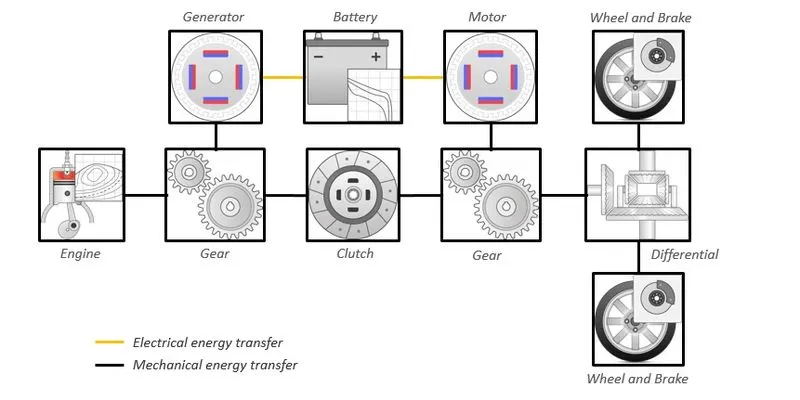
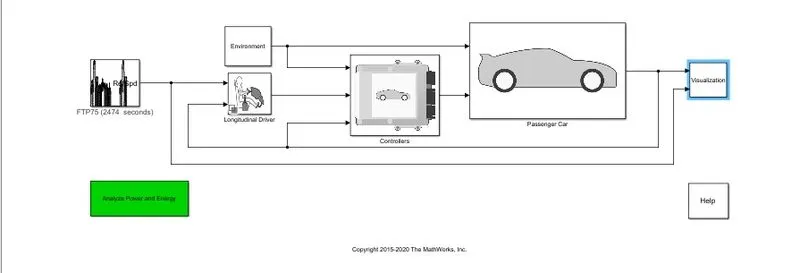
Once the model is selected with wide-open throttle drive cycle, we run the simulation where the input parameters are fed into the drive cycle.
WOT Drivecycle inputs:
Total simulation time = 100s
Nominal Speed = 50m/s
Deceleration time = 50s
Case 1- Default grade = 0 degree and wind velocity = 0 m/s
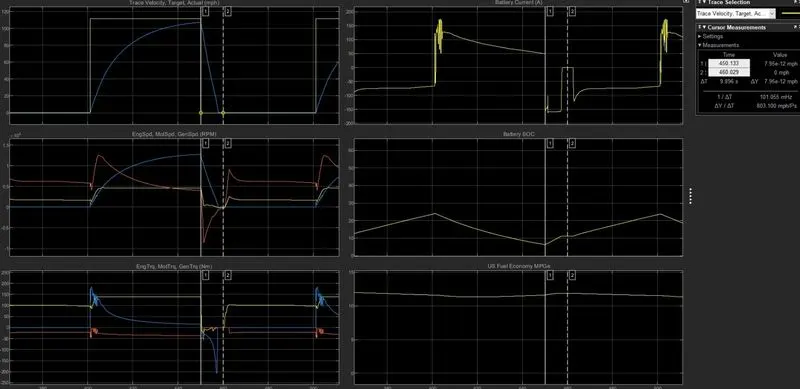
Case 2 - Grade=5 degrees, wind velocity =10m/s
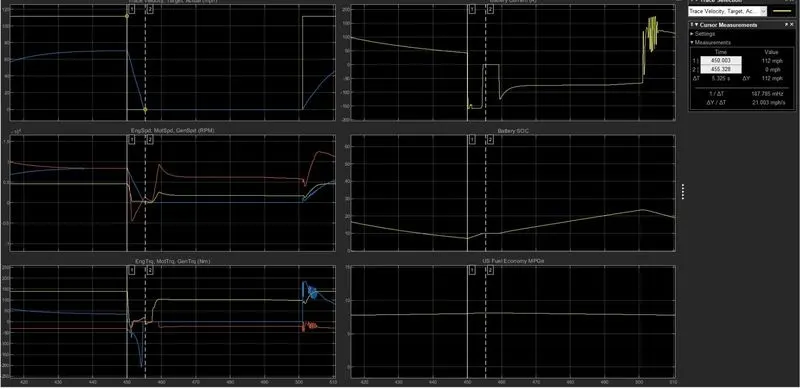
Results comparison:
| Case 1 | Case 2 | |
| Grade(deg) | 0 | 5 |
| Wind Velocity (m/s) | 0 | 10 |
| Maximum Speed (Mph) | 112 | 86.5 |
| Deceleration time (s) | 8.765 | 5.45 |
| Max Engine Torque (Nm) | 140 | 140 |
| Peak Motor Torque (Nm) | 200 | 200 |
|
Max Battery Current drawn (A) |
168 | 168 |
| Battery SOC% | 60% to 30% | 60% to 25% |
|
Fuel Economy (MPG) |
13.5 | 9.2 |
Observations:
- A visible difference is observed between the actual trace velocity curve and the input trace velocity curve due to the limitation of power available from the energy source.
- The maximum speed achieved is lower in case 2 because of the gradient slope considered and also the wind resistance.
- Since more power from the energy source is required to overcome these resistances, the battery SOC and the fuel economy are decreased.
4. Hybrid and Pure Electric Powertrains
EV reference application blockset -
PURE ELECTRIC VEHICLE:
A battery electric vehicle (BEV), pure electric vehicle, only electric vehicle or all-electric vehicle is a type of electric vehicle (EV) that exclusively uses chemical energy stored in rechargeable battery packs, with no secondary source of propulsion (e.g. hydrogen fuel cell, internal combustion engine, etc.)
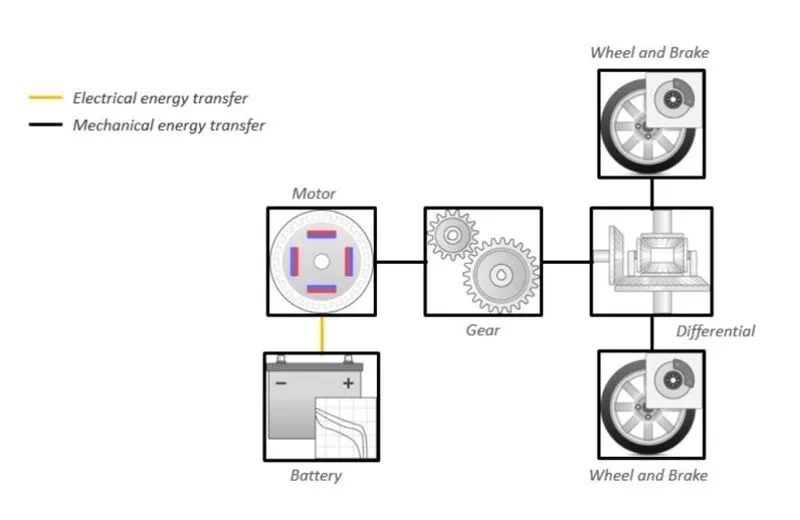
POWER TRAIN CONFIGURATION:
Case 3 - Grade = 5 degrees, wind velocity =10m/s
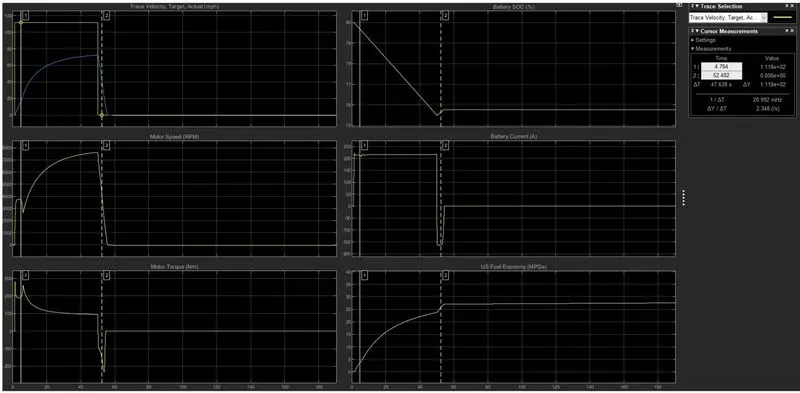
Results comparison:
| HEV | EV | |
| Case 2 | Case 3 | |
| Grade (deg) | 5 | 5 |
| Wind Velocity (m/s) | 10 | 10 |
| Maximum Speed (Mph) | 86.5 | 72 |
|
Deceleration time (s) |
5.45 | 5.8 |
| Max Engine Torque (Nm) | 140 | NA |
| Peak Motor Torque (Nm) | 200 | 280 |
| Max Battery Current drawn (A) | 168 | 217 |
| Battery SOC% | 60% to 25% | 80% to 75% |
|
Fuel Economy (MPG) |
9.2 | 27 |
Observations:
- The electric powertrain achieves a lower top speed when compared to an HEV powertrain.
- Since the motor is the only propulsion source in an EV powertrain, the motor needs higher rated power and generate the instantaneous start up torque to propel the vehicle.
- The conventional HEV's use lead acid battery whereas the EV's use lithium ion cells which have more energy density.
- EV has a superior fuel economy than a conventional HEV.