Week-4 Challenge WOT Condition Part-2
AIM :
- What is the difference between mapped and dynamic model of engine, motor and generator? How can you change model type?
- How does the model calculate miles per gallon? Which factors are considered to model fuel flow?
- Run the HEV ReferenceApplication with WOT drive cycle. Change the grade and wind velocity in the environment block. Comment on the results.
- Keeping all other parameters same, compare the simulated results of hybrid and pure electric powertrains.
1: What is the difference between mapped and dynamic model of engine, motor and generator? How can you change model type .
1: mapped engine : mapped engine is the default setting in the powertrains blockset . it is used to measure the performance parameter of vehical by using standard lookup tables which is prefered by the system. this type of models is less accurate .
the lookup tables values is based on parameters are brake torque , commanded torque , and engine speed .if any other parameter is engine temperature which is taken from the lookup tables it is the function of the temperature parameter .
the data is extracted from the lookup table air mass flow, fuel flow , emission data , engine speed and engine efficiency. the data is used to find out the other parameter which is needed by end users .
2: Dynamic engine : this type of model is used realtime data is fed by the users during run time of simulations . this type of models is more accurate than that of mapped models . this type of model is when vehical subsystem required data . we can calculate brake torque, mas flow , gas mass flow . exhuast emmission .
3: mapped motor : this type of models is work on torque control mode . this type of motor where the faster simulation is reqiured .it does not have ' knowlwdge of motor parameter , and the output and referance value is compare changes are made inputs torque , the torque and speed are specified , maximum motor power and torque are defined .
4: Dyanamic motor : in this case we used three phase interior permanant magnets moving motor is used. its uses three phase input voltage . which is used to regulate individual phase current allowing to control the motor torque speed the block is used when the users know the parameter used into simulations , this type of system is more accurte.
5:mapped genrators : the mapped genrator is similar to other block the most of the data is taken from the lookup table corresponding to inputs parameter . simulation time is less .
6: Dynamic genrators : the dyamic genratiors are involve user entering manually the data during run time for particular applications . results take time and it is more accurate .
how can you change your mapped to dynamic model :
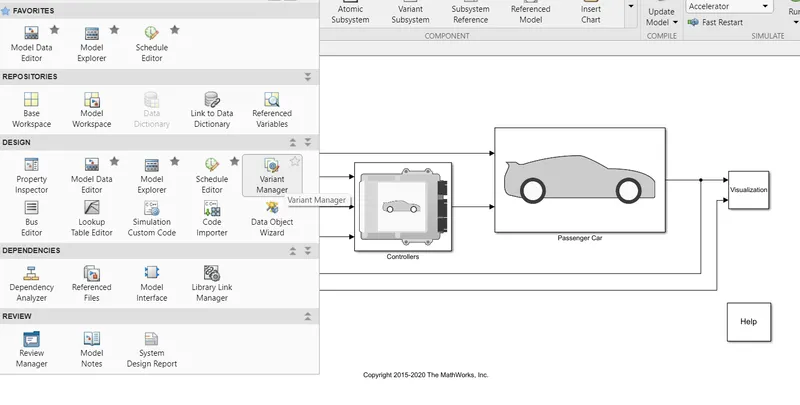
suppose we have to change genrator mapped to dynamic select the genrator dynamic click double , go to label active choice which is shown below , then double click on Gendynamics .
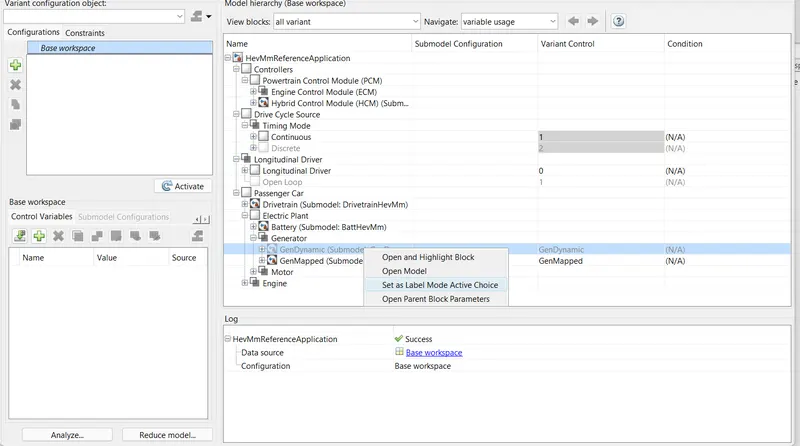
this procedure will be same in case of motor or engine .
2 :How does the model calculate miles per gallon? Which factors are considered to model fuel flow?
MPGe is defined as mile per gallon equivalant EPGe was introduced by by EPA envernmental protection agency in 2010 , means to compare amount of energy consumed by vehical using alternative fuel and gas power engine
MEPe is distance travel of car 1 gallons = 33.7 kwh electricity .
1: In case of electric vehicals as per US standard .
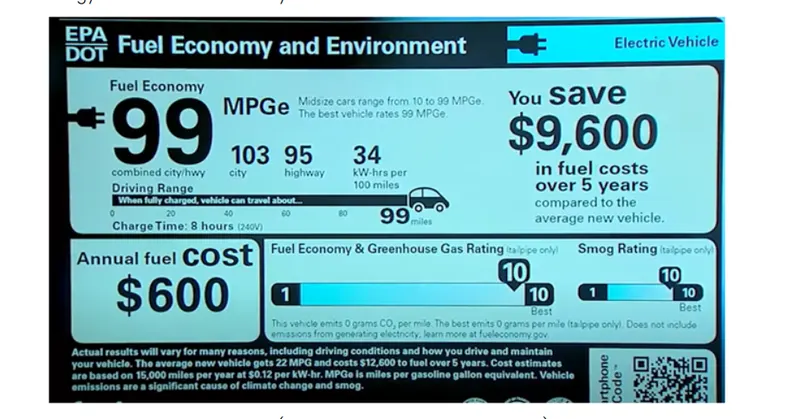
this rating is given by EPA. here only one fuel economy is given . its run only electicity as the battery electric vehicals .
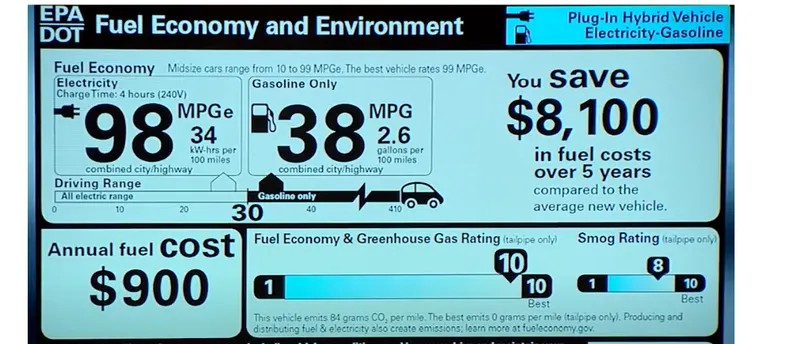
above rating has two value of PHEV one is for pure Ev mode and another is for PHEV mode.
batter capacity of vehical is 4.258 miles per kwh .
miles/kwh*33.7kwh/gallon
=4.258*33.7 kwh/gallon
=143.25 MPGe
block of performance parameter
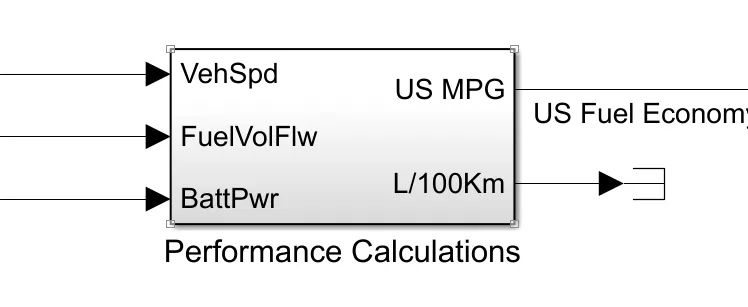
the three inputs of vehical speed , fuel volume ,battery power
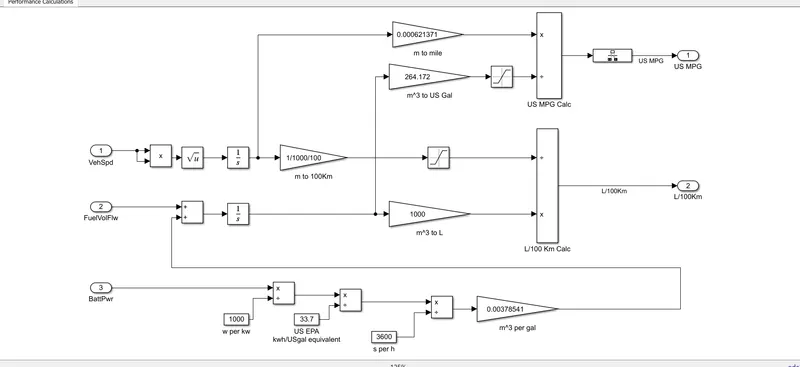
so battery power is first convert w/1000 which devides by 33.7 kwh. the fuel equivalent of battery is which is added with the fuel flow , vehical speed can be calculte by using time and distance travel in miles
this distance are converted into miles , the disatnce can be measured in m^3 in miles .
3:Run the HEV ReferenceApplication with WOT drive cycle. Change the grade and wind velocity in the environment block. Comment on the results.
here we change drive cycle FTP75 to wide open trottle (WOT)
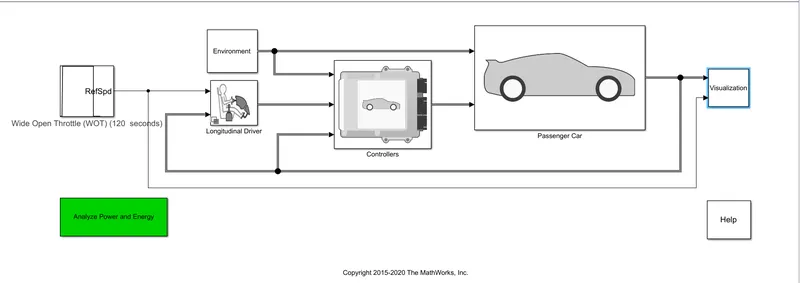
following parameter are change in widw open trottle cycle
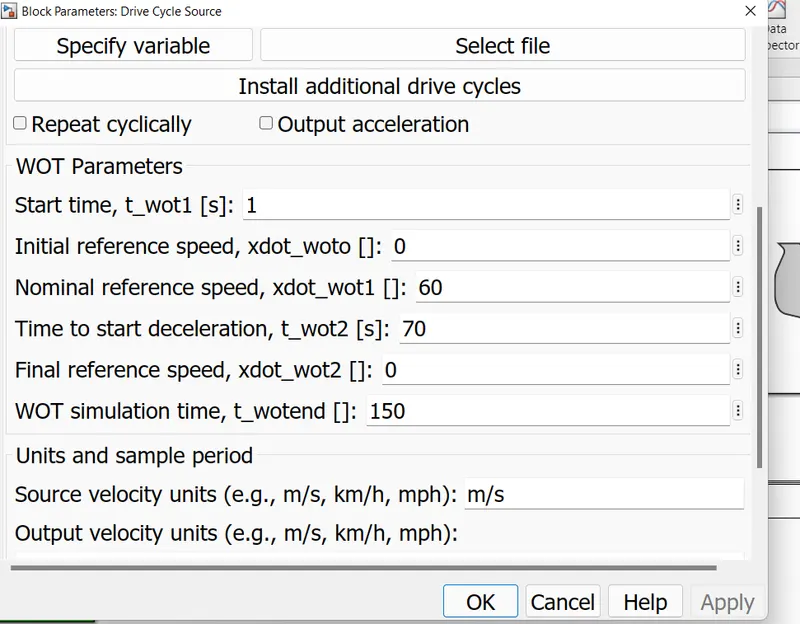
Here we not change envernment factor grade and wind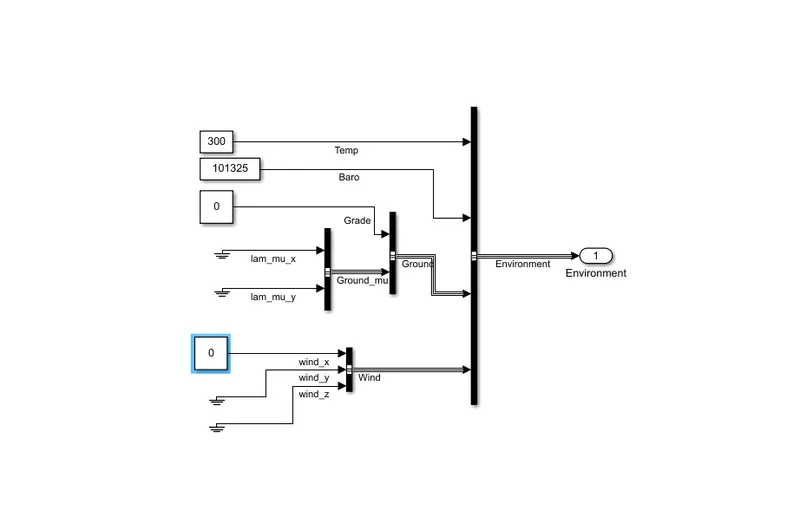
after running the simulations resultant of gragh shown
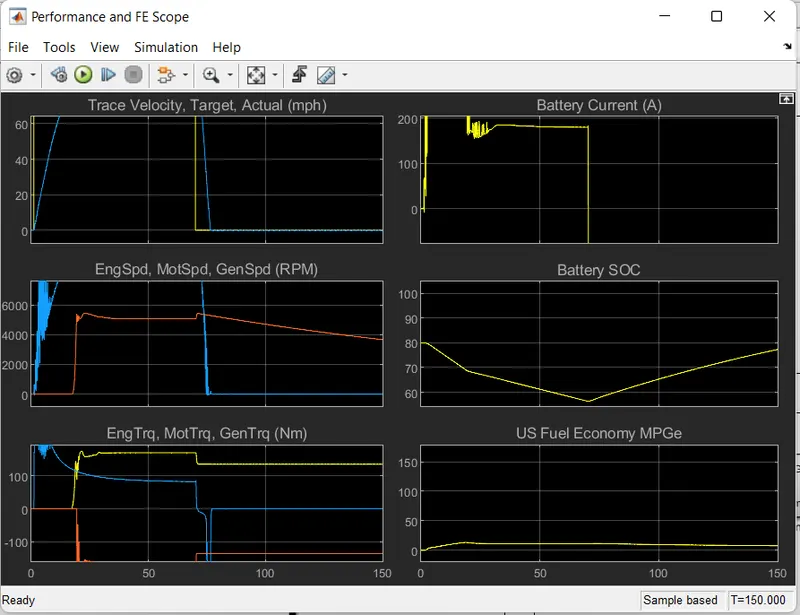
3 : run the simulation while changing the parameter grade and wind velocity .
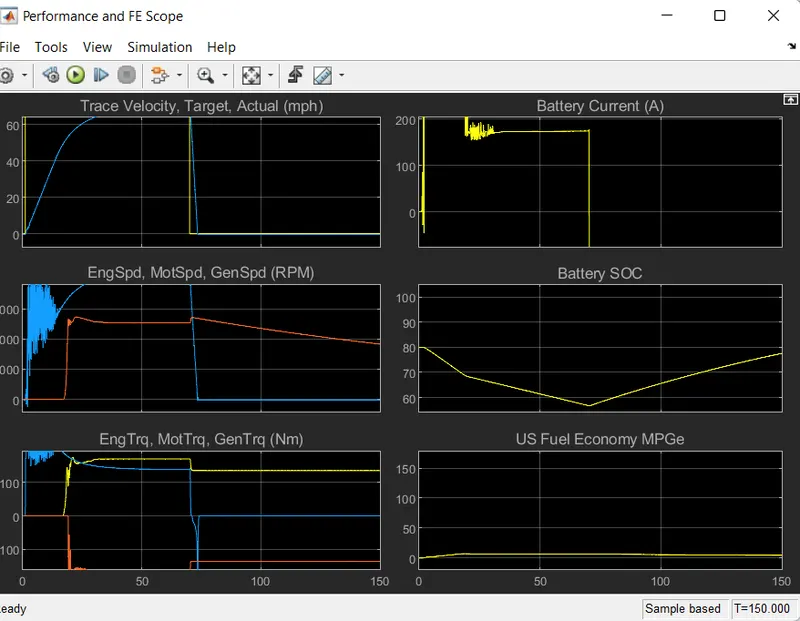
in this case grade 5 and wind velocity 1
Results as follows :
case 1 peak velocity is achived at starting while in case 2 peak velocity is achived at after 30 sec due to resistance and grade offer the velocity will be change
battery current goes negative after near about 20 sec while comparing in case the increased in value of wind resistance the battery deplect much faster goes into charging mode .
the evident from genrator torque spliking with neagative value battery current
due to the higher load the battery soc graph is deplected faster in case and 2 nature of curve is steeper in both case 1 and case 2. battery soc is low as compare to case 1
maximum fuel efficiency attended by vehicals at the speed of 70 to 73 mpge .
4:Keeping all other parameters same, compare the simulated results of hybrid and pure electric powertrains.
the hybrid consist of battery pack, engine, power converter , motor , genrator transmitions can be run in series hybrid , parallel hybrid , or series - parallel configurations , depending upon the applications archetecture . due to excistance of two power sources hev can genrate energy more robosty and relibility .
The electric power train consist of battery pack , motor , and transmitions .
only the source of battery pack which can be lead under the performance high load uses screnerio as well as reduce range uses .
we will running both configuration WOT drive cycle simulations to compare performance of HEV powertrain
EV powertrain
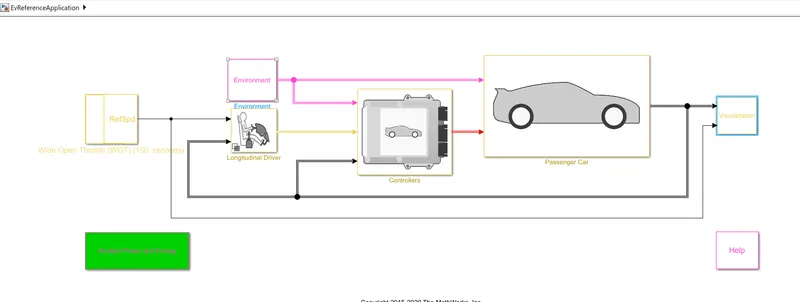
outputs are shown below
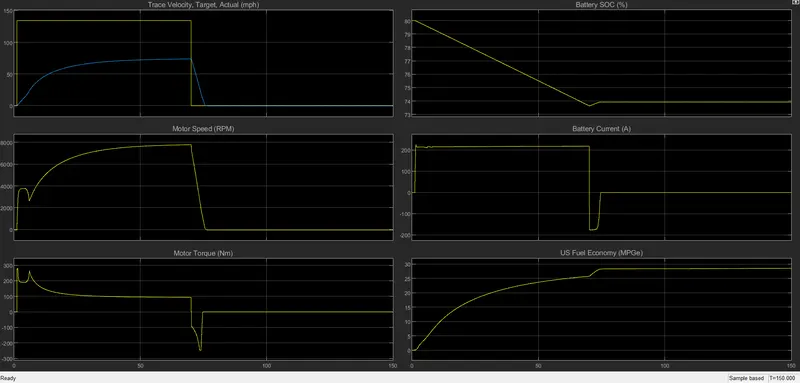
0bservations are belows mentions
peak velocity achived is 43 sec
Deaccelerations occurs in 0 to 6 sec
motor speed is about 7000 rpm
motor torque is about 242 rpm
battery deplect at 2.84
peak battery current is 213 rpm
Hev powertrain
observations actual velocity in case 1 is 134 at 42 sec while in case 2, value is 79.3
peak motor current is 500
in case 1 - torque increase at value of 34 n/m while in case 2 and 3 is somewhat variations .
maximum fuel efficency attains by vehical is 7.52 hz .
conclusions : 1 - The difference betn the hev and ev result and capture based on simulations results
2:hev powertrains genrate high power as compare to the EV powertrains .
3 : Ev power trains high speedof motor as compare to hev power trains
4 : economy of Ev power train is much better than that of HEV powertrain the economy is drop when the engine is turn on and take over the powergenrations and charge the battery .