Week-4 Challenge WOT Condition Part-2
1,
Mapped Engine :
Mapped Engine is used to measure the performance parameters of the vehicle by using standard lookup tables. This is less accurate. The lookup table values are based on the Brake torque, Command torque and Engine speed.
Dynamic Engine :
Dynamic Engine model is uses the real time data fed by the user at run time for modelling. This model is more accurate than mapped engine model. This type of model used when the data of subsystems of a vehicle is required.
Mapped Motor :
This type of motor is used when the user requires a faster simulation and does not have any knowledge of motor parameters. This model have less accuracy.
Dynamic Motor :
Here a three phase Permanant Magnet Synchronous Motor (PMSM) is used. This motor block is used when the user knows what parameters are used in the particular simulations. This type of motor have more accuracy.
Mapped Generator :
It is similiar as other mapped blocks. Most of the data required are taken from the lookup tables corresponding to the given input parameters. This type is less accurate and requires less simulation time.
Dynamic Generator :
Here the user entering the parameters manually during the run time for their particular applications. This type is more accurate and requires more time for simulation.
Change the model from mapped to dynamic :
To change model from mapped to dynamic, first select the modelling from above bar and click on the Variant manager as shown below,
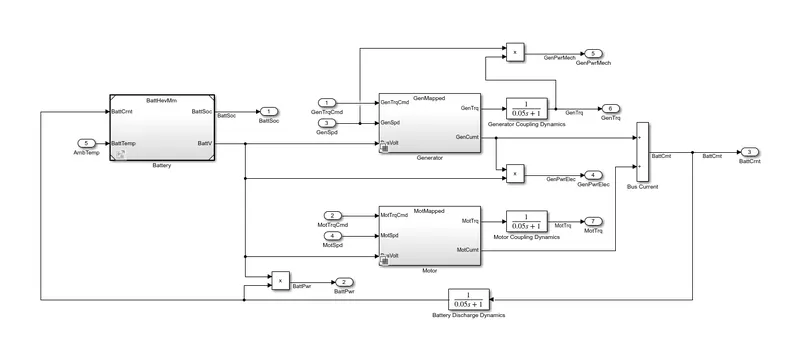
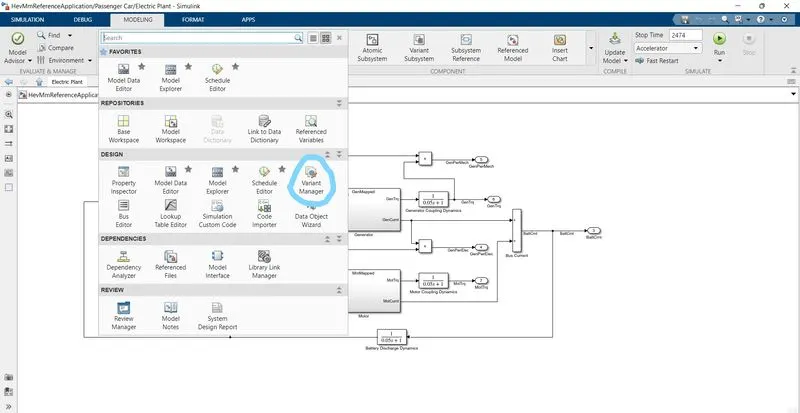
Suppose that we are changing the Generator block from the mapped to Dynamic. Then by clicking variant manager we will get another window, from that window we can load the dynamic block.

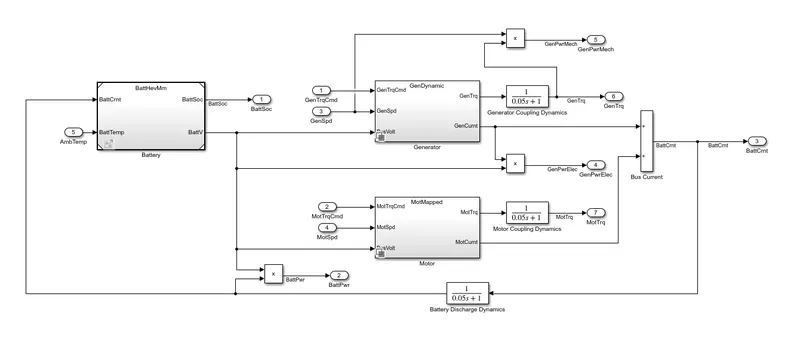
This process can be repeated for the Motor and Engine.
2,
The fuel efficiency of the hybrid electric vehicle is calculated via Miles per gallon equivalent (MPGe). One gallon of gas has same energy of 33.7kwh of electricity. The MPGe rating is the number of miles your car can drive per gallon of gas. It is calculated by figuring out the number of miles a vehicle can go using the same energy content as gallon of gas.
Open the performance calculation block,
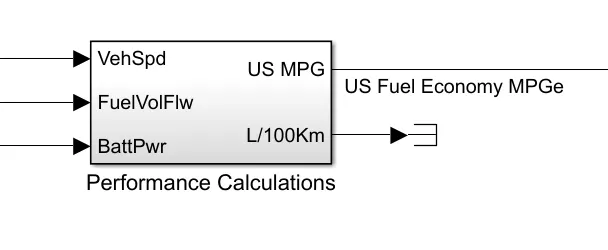
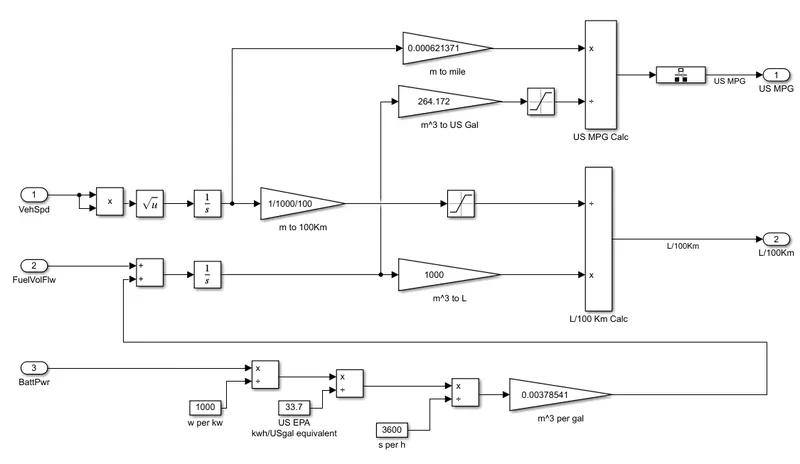
Here Three Inputs are considered for model fuel flow.
- Vehicle speed
- Fuel flow
- Battery power
The vehicle speed input is in m/s which is converted to miles by multiplying with 0.000621371.
The fuel is converted from m^3 into US gallons by multiplying with 264.172.
The battery value is initially converted from watts to kwh by dividing with 1000 and then to gallon equivalent dividing by 33.7. Then divide with 3600 to get in per seconds and finally multiply with 0.0037854 to get value in cubic meter per gallons.
3,
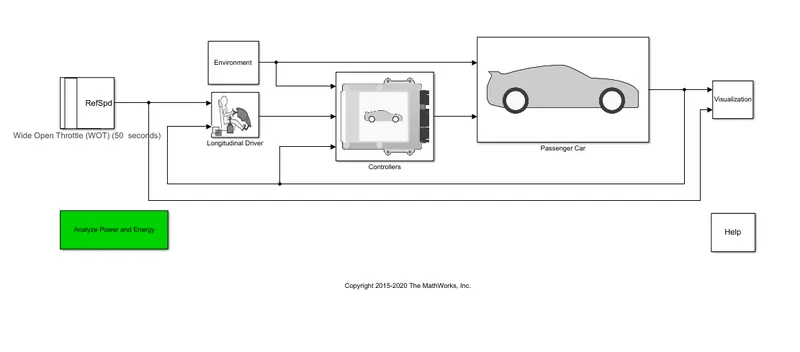
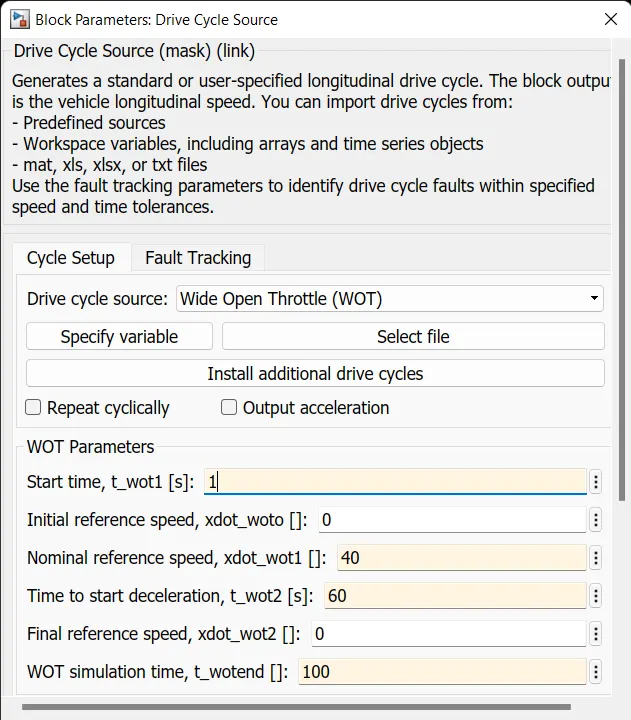
Use the command 'autoblkHevStart' to open the HEV reference application. Click on the drive cycle block and change the drive cycle into WOT condition and also change other parameters too.
Then select the Environment block and change the grade and wind velocity,
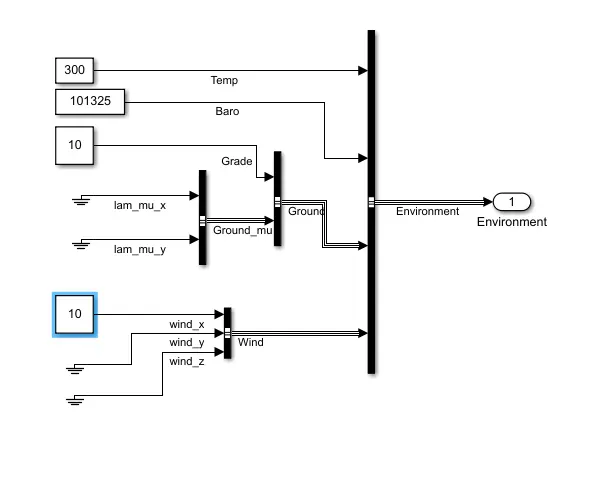
Now run the simulink for obtaining the results. Click on the Visualization block and click on the performance scope for obtaining the graphical results.
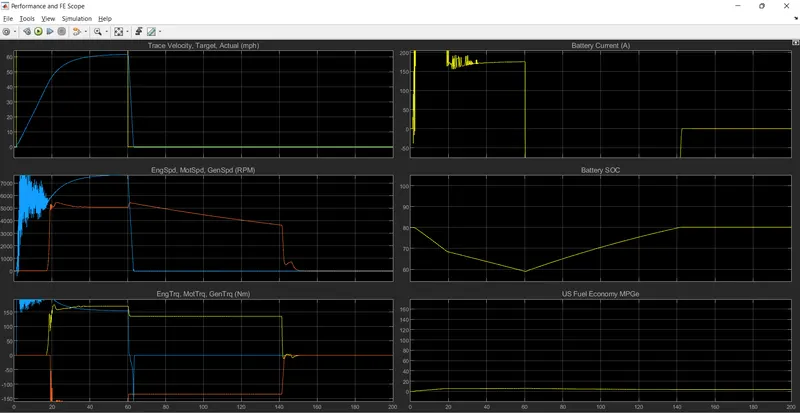
From the above graph we can conclude that,
Trace velocity,target and actual graph ;
The yellow line is desired path and blue line is actual path. It shows that the battery power is not enough to meet the requirements of the grade and wind velocity.
Battery current graph ;
The battery current increases when vehicle accelerate, the battery current become constant when the velocity is constant and the battery current become negetive when the deceleration occure, that is regenerative braking.
Battery SoC ;
Battery SoC keep depleting till regenerative braking starts then increases.
Engine, Motor and Generator speed ;
Initially motor is used to start the vehicle and later (red) generator starts to charge battery when SoC drops below 70%.
Engine, Motor and Generator torque ;
Initially motor torque is high (blue) then engine starts later stage (yellow). Generator torque is negetive (red) as it charging the battery.
4,
Type the command 'autoblkEvStart' a window with blocks open then select drive cycle WoT and change other parameters. From environment block set grade and wind velocity as same as previous question.
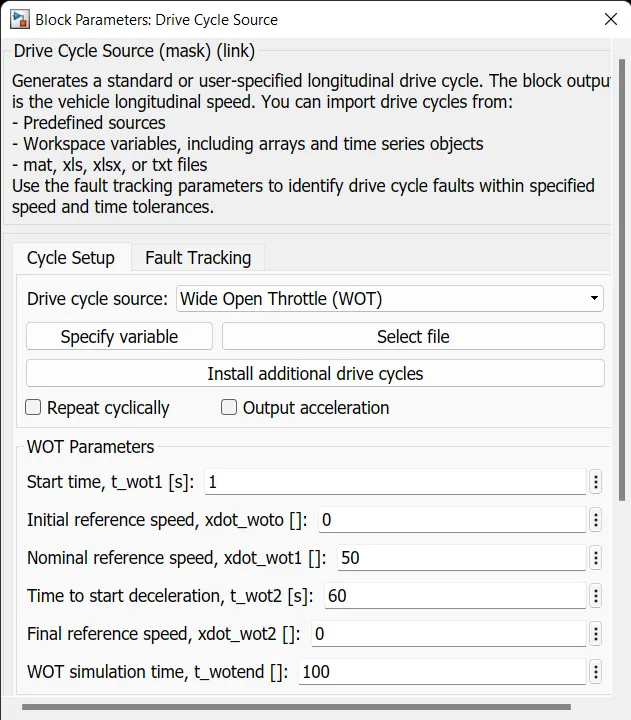
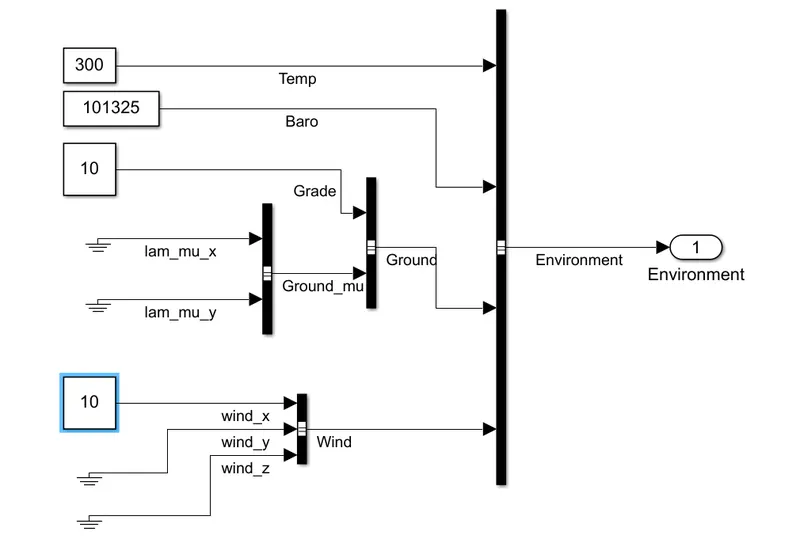
Now run the simulation and analyze by clicking on performance scope in the visualization block.
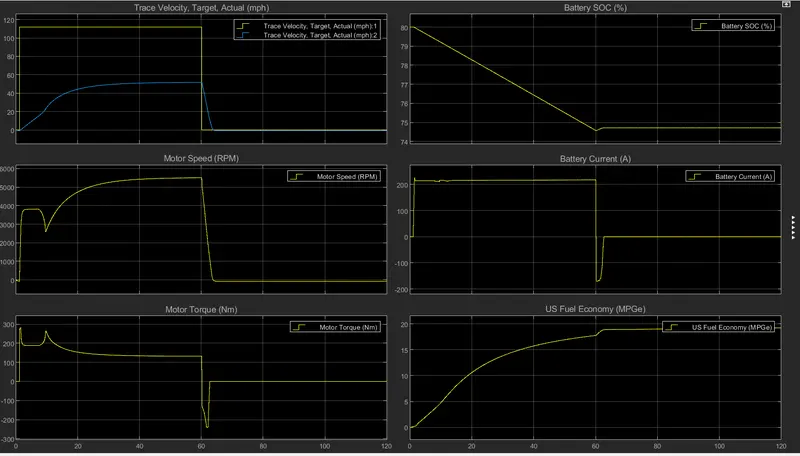
- Target and actual velocity graph is almost same in both Hev and Ev, this is because motor only used in that range for both cases.
- Battery current increases initially and then decreases. During deceleration its seen that negetive current flows for a longer time in HEV as compared to EV. So regenerative braking is more aggressive in Hev.
- SoC improvement is more in Hev than in Ev. This is because of same point mentioned above.
- Motor torque and speed are stable in Ev but are Fluctuating a lot at starting of Hev. Peak RPM of motor in Ev is less than Hev.
- Fuel economy of Ev is significantly greater than Hev. This is because electric motor is more efficient than engine.