Week-4 Challenge WOT Condition Part-2
Ans1: The difference between mapped and dynamic model of engine is that, the motor and generator in mapped model is where data point are pre define in lookup tables. whereas in dynamic model for components like permanent magnet motor, VSI, PMSM real-time inputs are given to Permanent Magnet motor to work accordingly
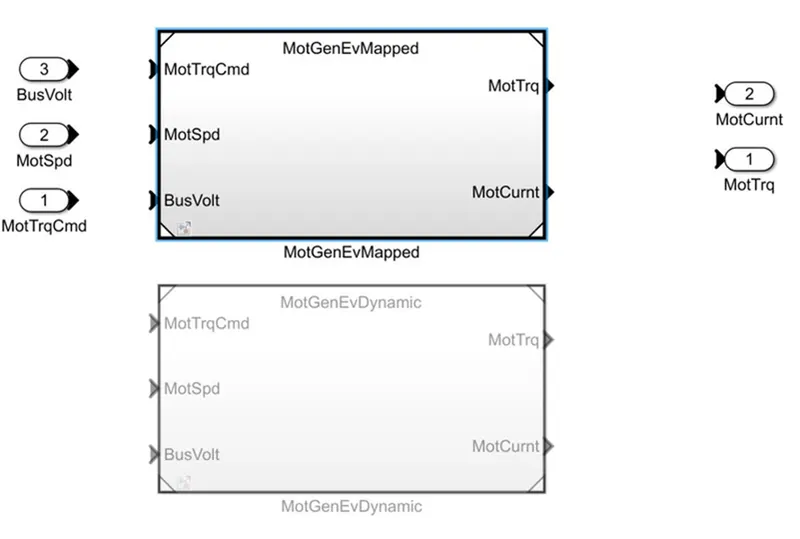
The model can be simply changed by right clicking on MotGenEV block select variant and change model type according to requirement.
: The powertrain blockset has a model thats calculate model miles per gallon.
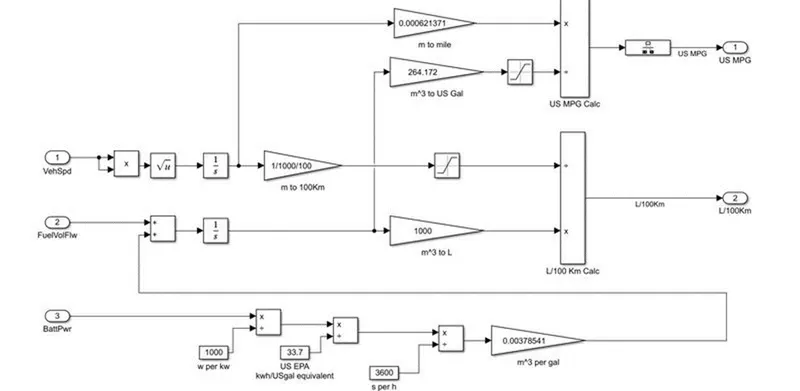
First vehicle speed convert into distance by integrating with time. Then fuel flow is integrating and convert into volume & by multiply by 1000 to get it in litres.
- By comparing these two results we can get the amount of litre consumed to Run for 100km.
- The power is converted to kw by dividing with 1000. Then we convert power into energy by multiplying with the time into KWh.
- Then we convert the energy from KWh to equivalent energy of by dividing US EPA 33.7. after that convert hrs to sec by dividing 3600.
- Then multiply with 0.00378541 we convert US gallon per sec to volume of fuel flow m^3 per gallon. this ouput is given to input of battery energy equivalent.
- The last step is input from vehicle speed i.e. distance is converted to by multiplying with 0.000621371. then the input from fuel flow is converted into US gal by multiplying 264.172
- The two inputs miles converted and equivalent US gallon iss further divided and result got in Miles / Gallon.
The factors considered to model fuel flow are Vehicle speed, Fuel volume flow and Battery power.
Ans3: The simulation model HEV ReferenceApplication are as follows
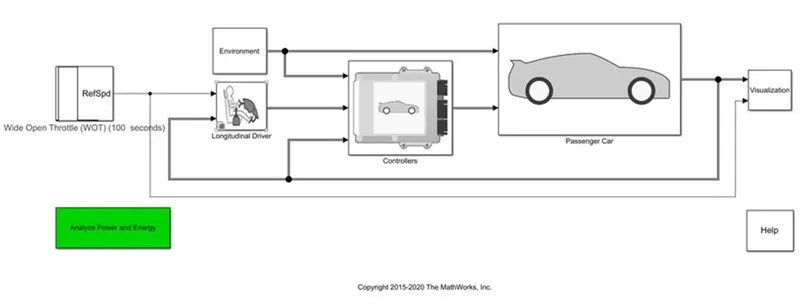
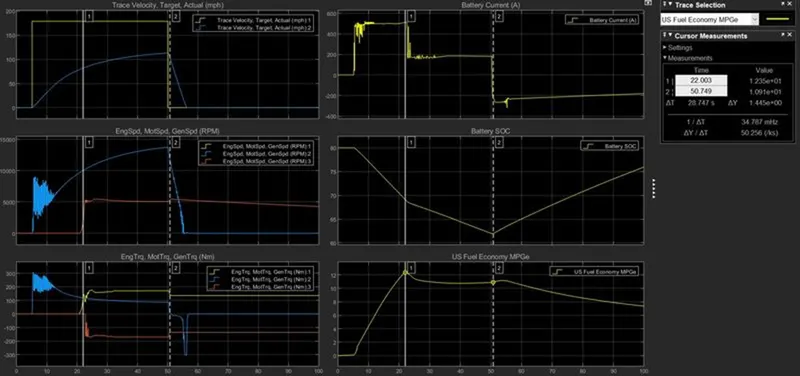
- Select drive cycle to Wide open throttle.
- Add nominal reference speed 80, time to start deceleration 50 and WOT simulation time is 100sec
- Run simulations for 100sec without changing environmental parameters and see result.
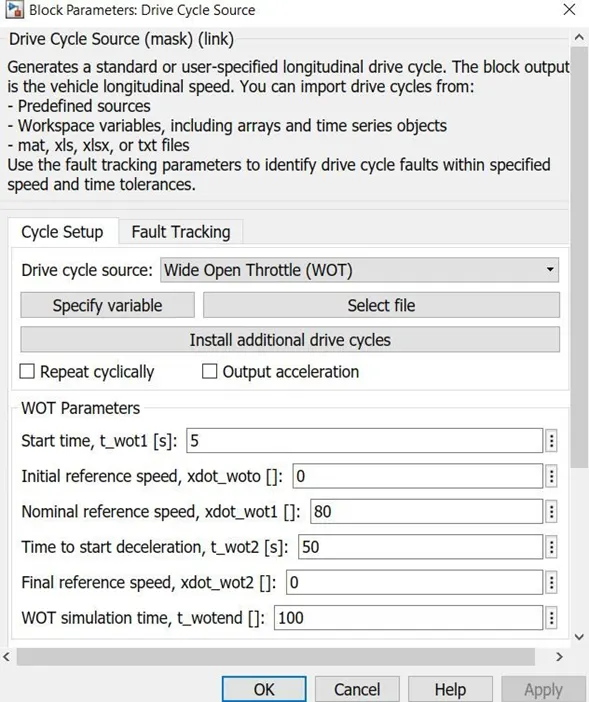
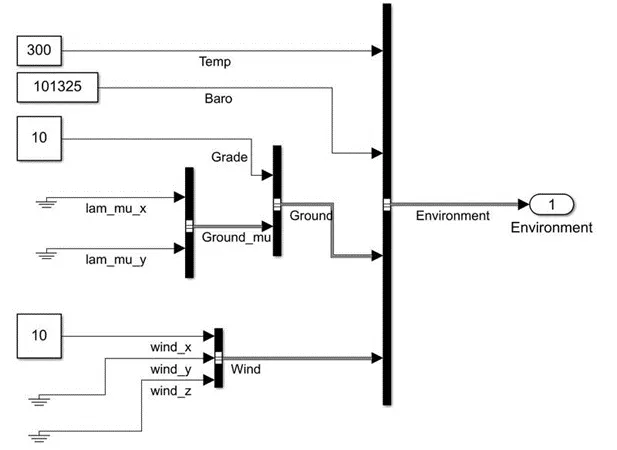
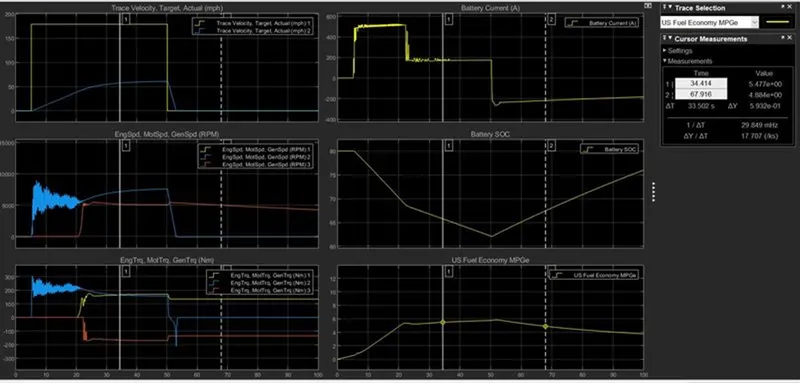
With changing environmental parameters
Gradeability = 10 and Wind Velocity = 10m/s
|
Parameter |
Without Changing Environmental Parameter |
With Changing Environmental Parameter |
|
Max. Velocity(mph) |
113 |
61 |
|
Max. Engine Speed(RPM) |
5464 |
5447 |
|
Max. Motor Speed(RPM) |
13723 |
8924.58 |
|
Max. Generator Speed(RPM) |
5464 |
5445 |
|
Max. Engine Torque(Nm) |
174.7 |
174.9 |
|
Max. Motor Torque(Nm) |
300 |
300 |
|
Max. Generator Torque(Nm) |
169.6 |
169.6 |
|
Max. Current(A) |
512.1 |
522.7 |
|
Max. SOC(%) |
80 |
80 |
|
Min. SOC(%) |
62 |
62 |
|
Max. Fuel Economy MPGe |
12.35 |
5.83 |
Results: By comparing Without Changing Environmental Parameter and With Changing Environmental Parameter the vehicle is not able to achieve the required speed instead of using the highest possible discharge with same battery used before. Similarly fuel economy also reduces to half of the previous simulation. So, efficiency of no-load vehicle is high as compared to the vehicle with additional loads.
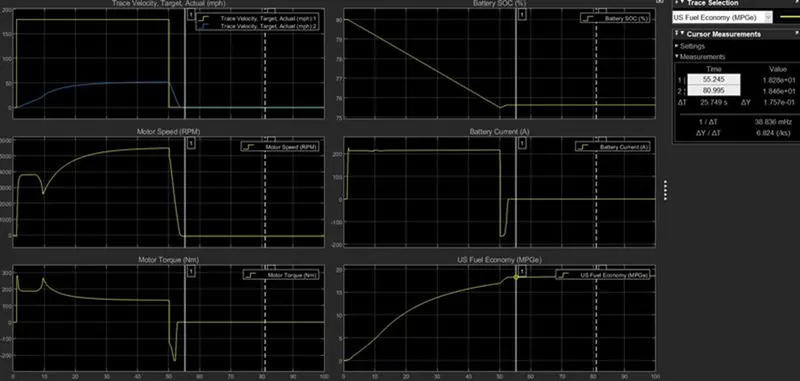
Ans4: Pure EV simulation results
|
Parameter |
Pure EV with load |
HEV with load |
|
Max. Velocity(mph) |
51 |
61 |
|
Max. Engine Speed (RPM) |
- |
5447 |
|
Max. Motor Speed (RPM) |
5482 |
8924.58 |
|
Max. Generator Speed (RPM) |
- |
5445 |
|
Max. Engine Torque (Nm) |
- |
174.9 |
|
Max. Motor Torque (Nm) |
279.94 |
300 |
|
Max. Generator Torque (Nm) |
- |
169.6 |
|
Max. Current(A) |
225.70 |
522.7 |
|
Max. SOC (%) |
80 |
80 |
|
Min. SOC (%) |
75.50 |
62 |
|
Max. Fuel Economy MPGe |
18.46 |
5.83 |
Result: The Pure EV vehicle compare with HWEV with same load conditions results in less top achievement in EV. The HEV produce more speed and torque as compare to EV. As the pure EV able to min SOC is low value as compare to HEV. The efficiency of the EV is higher than the hybrid vehicle from the miles per gallon numbers of both vehicles.