Week-4 Challenge WOT Condition Part-2
1.Difference between Mapped and Dynamic model
| Mapped | Dynamic | |
| Features | Data used for operation and simulation are in the form of a lookup table. Each value a corresponding mapped value is there. Which is then configured with the operational parts and the analysis is formed |
Its more realistic like the model understands the behaviour and act accordingly. It gives the detailed analysis for the variations provi ded |
| Advantage | If the detailed specification or lookup table available the simulation is easier. Gives the results on the basis of data available. known as Global Based Model | It operates Dynamically depending on the situation. Detailed data and specification are not required. Gives Detailed analysis |
| Disadvantage | More data needs to be collected. Assumptions might be taken | Could not simulate based on customized specifications |
In the case of Engine, Motor and Generator
| Mapped | Dynamic | |
| Engine | Engine performance could be simulated with the array of data given in the system.Engine operation , Power , Efficiency could be measured accordingly. | Engine performance will be simulated as per the original engine specifications of the vehicle choosen for simulation. All results should be obtained with real time results |
| Motor | Motor specifications like rpm, efficiency etc. need to be entered for simulating results. | The actual details of the same would be considered and the results would be obtained. |
| Generator | Specifications for Battery Torque, Battery Current etc needs to be entered for simulation | All the details and specification would be considered as per the actual and dynamic state the results of the same would be obtained |
To change model type right click on model select 'variant' select 'Label Mode Active Choice' select 'Dynamic or Mapped' as given in figure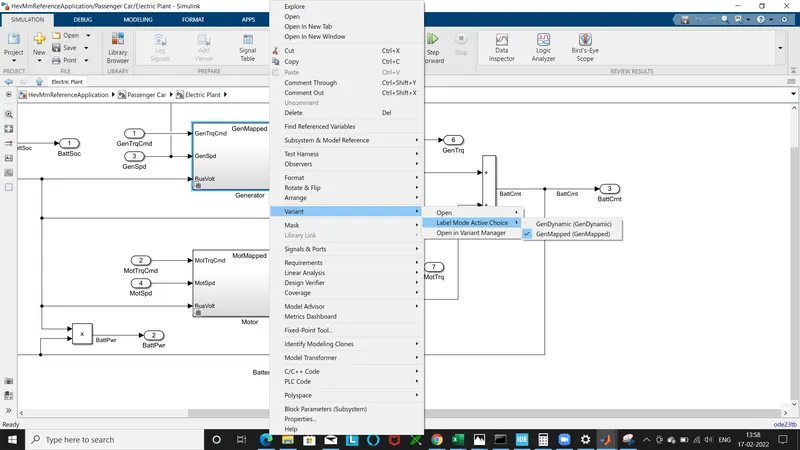
2.
.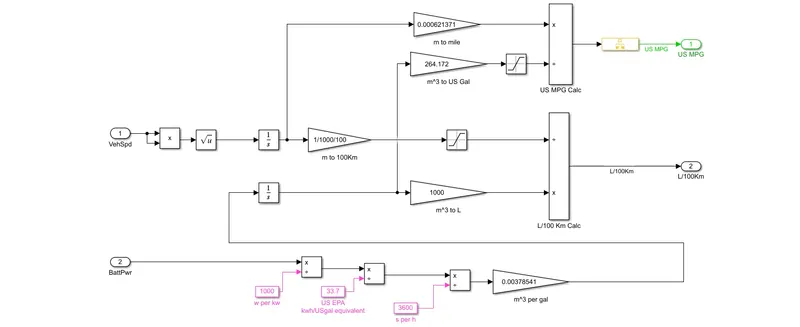
- It uses Vehicle speed and Battery power as inputs as in figure
- Rms value of vehicle speed calculated using product block for squaring and taking root of it.
- Then its integrated to get the distance and converted it into 100kms
- Applying saturation block for define limits and given to the product block for dividing
- Battery power is converted to kW and to US EPA Standard value Then convert it to m^3 per gallon then integrated it to get over a period.
- Then converted to m^3/L .
- This value is divided by vehicle speed
3.
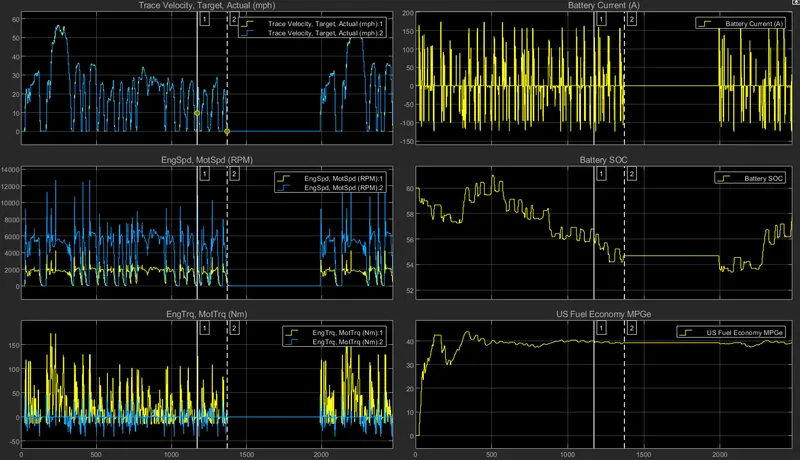
The figure shows performance of vehicle in different components running in a drive cycle
- First graph shows the trace velocity, It shows how well vehicle catch up with the given value. Blue is vehicle velocity and yellow is the Drive cycle value. Its almost equal
- Second Graph showing Battery current . Here we can clearly see the regenerative braking works. As regeneration occurs current flows in opposite direction. Thats shown in the -ve side of the graph.
- Third graph plots Motor speed related to the drive cycle. Its also similar to the drive cycle pattern. To catch up with Drive cycle requirements.
- Fourth Graph showing battery performance Related to the Drive cycle. Battery charge is decreasing as the cycle progress, although some small spikes showing battery charging using regenerative braking.
- Fifth Graph showing Torque of the motor to catch upwith drive cycle requirement. Its clearly seen that motor requires more torque to start from stand still condition.
- Sixth graph showing the Fuel economy. Its observed that heavy accelaration reducing the fuel economy in miles per gallon.
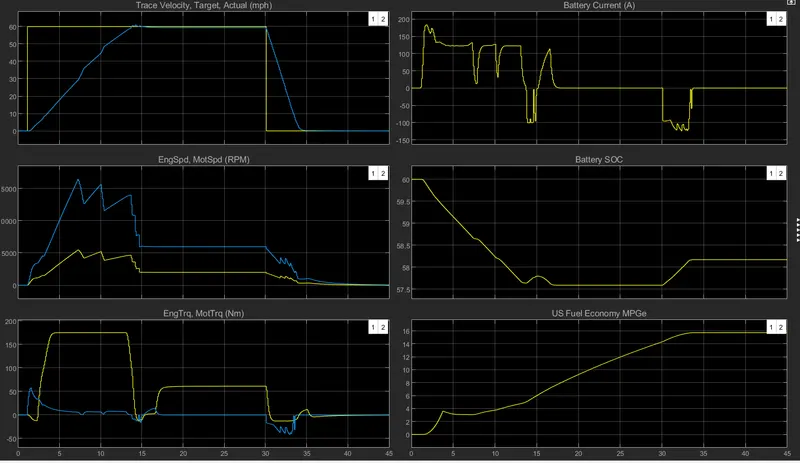
WOT Characteristics
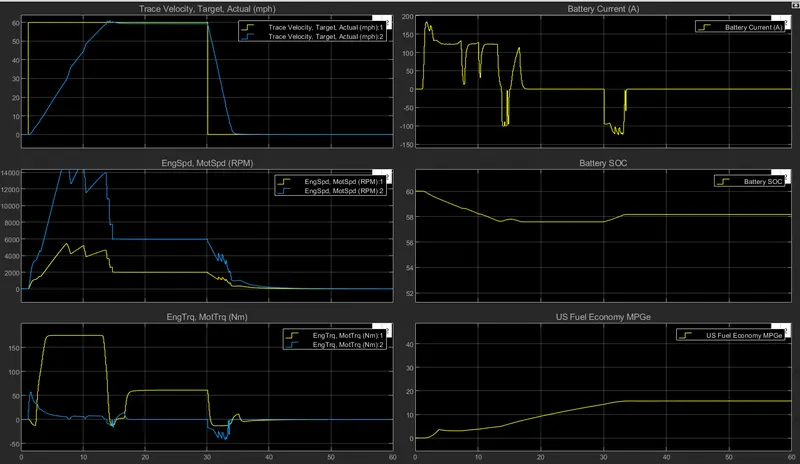
- First graph is the trace velocity , Its clear that the vehicle has some difficulty in catching up with the requred velocity initially. Due to the opposing forces and all it needs some time to gradually increasing and reaching the required value. Also in sudden stoping vehicle needs some time to reduce the momentum to reach stand still condition.
- Second is battery current, rgeneration can be seen in the deceleration phase only.
- Third graph plots Engine speed and motor speed Engine speed and motor speed is pushing to maximum to attain WOT requirement. after reaching a steady value its keep on running smoothly.
- Fourth one showing the Battery charge.As cycle progress the charge in the battery is gradually reducing and some regeneration of voltahe is seen in the deceleration phase
- Fifth Graph showing how well the motor torque is applied to attain WOT value initially it needs very high torque and then its reduced and reaching a stable state to maintain the value
- Last Graph showing Fuel economy. Initial accelerating phase its low but gradually it reaches some good economy values.
After changing Grade and wind velocity
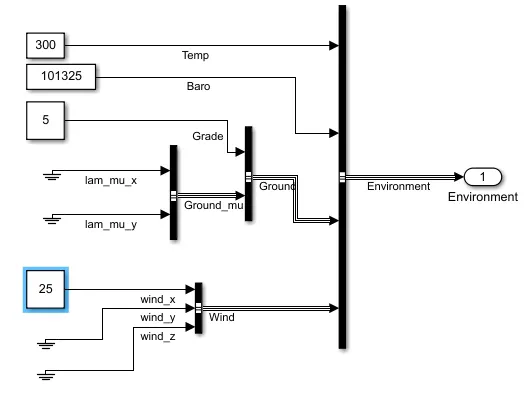
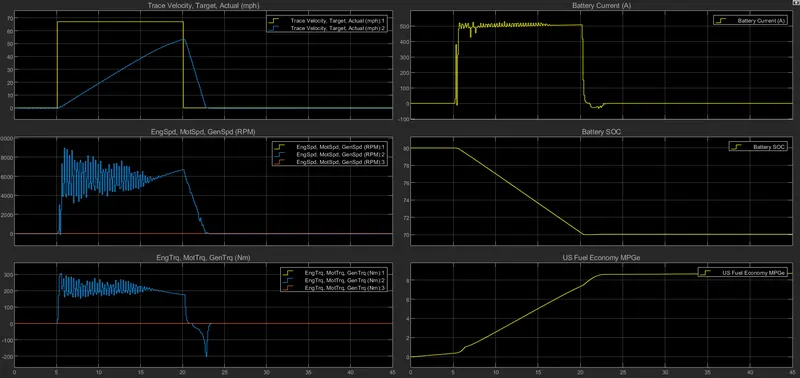
- First graph showing that after introducing wind and grade vehicle can't reach the required velocity
- 2nd graph Battery is providing more current to keep up with the WOT requirements
- 3rd graph showing engine rpm is way too behind from previous value
- 4th graph showing a steep decrease in battery charge. so it will drain soon.
- 5th graph showing the torque requrement is more to catch up with WOT requirements
- 6th graph showing Fuel economy is less compared to the previous setup without grade and wind.
4
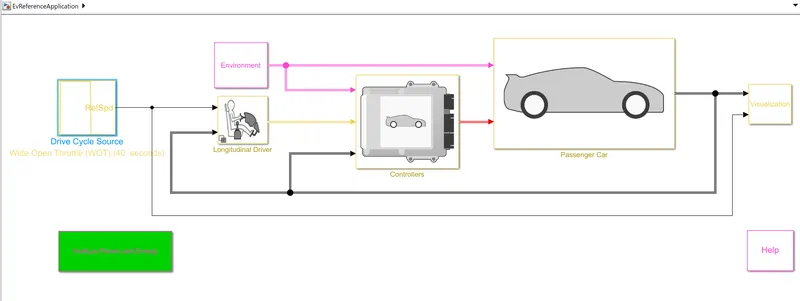
Pure EV
 .
.
Hybrid EV
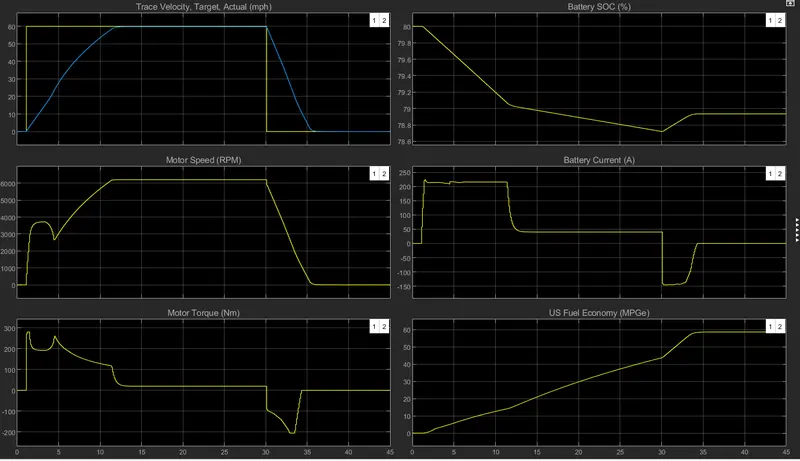
- Pure Ev reaches the maximum velocity faster
- Pre Ev battery provides more initial current
- Motor speed is higher in Pure Ev
- Pure Ev battery draining not as fast as Hybrid Ev curve is not as steep.
- Torque provided by Pure Ev is higher than Hybrid Ev. so it helps in accelaration
- Hybrid Ev Fuel Economy seems to be good