Week-4 Challenge WOT Condition Part-2
Q1)
1.Maped model uses a set of steady - state 2-D look up tables to characterize engine/motor performance.the tables provided overall engine characteristics including actual torque, fuel rate , BSFC and engine – out exhaust emissions .this model leads to faster solving times.
2.Dynamic model decomposes the engine behavior onto engine/motor characteristics that are separated into lower-level components. The models capture the dynamic effects. They are used
If you need a more detailed dynamic model and have component-level data.
To analyze the impact of individual engine components on the overall performance.
To change between mapped & dynamic model:
Open the powertrain module block set for the required vehicle.
Click on passenger car/vehicle block and select electric plant or engine.
Right click on Engine/EV motor/generator based on the vehicle model and select variant.
Under variant, scroll to label model active choice and choose mapped or dynamic for the required calculation.
Q2)
Milles per gallon(MPG) is a ful economy rating determined by how far a car can travel on a gallon of a gasoline or diesel for a conventional IC engine vehicle.in this case of an electric vehicle this is a measure how much electric energy is consumed by the battery pack to travel a fixed distance
The power train block has an inbuilt model for this which can be found inside the visualization block
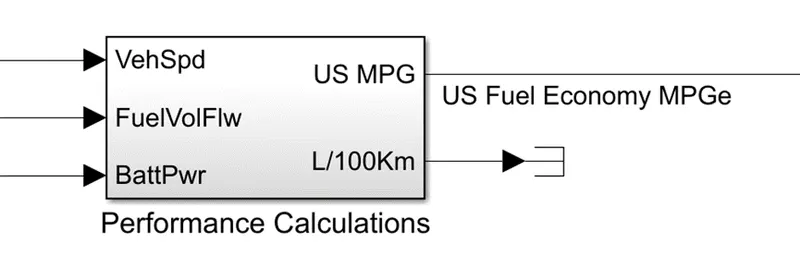
As observe from the picture a hybrid electric vehicle model visualisation block is explored. The fuel is calculated using two inputs which are vehicle speed & battery power.
Q3)
HEV Powertrain configuration blockset
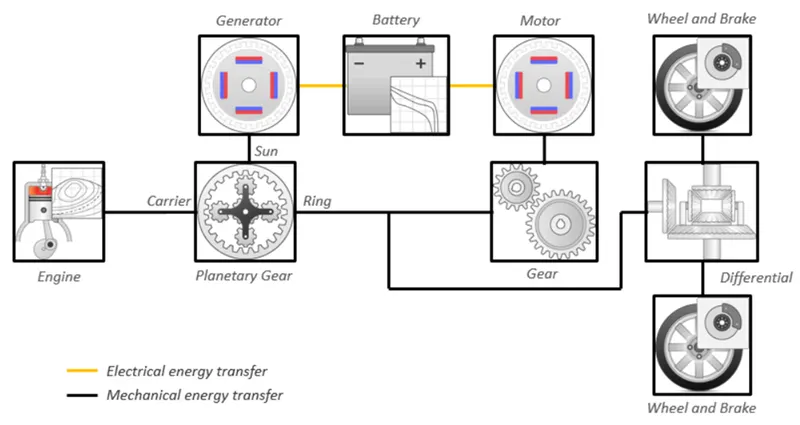
HEV Reference blockset
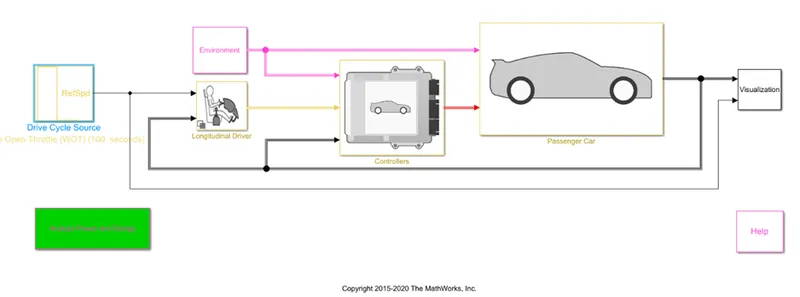
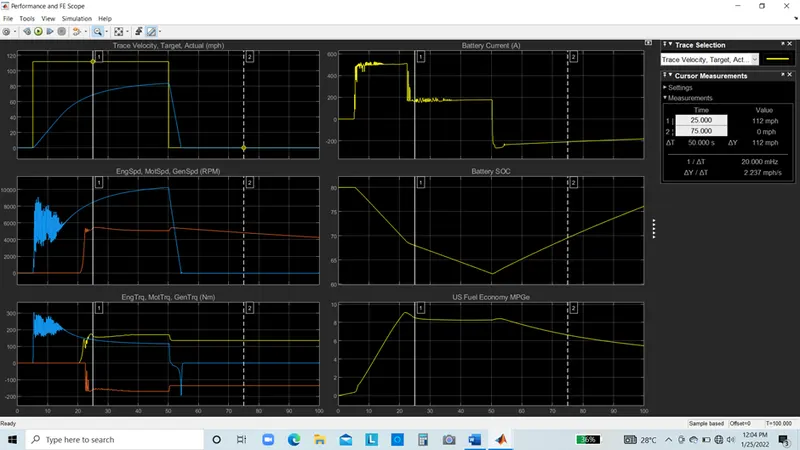
WOT Drivecycle inputs
Total simulation time=100s
Nominal speed= 50m/s
Deceleration time =50s
Case1-default grade (0 degrees) and wind velocity (0 m/s)
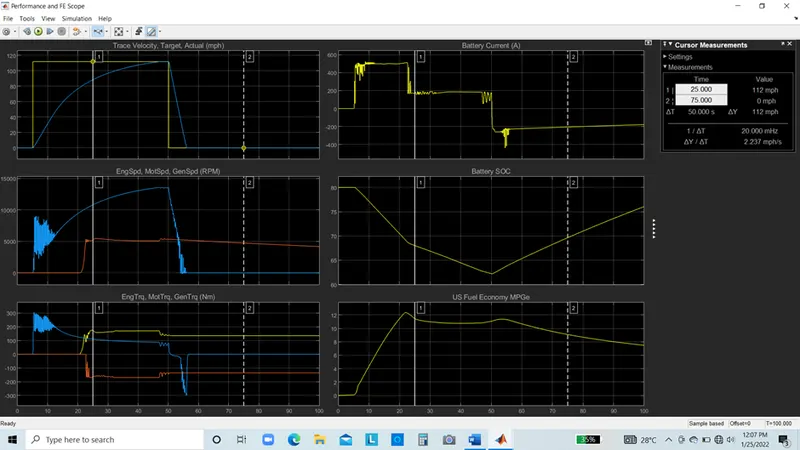
Case2-grade=5degree,windvelocity=10m/s
Comparison
|
Grade(deg) |
Case1 0 |
Case2 5 |
|
Wind velocity |
5 |
10 |
|
Maximum speed |
115 |
81 |
|
Max engine torque(Nm) |
190 |
190 |
|
Peak motor torque(Nm) |
300 |
300 |
|
Max battery current drawn(A) |
500 |
500 |
|
Battery soc % |
80 to 62 |
80 to 62 |
|
Fuel economy(MPG) |
10 |
6 |
Observation:
- A visible difference is observed between the actual trace velocity curve and input trace velocity curve due to the limitation of power available from the energy source
- The maximum speed achieved is lower in case2 because of the gradient slope considered and also the wind resistance
- Since more power speed from the energy source is required to overcome these resistances, the battery SOC and the fuel economy is decreased.
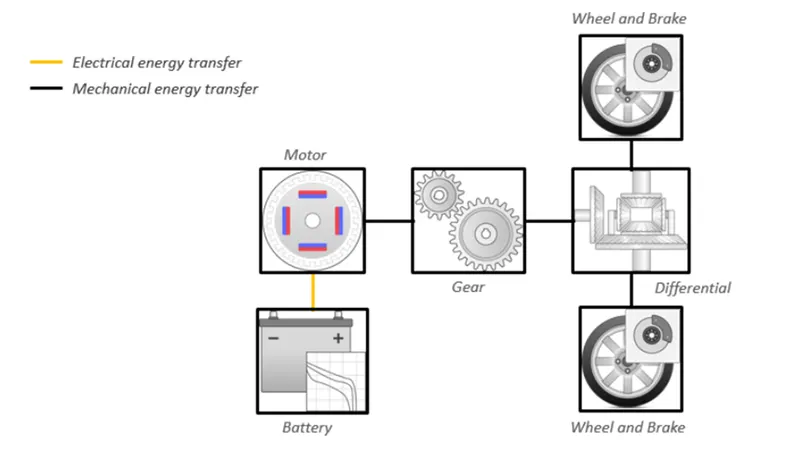
Q4)EV Powertrain configuration
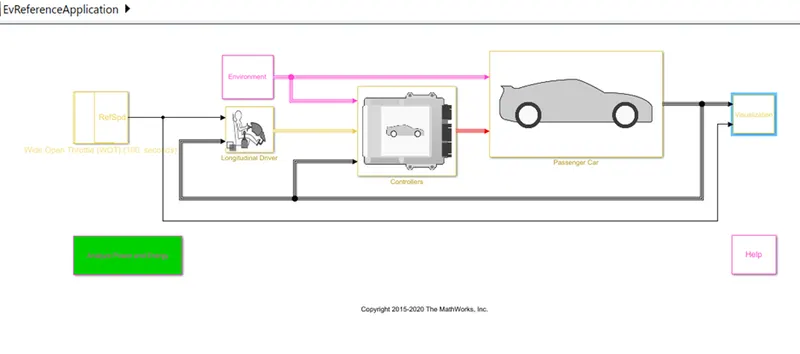
EV reference application blockset
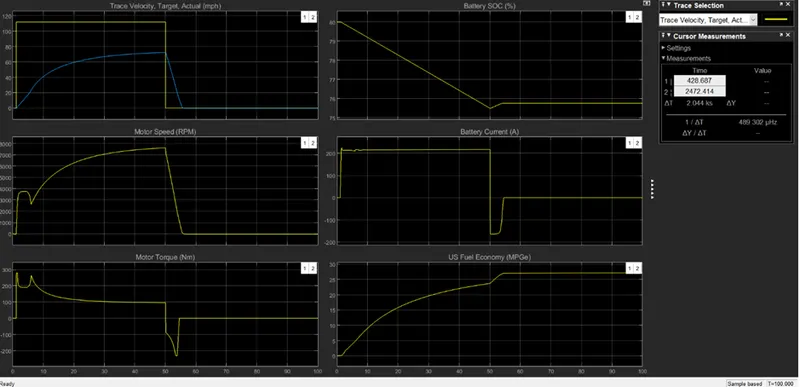
Case3-grade=5degree, wind velocity=10m/s
Comparisipn
|
EV |
HEV |
|
|
case3 |
Case2 |
|
|
Grade(deg) |
5 |
5 |
|
Wind velocity |
10 |
10 |
|
Maximum speed |
70 |
81 |
|
Max engine torque(Nm) |
NA |
190 |
|
Peak motor torque(Nm) |
290 |
300 |
|
Max battery current drawn(A) |
210 |
500 |
|
Battery soc % |
80 to 72 |
80 to 62 |
|
Fuel economy(MPG) |
30 |
6 |
Observation:
- The electric powertrain achieves a lower top speed when compared to a HEV powertrain
- Since the motor is the only propulsion source in an EV powertrain, the motor needs higher rated and generate the instantaneous start up torque to propel the vehicle
- The conventional HEVs use lead acid battery where as the EVs use lithium-ion cells which have more fuel economy than a conventional HEV
- The peak RPM of the motor in EV is less than HEV.