Week-4 Challenge WOT Condition Part-2
- What is the difference between mapped and dynamic model of engine, motor and generator? How can you change model type?
- How does the model calculate miles per gallon? Which factors are considered to model fuel flow?
- Run the HEV ReferenceApplication with WOT drive cycle. Change the grade and wind velocity in the environment block. Comment on the results.
- Keeping all other parameters same, compare the simulated results of hybrid and pure electric powertrains.
1. Mapped models - These models are also known as static models or steady state models where we need to input the values of the variables in a given specified mapped model. These are used for quick prediction of performance and fuel consumption, etc.
Also mapped models gives us the macro behaviour of the model and predefined values of the variables which are functions of mapped models can be used to analyze the behaviour of the model.
Dynamic Models- These models are not dependent on the predefined values . They are dependent on the individual subsystems or we can say the component level controllers. For real time analysis, we can use the dynamic models.
Mapped model of MOTOR:
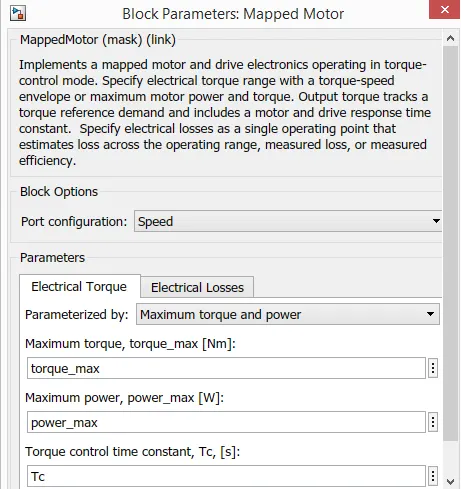
Mapped model of motor is only dependent on the power and torque values.
Dynamic model of MOTOR:
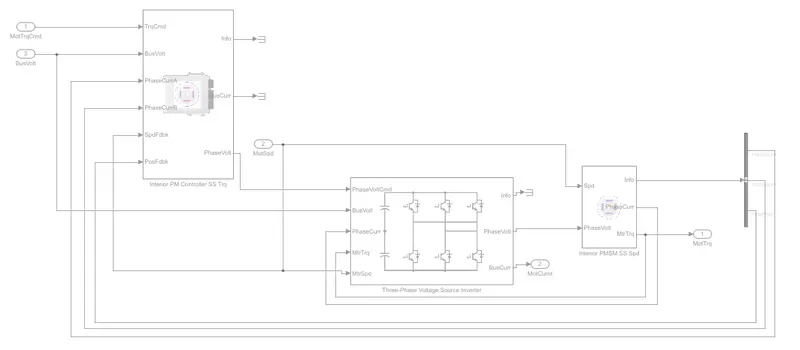
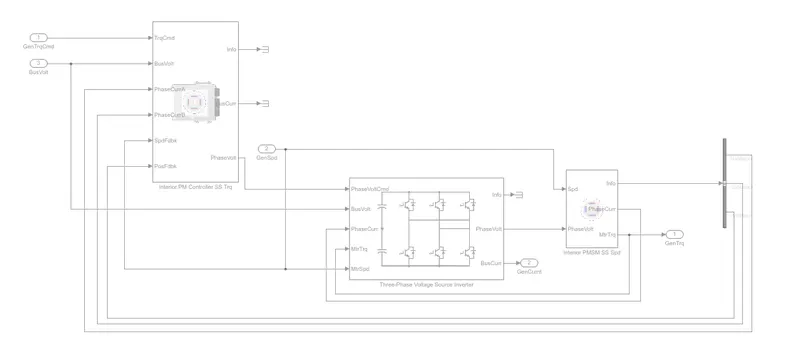
This is dynamic model of the motor which consists of Three- Phase voltage source inverter, Permanent Magnet for torque and Permanent Magnet Synchronus Motor (PMSM) for speed
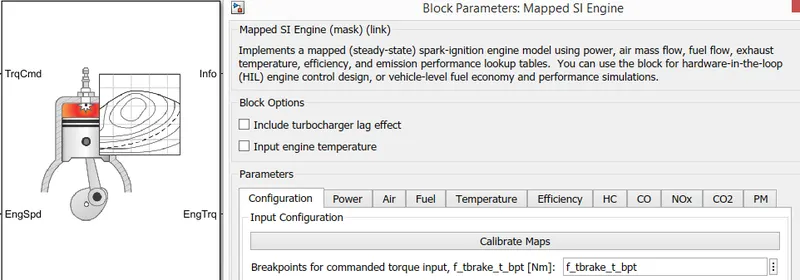
Mapped model of Engine:
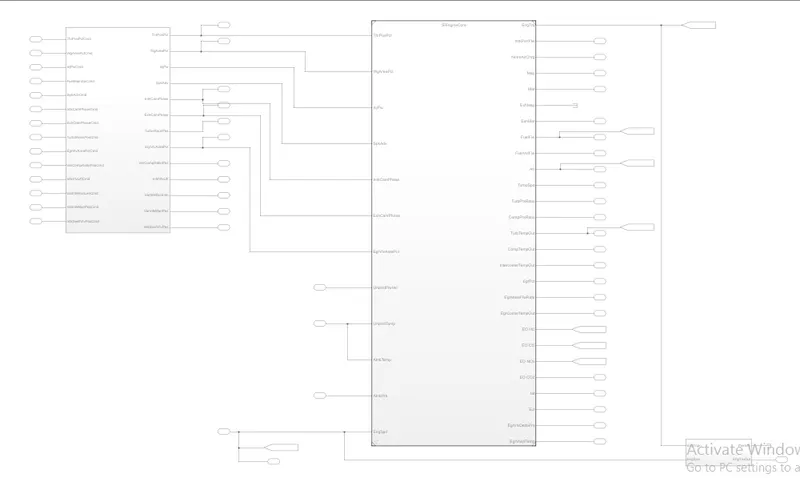
Dynamic Model of Engine:
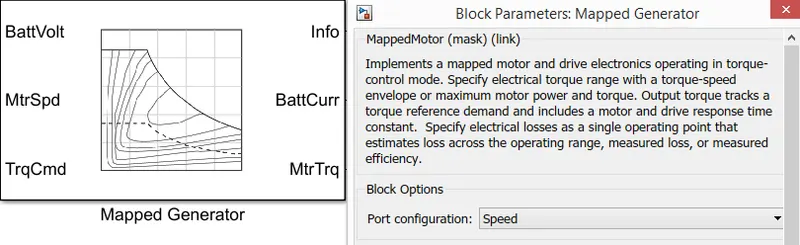
Mapped Motor Generator:
DYNAMIC MOTOR GENERATOR:
2) How does model calculate miles per gallon and what are the factors considered to model the fuel flow?
- MPG or miles per gallon is used as the primary measurement of car's fuel efficiency. It is the distance that a car can travel per gallon of fuel.
-For calculating miles per gallon,
vehicle speed and battery power are given as input to the Performance calculation block and US MPG as well as L/100 km comes as an output which shows the miles per gallon.
Following is the subset of the performance calculation block that is miles per gallon calculation block which shows the calculation procedure taken into the consideration:
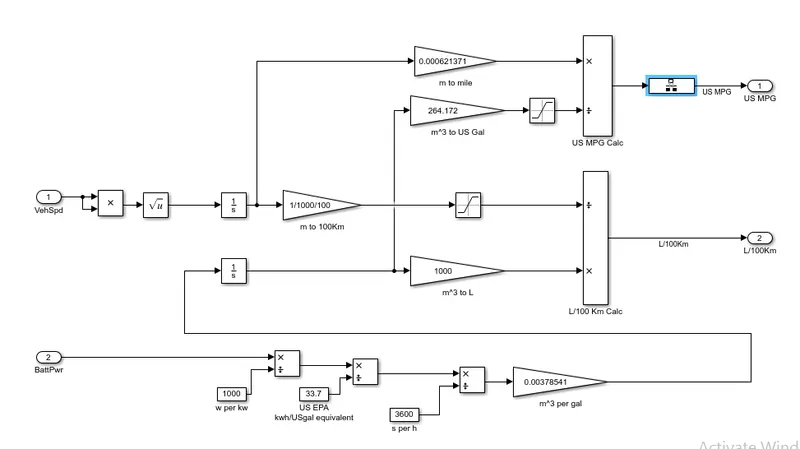
Factors that are considered to calculate the miles per gallon for the model is vehicle speed and battery power.
3)Run the HEV ReferenceApplication with WOT drive cycle. Change the grade and wind velocity in the environment block. Comment on the results.
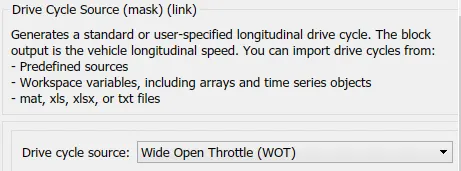
First selecting the WOT drive cycle as shown below:
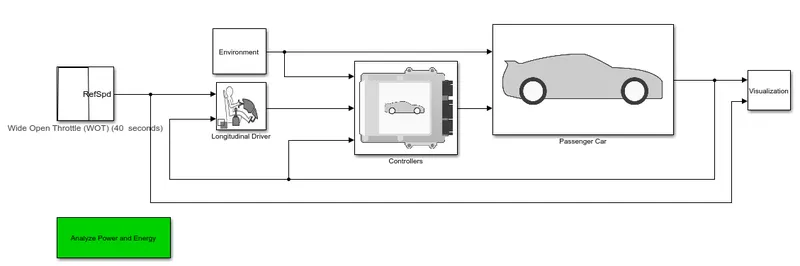
Following is the simulink model for HEV ReferenceApplication with WOT drive cycle:
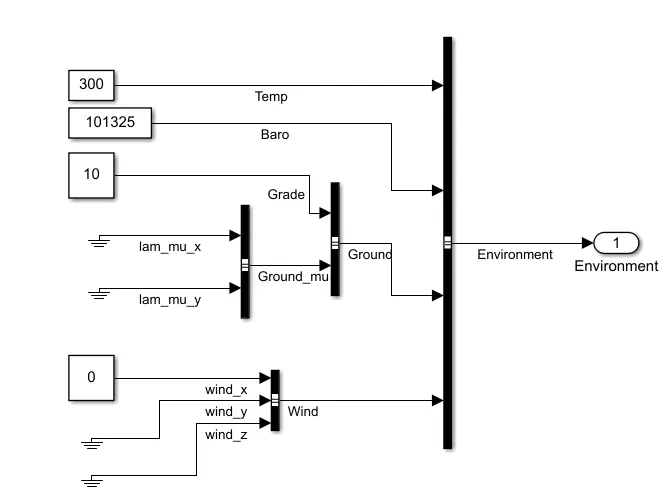
Changing the grade angle :
This variable is provided in environment block with other variables.
I have kept it to 10 degree as shown below:
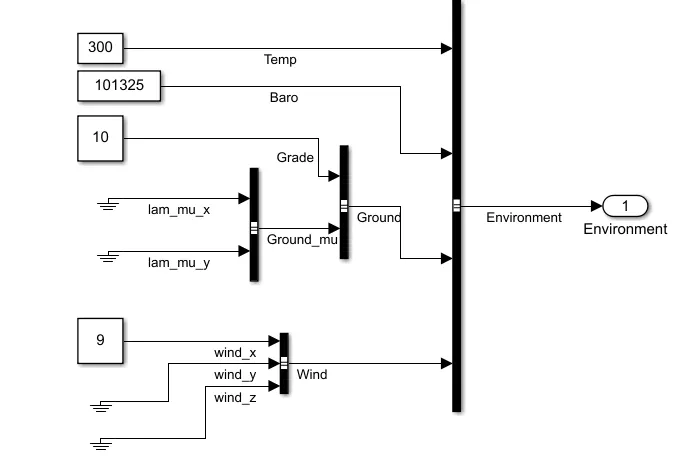
Adding the wind velocity:
Average wind velocity on a typical day used to be between 6 to 12 km/h.
I have kept it to 9 km/h as shown below :
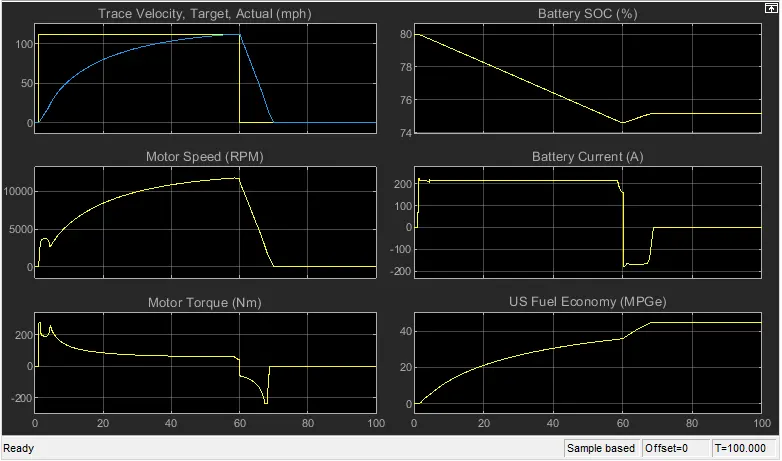
SIMULATION RESULTS:
- without adding grade angle and wind velocity
WITH GRADE ANGLE AND WIND VELOCITY:
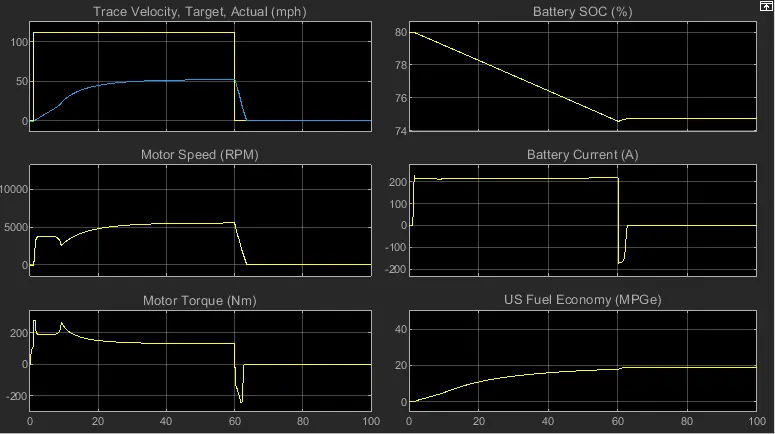
OBSERVATIONS:
As we can clearly see that when grade angle and wind velocity is not considered, actual velocity is obtained by the vehicle in approximately 60 seconds where as when the grade angle and wind velocity is considered, vehicle was not able to reach the destined velocity. Vehicle was only able to reach around 45kmph where it was suppose to reach 60 kmph.
Talking about the state of charge, during the deceleration , state of charge increased minutely as shown in the above graph and then remained constant.
Furthermore, when state of charge increased minutely, battery ampere goes into negative which shows vehicle goes into regenerative braking and charging the battery.
4)Keeping all other parameters same, compare the simulated results of hybrid and pure electric powertrains.
Below is the simulink model for hybrid electric vehicle:
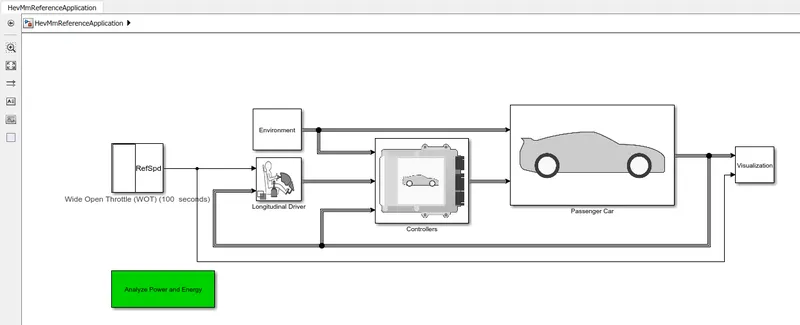
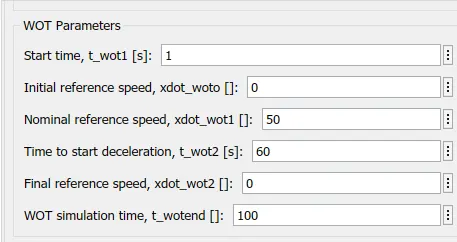
All the parameter are kept same as in above pure electric case, shown in below images:
Above figures shows, grade angle = 10 degree and wind speed= 9 kmph
WOT PARRAMETER VALUES SHOWN BELOW:
Folowing are the simulation results:
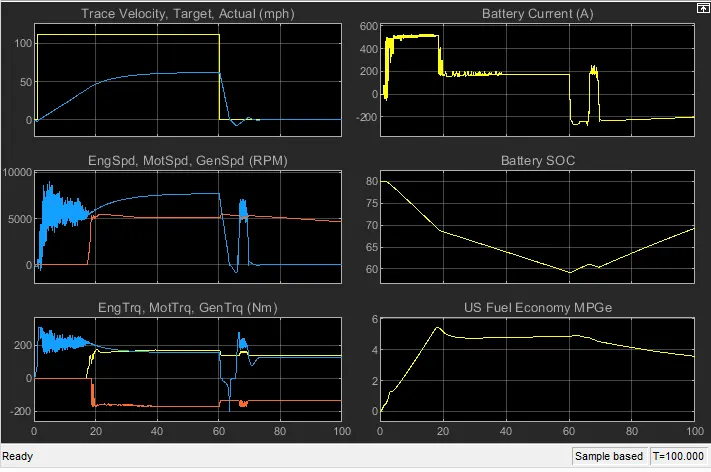
Observations:
1) From the first graph, it is shown that vehicle was not able to reach he desire velocity due to grade angle as well as the wind velocity.
2) battery(ampere) graph : It shows that, current at first follows steep path during the sharp acceleration as shown in the first graph and remains constant until the deceleration starts. When it follows negative trend, it shows that vehicle is under regenerative braking mode.
3) Motor Rpm was at great speed while the vehicle accelerating and at reaching peak value by the motor, engine provided the support as shown by the orange line in 3rd graph.
4) state of charge: It goes down quickly while the vehicle is accelerating then remained depreciating while the is at peak velocity and afterwards it charged a little bit while vehile decelerated and after engine takes the support, state of charge kept increasing.
COMPARISON BETWEEN THE SIMULATION RESULT OF PURE ELECTRIC AND HYBRID VEHICLE:
1) State of Charge- In pure electric vehicle, the state of charge after depreciating remained upto 75% and in hybrid vehicle, it goes further down to 64% while the vehicle was accelerating. The regenrative braking plays important factor in hybrid vehicle as state of charge kept improving while the vehicle was running on engine.
2) Battery (amperes) in pure electric vehicles at was comparatively low than hybrid vehicle at the acceleration time. This is due to the fact that when required, engine provided the power for hybrid vehicle.
3) Fuel economy of EV is greater than that of hybrid vehicle and the reason behind this is , that motor efficiency is greater than that of engine.