Week-4 Challenge WOT Condition Part-2
| Mapped |
Dynamic |
|
| Engine | SI (Spark Ignition) mapped engine uses steady-state lookup tables to know the engine performance. The tables provide the data of the actual torque, fuel flow rate, BSFC (Break Specific Fuel Consumption), and engine-out exhaust emission. | The model disintegrates the engine model behavior into engine attributes that are separated into lower-level components. By integrating components like this way, the model is captioned as the dynamic model. |
| Motor | The mapped motor and drive electronics operate in torque-controlled mode. It tracks output torque with respect to the reference demand. It includes motor response and drives response time constant. The implicit controller is used. | The permanent magnet synchronous motor with controller PMS is used. It implements 3 phase interior PMSM with sinusoidal back electromotive force. 3 phase input voltages to regulate the individual phase currents, allowing control as the motor torque or speed. |
| Generator | By default mapped generator is used in the Hybrid Electric Vehicle. It is also similar to the mapped motor, where electric power is generated. An implicit controller is used. | The Interior Permanent Magnet Synchronous motor and its controller is used. Interior PM controller implements a torque-base and field-oriented controller for an Interior PMSM with an optional outer loop speed controller. |
Aim2: To know the Miles per gallon calculations and its Fuel flow in the model.
Theory:
Miles per gallon (MPG) is a fuel economy rating determined by how far a car can travel on a gallon of gasoline or diesel. Although the metric version would be kilometers per liter, MPG is adopted in many metric-system countries, like Canada.
While it is both cheaper and better for the environment to achieve a higher MPG rating, there is a curve, that the EPA calls the "MPG Illusion" that shows the cost-benefits of increasing MPG decrease with a higher rating. For example, to travel 1,000 miles, a car that gets 10 MPG will require 100 gallons of fuel. Conversely, a car that gets 15 MPG will require 67 gallons of fuel. In this case, an increase of just 5 MPG cuts fuel consumption by 33%. When a car gets 30 MPG, however, increasing its mileage to 35 MPG will only save 5 gallons of fuel over 1,000 miles.
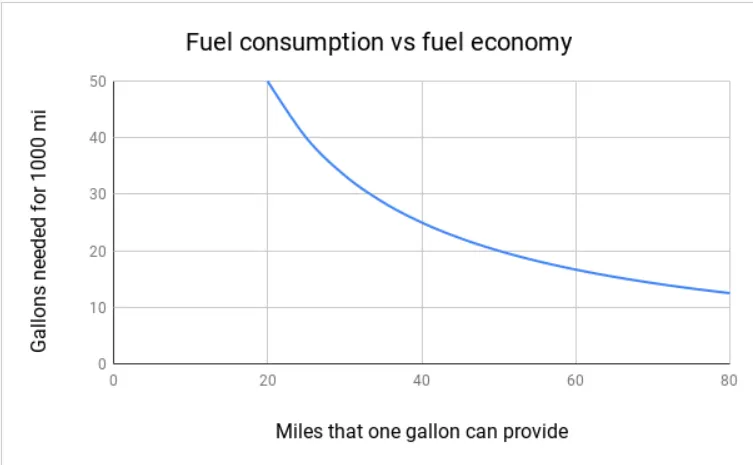
The graph above shows the MPG Illusion. That fuel consumption does not decrease at a linear rate with MPG increase.
Because of this MPG Illusion, carmakers in both the United States and Canada are beginning to list their cars' mileage in fuel consumption per distance. In Canada, this is done in liters per 100 kilometers (L/100km), and in the USA, this is done in gallons per 100 miles (gal/100mi).
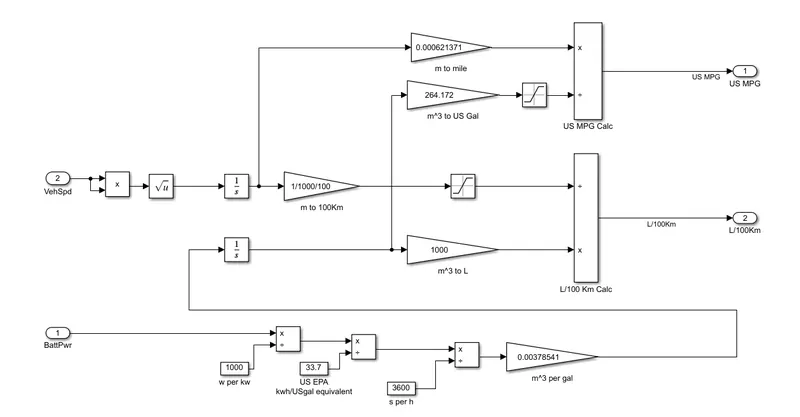
Vehicle speed and flow of fuel:
In the above diagram, the vehicle speed is integrated. The resultant of an integrated block will be in the form of distance traveled by the vehicle. The output of the vehicle speed integrated block is given to the saturation block. Where this block converts meter to miles and output of this saturation block is given to the US Mile Per Galon calculations block as one of input with respect to another input from the battery power in terms of m^3 to US Gal. By multiplying and dividing both quantities respectively will have the output As the US MPG.

To find the fuel per distance refers to the above flow of diagram. The same saturated distance is given to divide and multiply blocks to calculate the fuel consumption. The fuel was in the form of m^3 to L. The output of the L/100 km calculation block is L/1000km.
Battery Power:
Battery power and the watt per KW block of constant as 1000 is given to multiply and divide the block. The output of this block is given to convert into US EPA which is kWh per USgal equivalent by dividing with 33.7. The output of USgal is equivalent to m^3 per gal by gaining with 0.00378541.

Aim3: To run the HEV Reference Application with WOT drive cycle. To change the grade and wind velocity in the environment block and to comment on the results.
The Hybrid Vehicle model is a multimode type model with an internal combustion engine, transmission, battery, motor, generator, and associated powertrain controlled algorithm is used. This HEV is configured with the mapped motor and generator along with a 1.5-L spark ignition dynamic engine
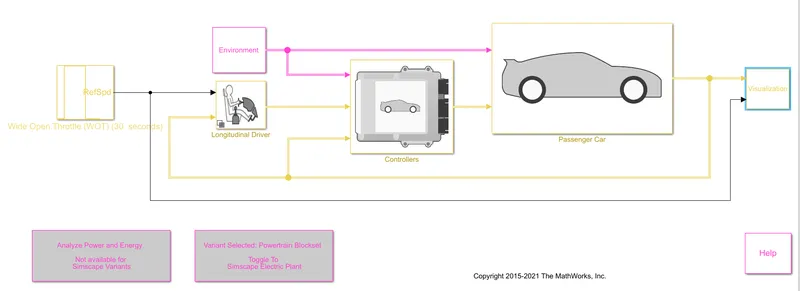
The Powertrain system in HEV as shown in fig: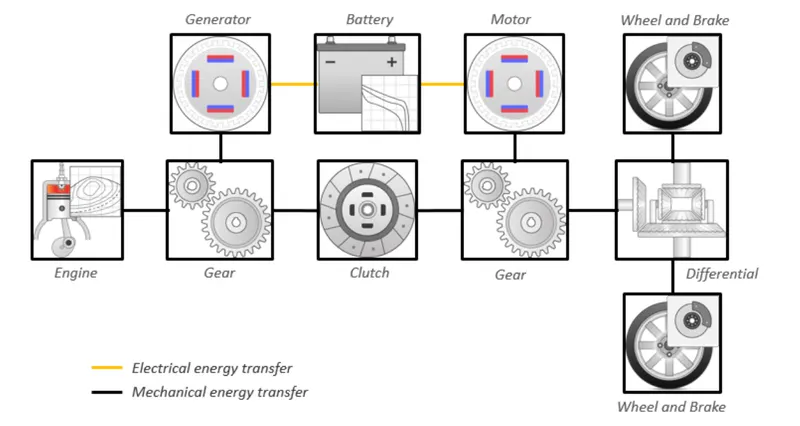
HEV reference application model with Wide Open Throttle (WOT) drive cycle:
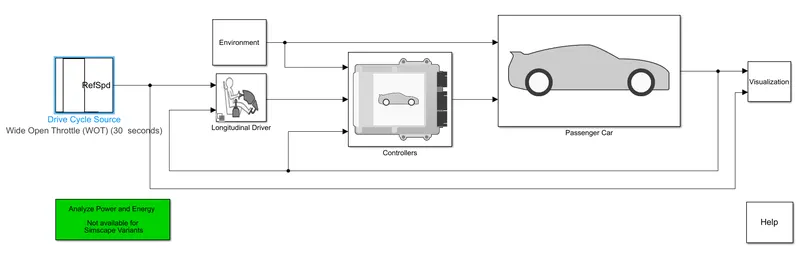
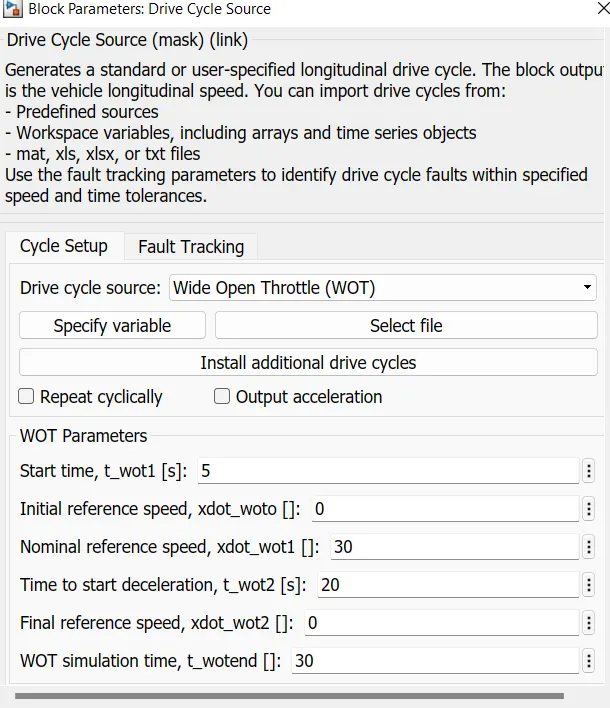
The Wide open throttle (WOT) parameters, including initial and nominal reference speed, deceleration start time, and final reference speed. Generates a standard or user-specified drive cycle velocity versus time profile. Block output is the selected or specified vehicle longitudinal speed.
Environment Subsystem: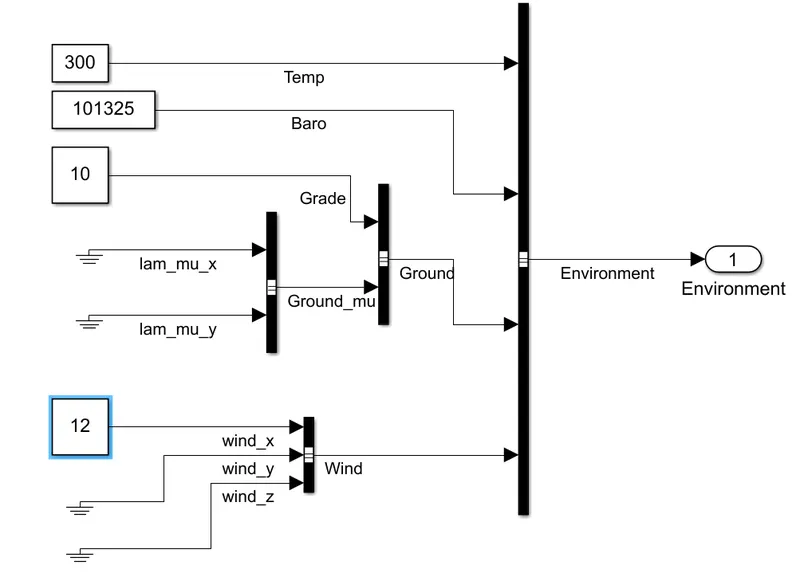
Creates environment variables, including road grade, wind velocity, and atmospheric temperature and pressure. Here gade is changed 0 to 10. And wind velocity applied to the application is 12.
Longitudinal driver subsystem:
Uses the Longitudinal Driver or Open Loop variant to generate normalized acceleration and braking commands.
-
Longitudinal Driver variant implements a driver model that uses vehicle target and reference velocities.
-
Open Loop variant allows you to configure the acceleration, deceleration, gear, and clutch commands with constant or signal-based inputs.
Controllers subsystem:
Implements a powertrain control module (PCM) containing a hybrid control module (HCM) and an engine control module (ECM).
Passenger car subsystem:
Implements a hybrid passenger car that contains the engine, electric plant, and drivetrain subsystems.
Visualization subsystem:
Displays vehicle-level performance, battery state of charge (SOC), fuel economy, and emission results that are useful for powertrain matching and component selection analysis.
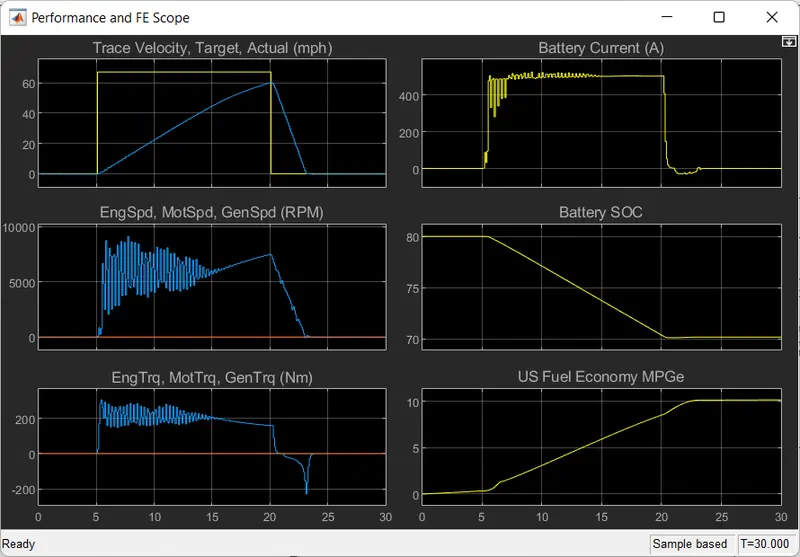
Observations:
Trace velocity Vs target velocity vs actual velocity. WOT drive cycle is running for 30 sec. The yellow graph indicates the trace velocity and blue indicates the actual velocity. The actual velocity gradually increases to the highest peak in between 5 sec to 20 sec by using battery power. The actual maximum speed is 45.9mph and the traces maximum speed is 67.1 mph.
Engine speed vs Motor speed vs Generator speed. The motor speed graph is in the blue line. And the engine speed graph is in the yellow color but it is overlapped with the generator speed(orange line). The highest engine and motor speed is 9339.63 rpm. -36.5 indicates the regenerative rpm.
Engine torque vs Motor torque vs Generator torque in this graph in this graph the torque is going in the negative region is referred to be in regenerative torque mode.
Battery current is used when a vehicle uses an electric motor. After that, no current is used by the power of the motor.
Battery SOC(state of charge): battery uses around 80% charge. The SOC starts decreasing as the battery goes into charging mode through the generator.
US fuel economy MPGe: graph shows that the distance covered by the vehicle during high speed will also consume high fuel.
Aim4: To compare the simulated results of hybrid and pure electric powertrains
In Aim3 we discussed the HEV application lets compare HEV and EV here, the electric vehicle reference application represents a fully electric vehicle model with a motor-generator, battery, direct-drive transmission, and associated powertrain control algorithms. Use the electric vehicle reference application for powertrain matching analysis and component selection, control and diagnostic algorithm design, and hardware-in-the-loop (HIL) testing.
Electric Vehicle Powertrain system diagram.
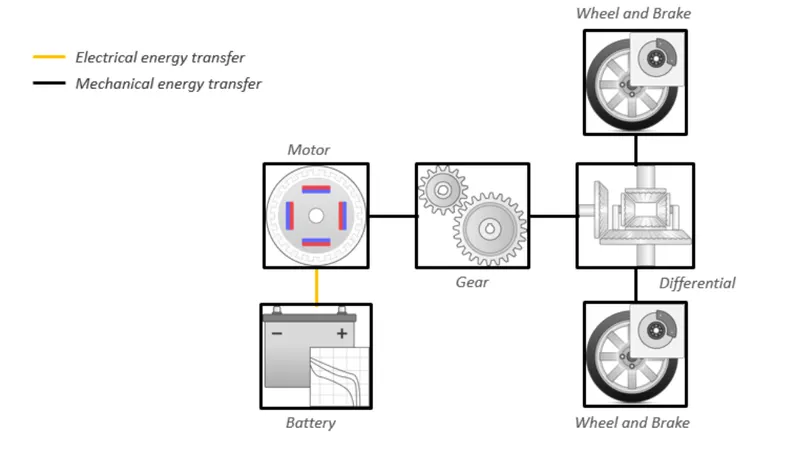
All parameters are kept same as previous HEV appplication
WOT( Wide Open Throttle) is used as a drive cycle with all the same spacification.
Start time: 5
Initial reference speed: 0
Nominal reference speed: 30
Time to start deceleration: 20
Final reference speed: 0
WOT simulation time: 30
IN Environment subsystem:
Grade:10
Wind velocity:12
The results of the pure EV are as follows
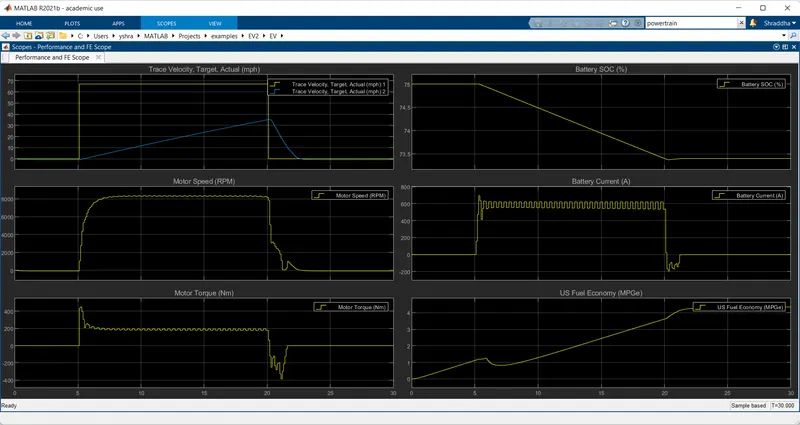
Observations:
Graph1 shows that the vehicle cannot complete the top speed that is 67mph. So, it can run up to 35km. due to additional forces. The acceleration time to reach the top speed is 20sec. and the deceleration time is 3 sec only.
Graph2 understands that the Changes in the speed of the motor rpm throughout the drive cycle. The peak speed of the motor is 8353 rpm for the time range of 7 to 19 sec. Deceleration of motor speed happens in the 3.54 sec.
The motor torque is in the positive and negative region, From grpgh3 this can be concluded. The initial torque was greater as compared to the constant speed torque.
State of Charge (SOC) decreases from 75% to 73.5% of charge in a 20.47 sec time period for a WOT drive cycle.
In graph5 battery current changes due to the variations in the acceleration. The peak current discharge from the battery is 695 A and the peak charging current of the battery is 1.57A.
Plot 6 shows the US fuel economy(MPGe). The maximum miles that run per gallon of fuel is equivalent to 23.45 miles, at specified WOT conditions.
Comparison of Hybrid Electric Vehicle and pure Electric Vehicle:
- After comparing HEV and EV results, can be observed that the Electric Vehicle cannot reach the top speed of its drive cycle. The torque value is more in the case of EV but in HEV there will be two torques, one from the motor and another from its engine. By combining both torques the value of HEV torque is more
- The pure electric vehicle uses a Lithium-ion battery. The Nickel hydride battery is used in the HEV. The rate of charging and discharging battery capacity is more in the pure EV. This is the sole reason for instantaneous high torque. The state of charge (SOC) is greater in the pure electric vehicle
- The pure electric vehicle's efficiency is higher than the HEV, it is evident by the Miles pe gallon graph
- The Hybrid Electric Vehicle produces some gas emissions, wherein pure Electric Vehicle zero-emission is produced.