Week-4 Challenge WOT Condition Part-2
1. AIM
- To explain the difference between the mapped and dynamic models of engine, motor, and generator and discuss the steps to change the model type in detail.
EXPLANATION
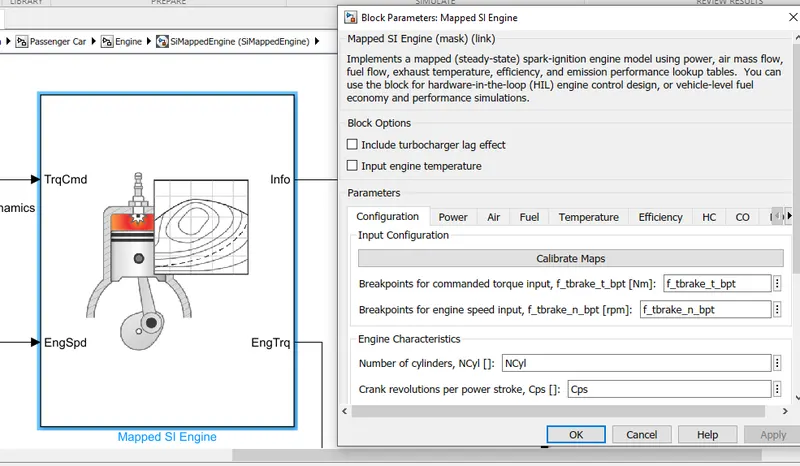
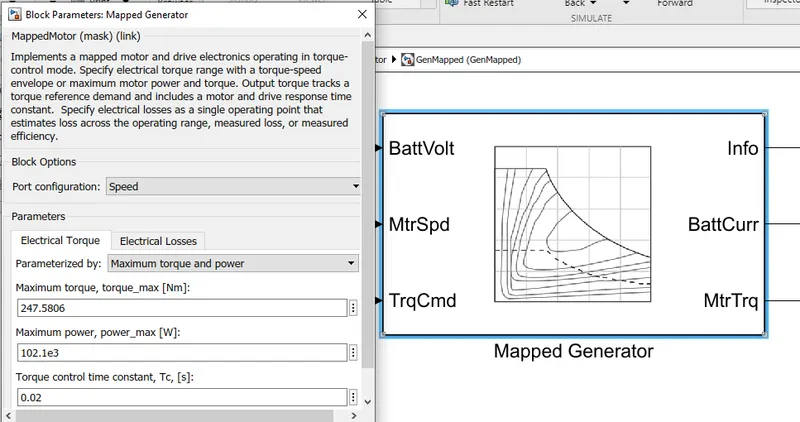
MAPPED MODEL
- It is a steady-state model known as a backward-facing model (data flow method) for example, drive cycle -- power/energy calculation ---- fuel/battery.
- simulation time is quicker.
- uses lookup table (which uses arrays of data to map input values to output values, approximating mathematical functions.)
The mapped models of engine, motor, and generator use lookup tables rather than actual component blocks. since approximating mathematical functions, they are not accurate or detailed models.
DYNAMIC MODEL
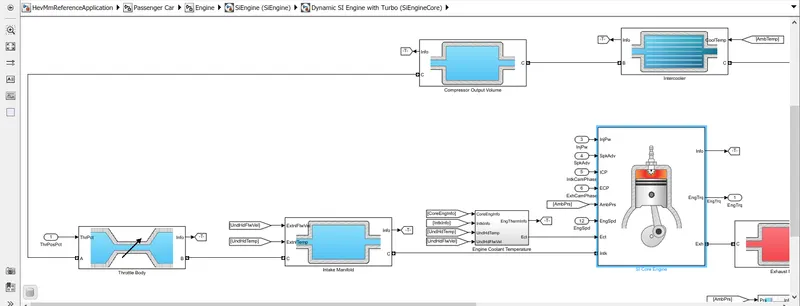
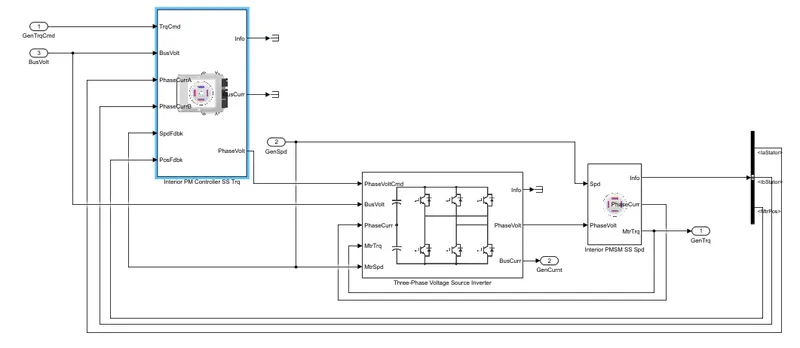
- It is a forward-looking model, (energy flow or power flow method) for example, battery ------- power/energy calculation -----drive cycle.
- simulation time is more.
- dynamic in nature ie, speed can be controlled to follow a drive cycle during the analysis.
The dynamic models of engine, motor, and generator use actual component blocks. the dynamic si engine uses various blocks like air filter, throttle body, intake manifold, intercooler, etc. the dynamic generator and motor uses blocks like Interior permanent magnet controller, 3 phase voltage source inverter. they are accurate and detailed models than the mapped models.
TO CHANGE THE MODEL TYPE
- go to the generator subsystem block
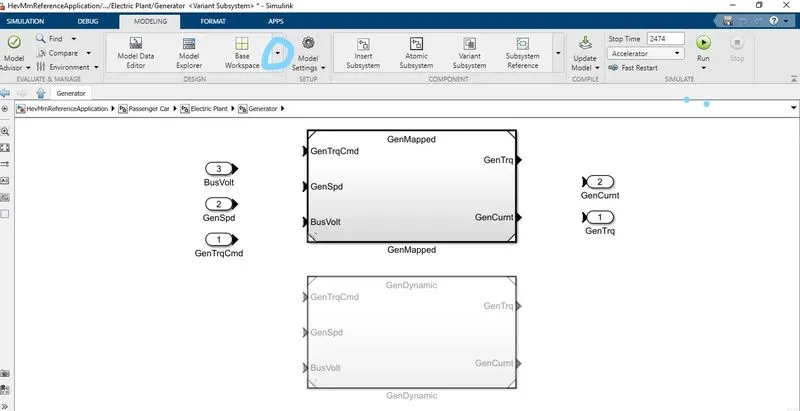
- then select MODELING, select the show more down arrow
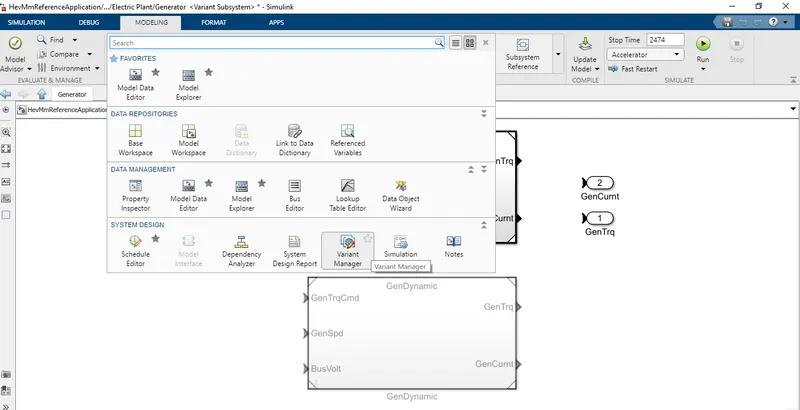
- then select variant manager
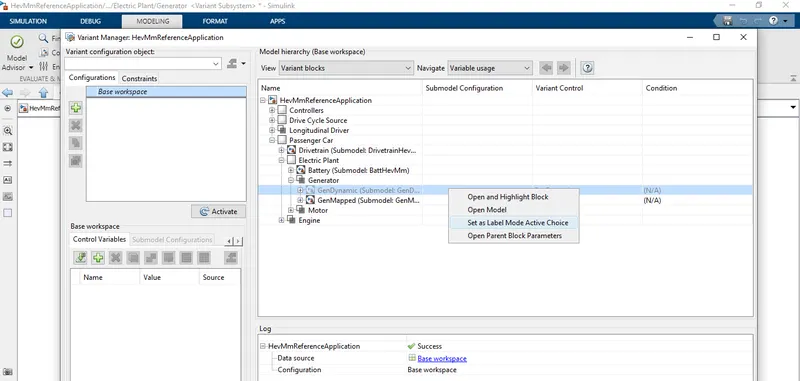
- then in order to change the model from GenMapped to GenDynamic
- select GenDynamic and right-click and then select Set as Label Mode Active Choice.
- now close the variant manager window and you can see the model changed from GenMapped to GenDynamic.
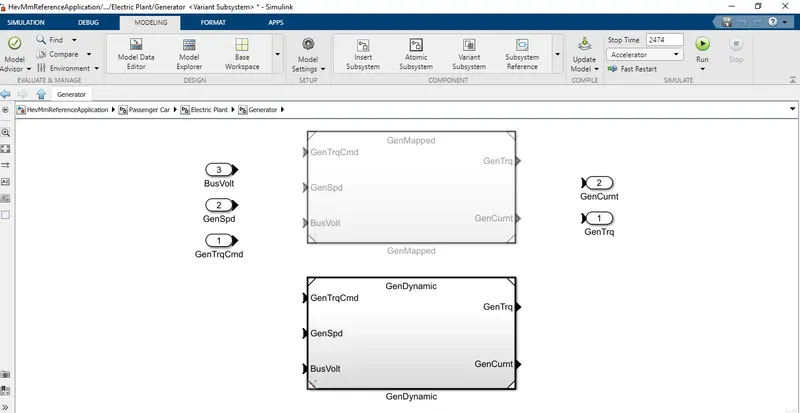
- By the above steps, we can able to change the mapped models of engine, motor to the dynamic models.
RESULT
- Thus the difference between mapped and dynamic models of engine, motor, generator are explained and the steps for changing model type are shown.
2. AIM
- To explain how miles per gallon are calculated and what factors are considered to model fuel flow?
EXPLANATION
- open HevMmReferenceApplication and click on visualization block
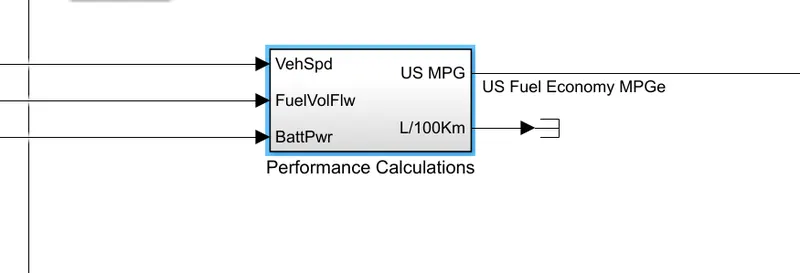
- select performance calculation
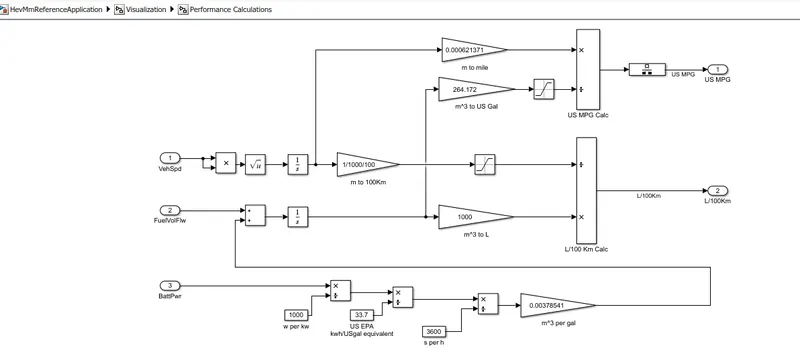
- vehicle speed is connected to product block and then sqrt block and then integrated with respect to time to get the distance. now the calculated distance m is converted to miles by multiplying with 0.000621371 and then output is given to US MPG calc block.
- battery power w is converted to kw by dividing with 1000. then power kw is converted into equivalent US gallon by dividing with 33.7. then divided with 3600 to convert hour to sec. and to convert us gallon to m^3, multiplied with 0.00378541 and added with fuelvolflw. then integrated and again converted to US gal by multiplying with 264.172. saturation block (Limit input signal to the upper and lower saturation values) is used with upper limit as inf and lower limit as 10^-3 and then the output is given to US MPG calc block
- the calculated vehspd is divided by calculated fuelvolflw with battpwr output and given to rate transition block (transfers data from the output of a block operating at one rate to the input of a block operating at a different rate) and finally connected to the performance and FE scope for observing results.
the model calculates miles per gallon by dividing the output from vehicle speed and from the combination of fuel volume flow and battery power.
FACTORS CONSIDERED TO MODEL FUEL FLOW
- The fuel flow source is mapped with the engine block hence the main factor considered to model fuel flow is in engine block.
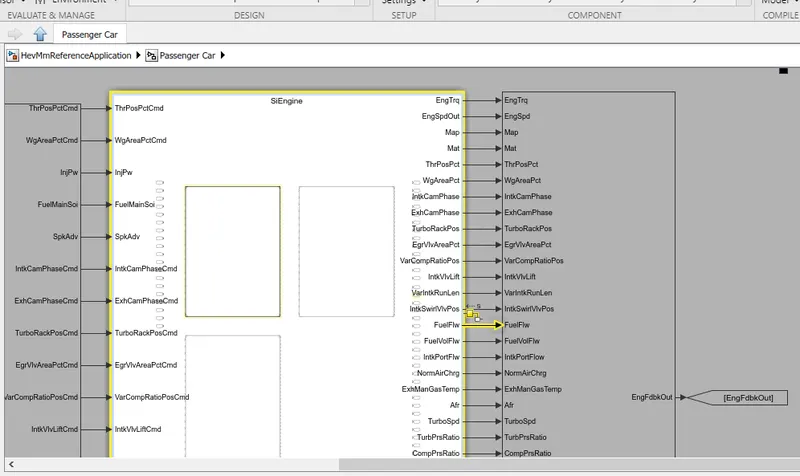
- here let us consider si mapped engine and si dynamic engine
SI mapped engine
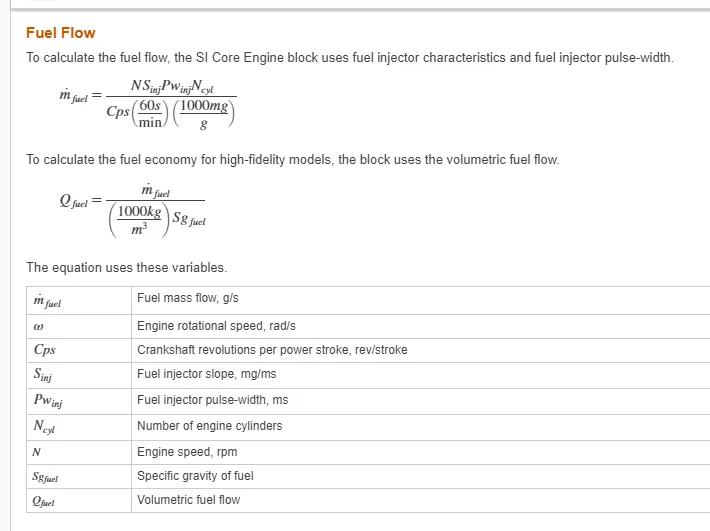
- factors considered are - fuel mass flow, specific gravity of fuel, volumetric fuel flow.
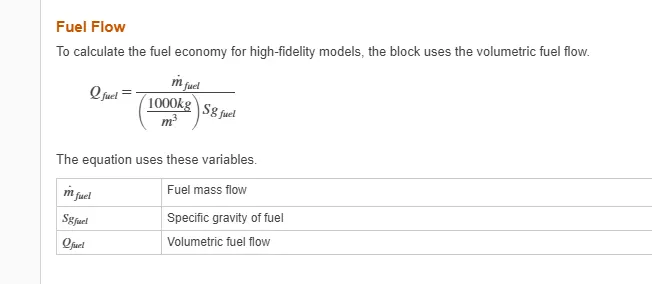
SI dynamic engine
- factors considered are - fuel mass flow, engine rotational speed, fuel injector pulse-width/slope, num of cylinders, engine speed, specific gravity, and volumetric fuel flow.
RESULT
- Thus the miles per gallon calculation of the model and the factors considered to model fuel flow are explained.
3. AIM
- To run the HEV ReferenceApplication with WOT drive cycle, changing the grade and wind velocity in the environment block, and to comment on the results.
EXPLANATION
- open the HEV ReferenceApplication
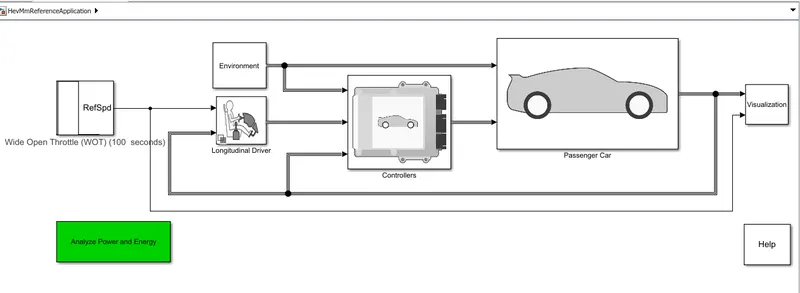
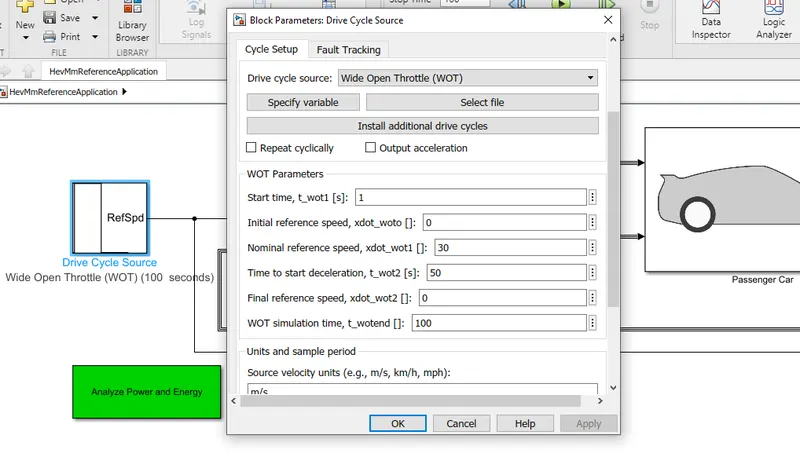
- in the drive cycle source select wide open throttle (WOT)
- enter the reference speed, deceleration start time, and simulation time
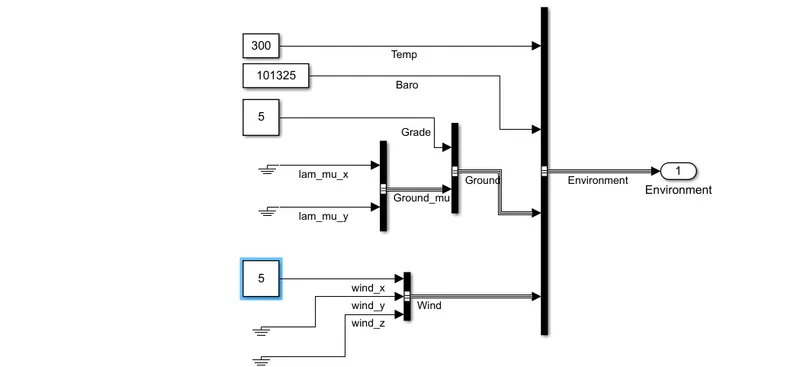
- select environment block
- change grade and wind velocity to 5.
- set stop time to 100 and run the model
OUTPUT
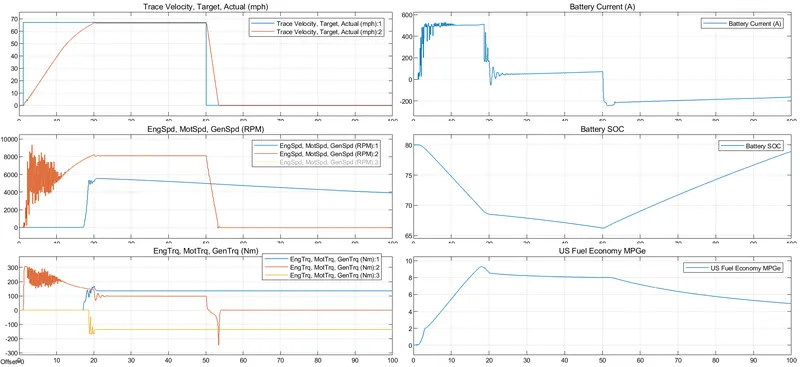
- There are 6 windows showing results of 1. trace velocity vs actual velocity 2. engine, motor, generator speed(RPM) 3. engine, motor, generator torque(Nm) 4. battery current(A) 5. Battery soc 6. US fuel economy MPGe
CONDITION 1 (ENGINE NOT RUNNING/BATTERY USED/INITIAL START)
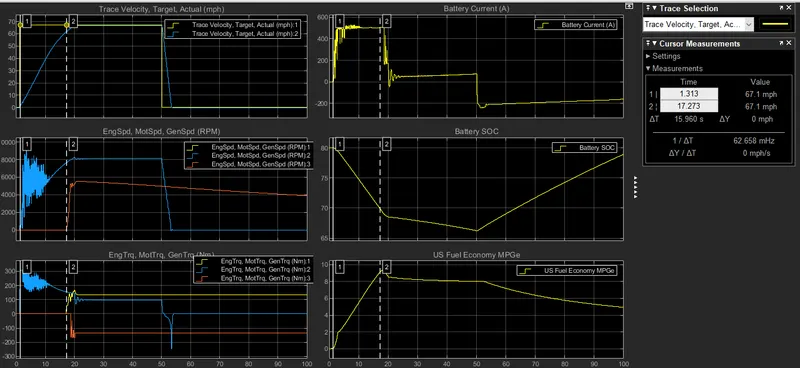
- from 1 to 17.2 sec - we can observe that engine speed is 0 (engine not running), only the motor speed is used at almost 9500 rpm (motor running) with battery currently being used almost 500A. the battery soc being dropped from 80 - 70 (battery power in use) and the fuel economy raised to 9 MPGe.
- Only battery is used - indicating more current is used, more discharge in battery, maximum fuel economy up to 9 MPGe.
CONDITION 2 (ENGINE RUNNING/BATTERY USED/RUNNING WITH NOMINAL SPEED REFERENCE)
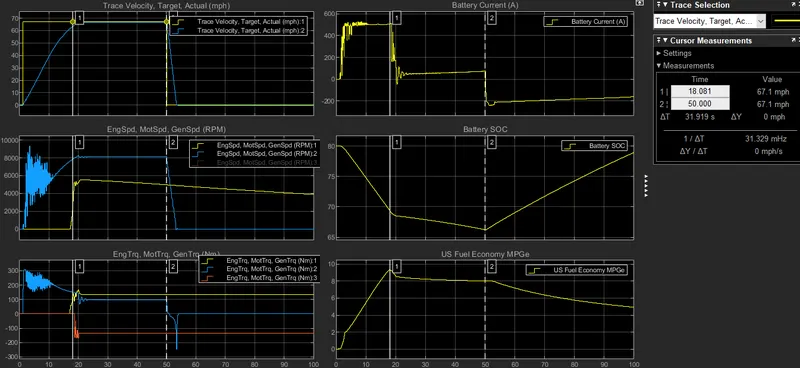
- from 18 to 50 sec - we can observe that engine speed almost 5900 rpm (engine running), motor speed almost 8000 rpm (motor running), battery currently using 80 - 100 A, battery state of charge being dropped from 70 - 64 (battery power in use), and the fuel economy is around 8 MPGe.
- both engine and battery are used, still battery discharge percentage and current used are very less due to the engine running.
CONDITION 3 (ENGINE IDLE/BATTERY CHARGING/ACCELERATION PEDAL OFF)
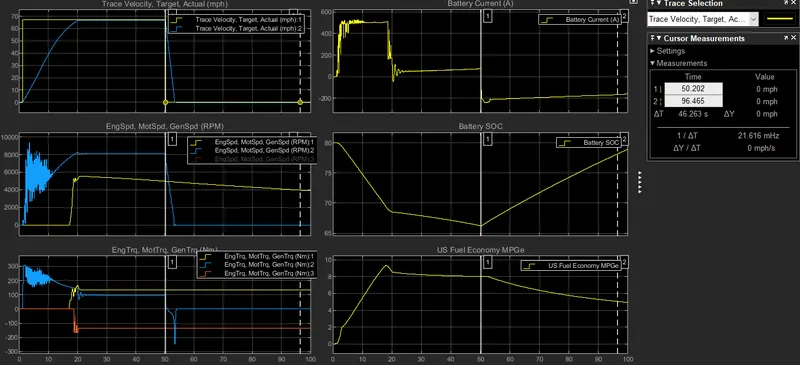
- from 50 sec - we can observe the engine run from 5000 - 4000 rpm(eng running), motor drops from 8000 - 0 rpm(motor stops), battery soc being raising 64 - 80 (charging), the battery current graph shows negative since the battery is charging, and the fuel economy drops to 5 MPGe
- the engine is in idle condition, velocity is 0 (acceleration pedal off)
RESULT
- Thus the HEV ReferenceApplication model is simulated with WOT drive cycle, changed grade, and wind velocity, and the results are commented.
4. AIM
- To compare the simulated results of HEV ReferenceApplication and EV ReferenceApplication with the same parameter from the above case.
PERFORMANCE AND FE SCOPE
1. HEV ReferenceApplication
2. EV ReferenceApplication with same WOT drive cycle and same environment block
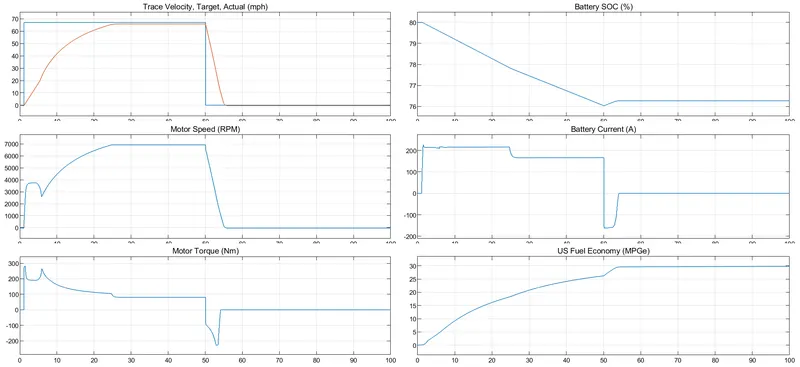
COMPARISION
From the 2 results, we can observe the following
- The velocity(red plot) in EV takes more seconds to reach the nominal velocity than in HEV because of the maximum motor speed allocated.
- the max motor speed of EV - 7000 RPM, where the max motor speed of HEV is 9500 RPM.
- there is no rise in battery soc in EV, compared to HEV because EV uses only battery power and it only gets charged to little percentage at the time of deceleration period.
- the fuel economy is very high in EV 30 MPGe, compared to HEV max 9 MPGe.
- In terms of fuel economy EV beats HEV.
- In terms of charging while deceleration HEV is advantageous than EV since the engine charges the battery.
RESULTS
- Thus the simulated results of HEV ReferenceApplication and EV ReferenceApplication with the same parameter have been compared.
REFERENCE
- MATLAB help documentation