Week-4 Challenge WOT Condition Part-2
1. Different between Mapped and Dynamic models Engine , Motor and Generator
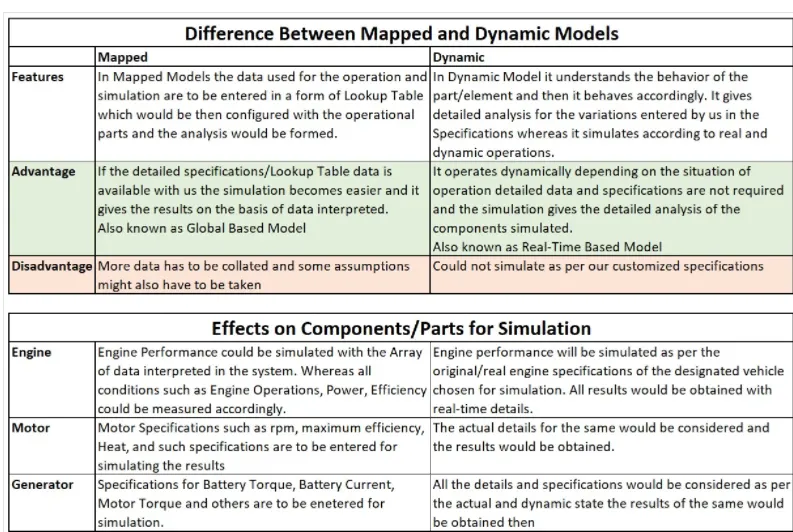
Example of Charging Model type
As per the screenshot appended below of the Generator of a Hybrid Electric Vehicle
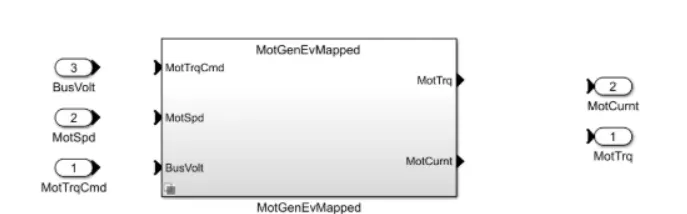
While we enter in the Generator new screen with the below mentioned screen is available
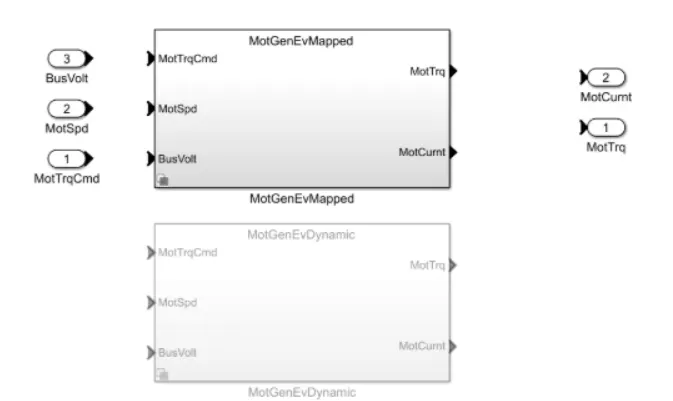
With an Option to select between the mapped Generator and the Dynamic Genarator. Currenty the Mapped Genarator is configured, if we wish to change this to the Dynamic Generator then we just need to follow the steps
select the model which you want to configure->choose Variant Manager -> Right click the Model you wish to choose and then Set as label Model Active choice
2. The Factors considered for indicating the Fuel Efficiency are as mentioned below,
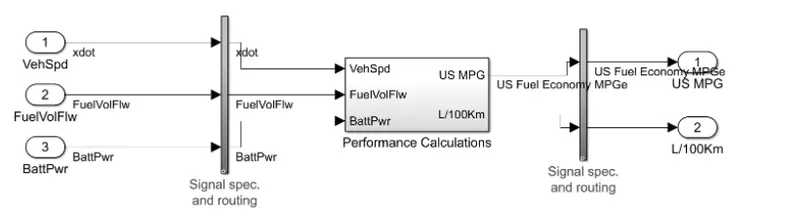
i) Vehicle Speed
ii) Battery power
iii) Fuel Flow
The Conversion to Miles per Gallon and the Fuel Flow is as mentioned with the steps below
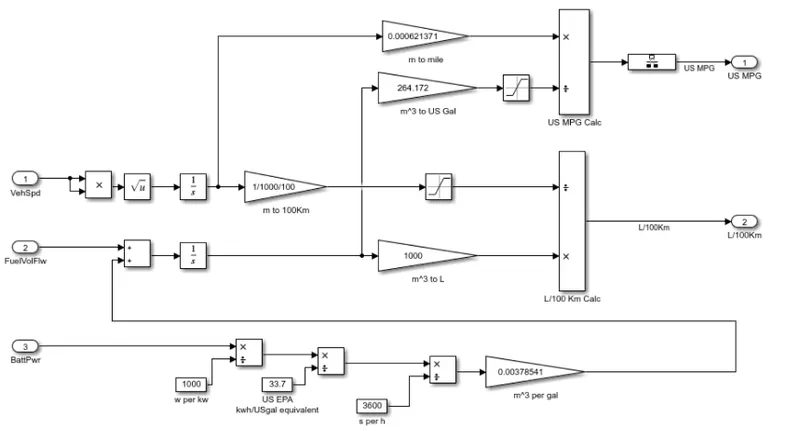
conversion from cubic meter to gallon (m^3 to gallon),
As we know 264.172 US Gallons is 1000L
The reference model taken here for consideration is HEV and as it operate on both the Battery and the fuel injection engine
The final output/fuel efficiency is calculated by keeping in consideration of the battery output ,Fuel output and the Vehicle
Speed/Kilometres Driven.
Therefore the Fuel efficiency is calculated and it is converted after the saturation thus the FE is calculated.
3.HEV - WOT Drive Cycle (Data Input)
performance Scope - WOT Cycle
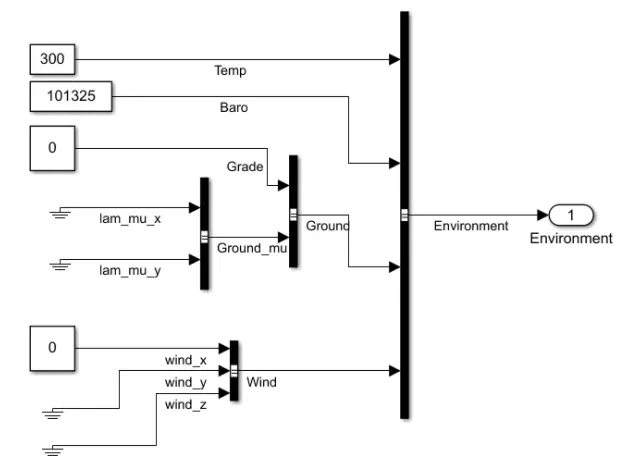
The observation from the results as compared to the normal situation are mentioned below.
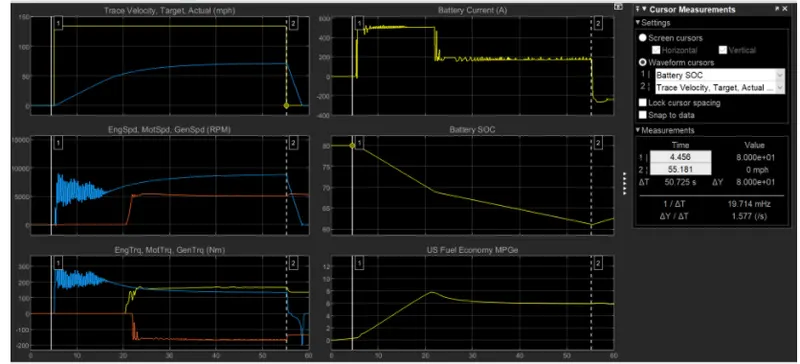
Comments/Comparison of the results obtained.
1. Plot 1 ( Trace Velocity Target vs Actual)- This is clearly visible that as the grade and the wind velocity is increased compared to the normal state the vehicle is not able to reach the target velocity.
2. Plot 2 (Engine Speed, Motor Speed )rmp -In this plot comparing with the normal plot the Engine speed has reduced to a steep slope on the negitive side as compared to the normal situation the grade is increasing the load on the engine and thus the targeted Engine speed is not met.
3.plot 3(Engine Torque ,Motor Torque, Generator Torque)Nm- There are multiple variation in all these aspect and the same is visiable in both the results of Normal and with the Grade and Wind velocity.
4. Plot 4( Battery Current A- Battery current has been fluctuating at a higher range as compared to the normal after the vehicle is reaching near to the stead / stable pace the fluctuation starts and is simulated.
5.plot5( battery SOC )- The Battery State of charge remains more or less similar in both the cases and are resulted at 65% after the end of the WOT cycle.
6.plot 6(US Fuel Economy) MPGe - The average fuel economy differ in the range of 6 and 9 mph in both the scenarios.
4. Below mentioned vehicle is simulated for the EV Refence
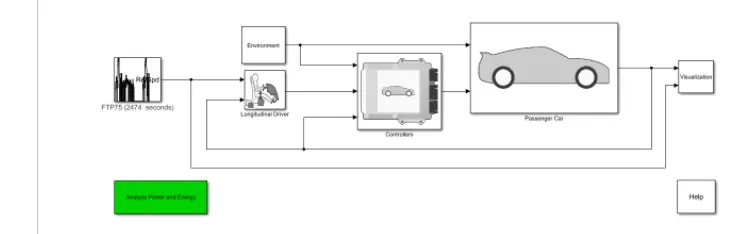
The performance and FE results obtained are appended as below,
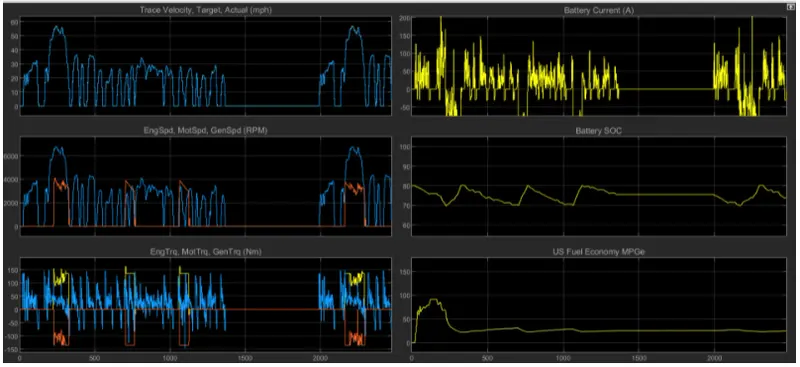
The performance and FE result obtained are appended as above
Remarks-
The overall difference in both these simulation are their vehicle operation where the EV is completely operated on Battery as the power soure and on the other hand the HEV has two power source SI/CI Engine and battery. The results obtained are varied and the parameter are also differenciated accordingly.