Week-4 Challenge WOT Condition Part-2
question 1 :- What is the difference between mapped and dynamic model of engine, motor and generator? How can you change model type?
| Mapped | Dynamic |
|
Model uses a set of steady-state lookup tables to characterize engine performance.The tables provide overall engine characteristics, including actual torque, fuel flow rate, BSFC, and engine-out exhaust emissions. USED -
|
Model decomposes the engine behavior into engine characteristics that are separated into lower-level components. By combining components in this way, the models capture the dynamic effects. USED -
|
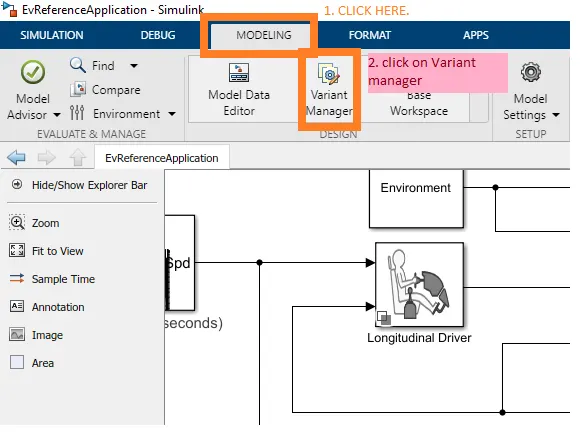
-To changed model type from mapped to dynamic or dynamic to mapped
we can use the variant manager in the modeling tab to find the variant systems we have.
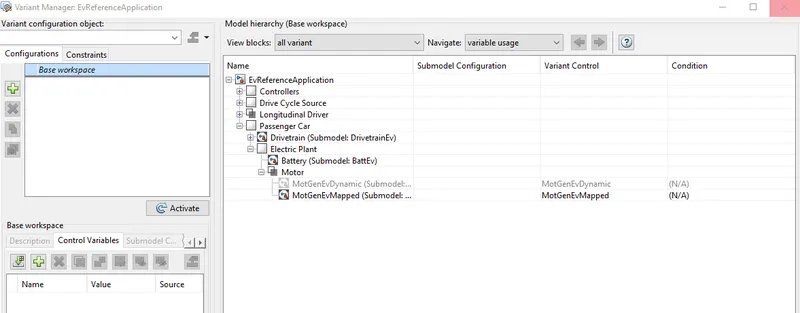
right-click on the model you want and use set as Label mode active choice.
A window will apper change model according to your need you can change model.
----------------------------------------------------------------------------------------------------------------------------
Question 2 - How does the model calculate miles per gallon? Which factors are considered to model fuel flow?
Theory:-
MPG, or miles per gallon, is the distance, measured in miles, that a car can travel per gallon of fuel. MPG is also the primary measurement of a car's fuel efficiency: The higher a car's MPG, the more fuel-efficient it is.
The U.S. Environmental Protection Agency, or the EPA, is the government agency responsible for certifying a vehicle's MPG figures, notes How Stuff Works.
A car's MPG can be inconsistent because it is affected by a number of different factors, so it is difficult to get an accurate measurement. For example, factors like traffic and road conditions can affect MPG in any given context. That's why the EPA runs tests over a standard set of courses, then averages the results to calculate a vehicle's official MPG.
The EPA gives each vehicle three different MPG ratings, as All Car Leasing notes:
- Highway MPG: the average a car will get while driving on an open stretch of road without stopping or starting, typically at a higher speed.
- City MPG: the score a car will get on average in city conditions, with stopping and starting at lower speeds.
- And, combined MPG, a combined average of highway and city MPG.
In recent years, the EPA has expanded its testing capabilities to include alternatively-fuelled vehicles including electric vehicles. These ratings calculate the equivalent amount of energy that a vehicle uses to one gallon of traditional fuel. This allows consumers to compare the fuel efficiency of electric vehicles with regular ones.
MPG is an important metric to know about any vehicle that you're considering purchasing. It tells you about the difference in cost between operating different vehicles by giving you a sense of how much money you're likely to spend on fuel. This becomes especially important when fuel prices are higher, since every bit of savings count for your budget.
While MPG can help you compare different vehicles, it doesn't tell you anything about real-world fuel prices. However, you can easily calculate approximately how much you'll spend on fuel at different price levels, depending on how much distance you drive on a regular basis.
How does the model calculate miles per gallon?
-To calculate the fuel flow, vehicle speed & battery power are taken into consideration.
HEV model has separate blocks to calculate the MPG Which are shown below.
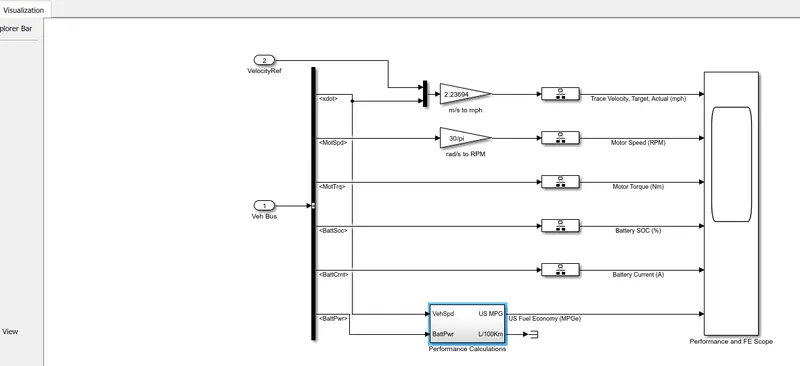
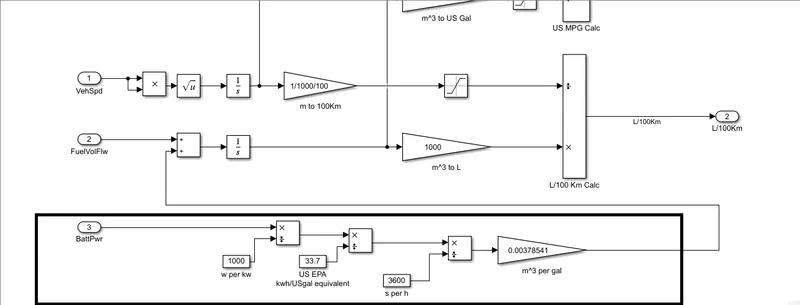
The above MPG calculation is for HEV which means it contains both fuel and battery energy.
-First, we get battery power in watt which is converted into kwatt and further converted into kw/h
-Then it's is converted into US gallon equivalent energy by dividing it by the standard value 33.7. Then converted into US gallons per second
-It is multiplied by standard value 0.00378541 to get volume in meter cube per gallon and it is added to the fuel flow for total value as it is an HEV
-Further meter Cube is converted into US gallon.
On the other hand, the speed of the vehicle is integrated to get distance and the distance which is in the meter is converted into mile by multiplying the standard value 0.000621371
FOR EV's
In the case of pure electric vehicle (EV) the term miles per gallon equivalent to (MPGe)
While the use of MPGe helps compare fuel efficiencies between vehicles, it has some limitations. The first limitation is that MPGe, like MPG, suffers from the "MPG illusion." So a better unit might be GGE per 100 miles or gasoline liter equivalents per 100 kilometers. The second limitation is that calculating the CO2 emissions for an alternative fuel vehicle becomes difficult. The EPA only includes tailpipe emissions for vehicles. This is not much of a problem for gasoline or diesel fuel because of their energy density compared to production, transportation, and storage emissions. However, CO2 emissions from the electricity needed to compress natural gas, keep liquid natural gas cold, or separate water to make hydrogen, or charge a battery are significant and are not included. Depending on the location and type of fuel, it is possible that using an alternative fuel vehicle will produce more CO2 emissions or use more energy than a similarly sized gasoline or diesel-fueled vehicle
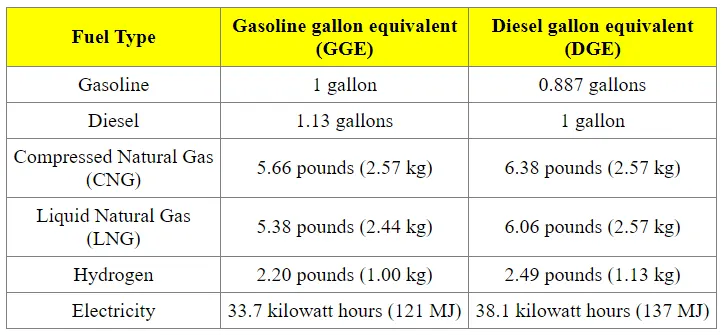
Here the value 33.7 kwh is the battery power required to get the energy equivalent to the energy which is obtained by consuming the 1 gallon of gasoline .it is calculated by the United States Environmental Protecting Agency(EPA).
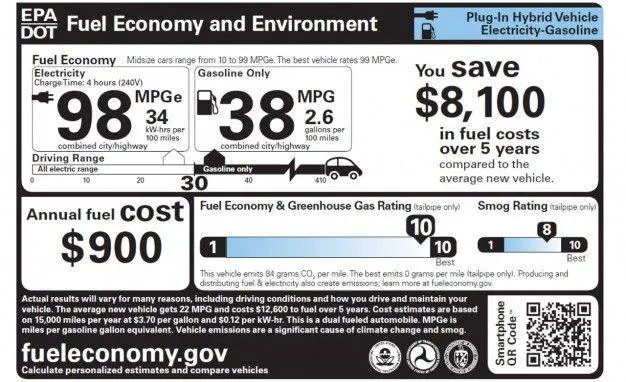
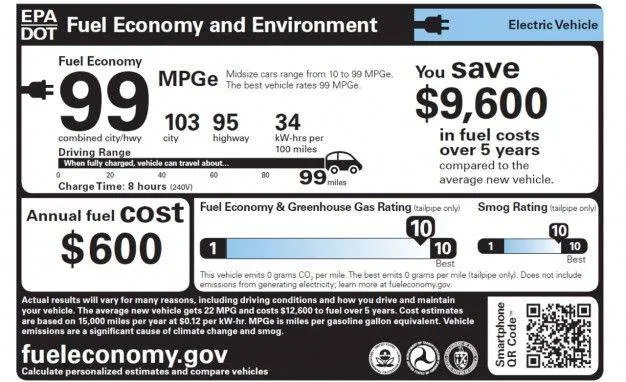
There are sample stickers of HEV and EV provided by EPA:-
1) For HEV:-
For EV:-
----------------------------------------------------------------------------------------------------------------------------------------------------------------------------------------------------------------------------
Question 3 :-
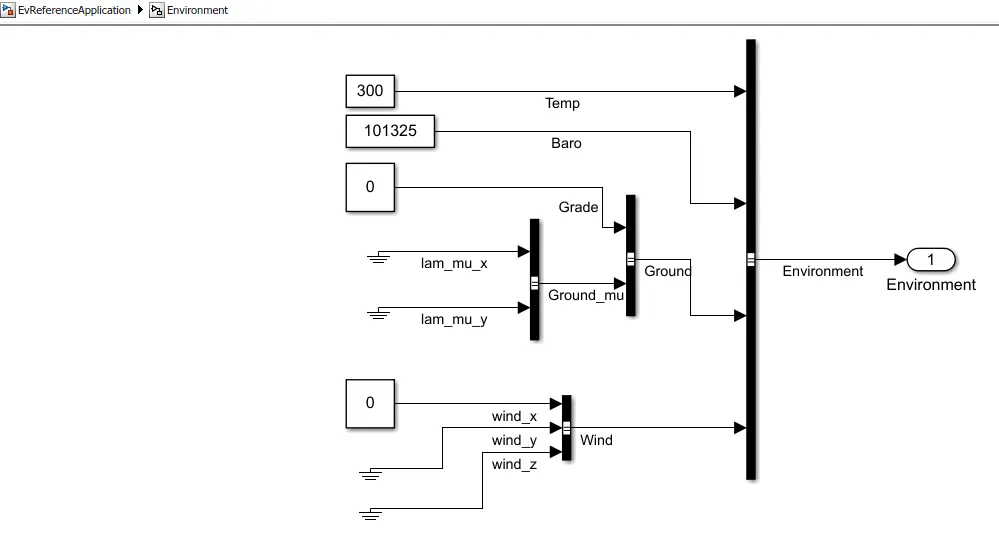
Run the HEV ReferenceApplication with WOT drive cycle. Change the grade and wind velocity in the environment block. Comment on the results.
steps that we carried out for this simulation
-first, we open a reference application for HEV from sources by Matlab help section.
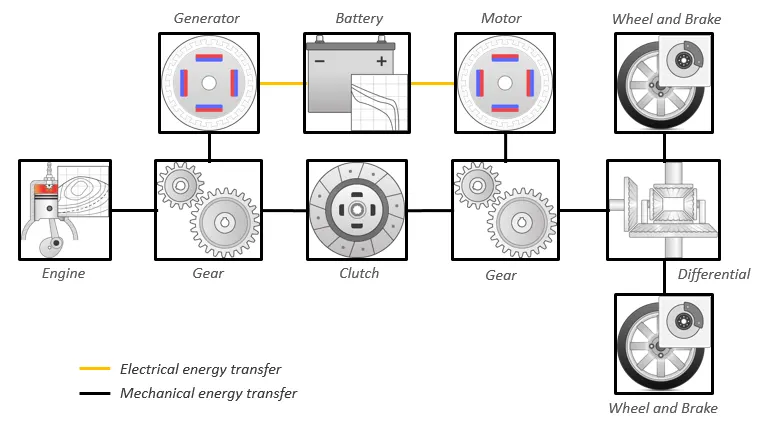
This diagram shows the powertrain configuration.
Case1
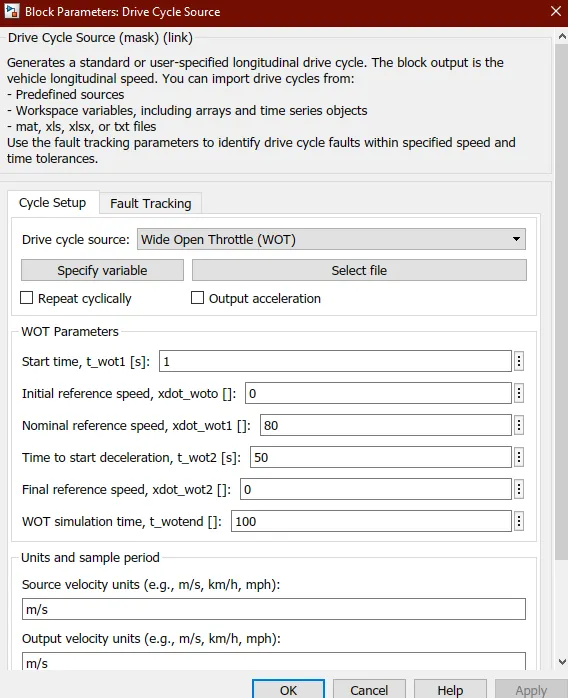
Simulation condition:
The simulation is done for Hybrid electric vehicle with Wide open Throttle Drive cycle.The Total cycle time = 100 seconds
The Top speed of this cycle = 80 mph
Time to start deceleration = 50seconds
The Grade angle = 0 degrees
The wind velocity = 0 m/s
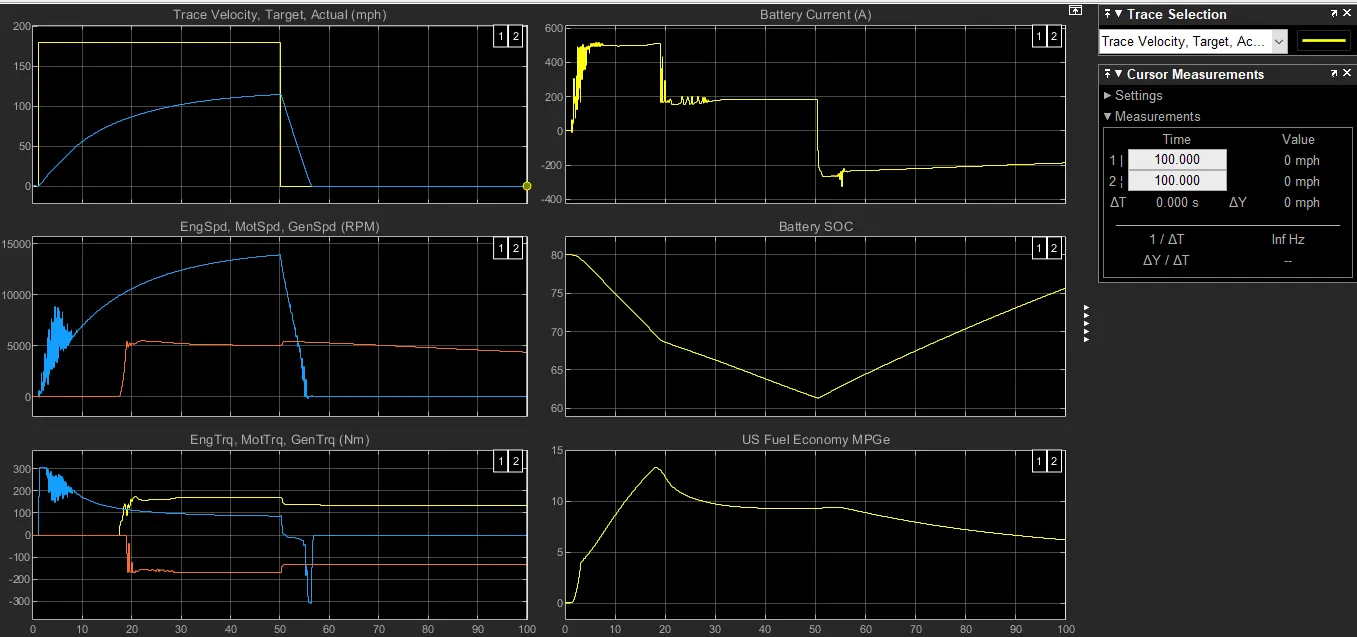
plot 1:
The acceleration time to reach 80 mph - 16.7 seconds
The deceleration time from 80 to minimum = 6.2 seconds
plot 2:
Shows the changes in speed of the Engine,motor and Generator in Rpm throughout the drive cycle.
Peak Engine speed = 4780 Rpm
Peak Motor speed = 9497 Rpm
plot 3:
Shows the Torque characteristics and its changes of engine,motor and generator in (Nm) throughout the drive cycle.
Peak Engine torque = 138.7 Nm
Peak Motor torque = 206.7 Nm
Peak Generator torque = 42.2 Nm
plot 4:
Shows the Battery Current values (A) and its changes for various acceleration inputs as per the Drive cycle.
The peak current discharge from the battery = 163.5A
The peak current charging to the battery = -150.86 A
Plot 5:
Shows the Battery state of charge SOC (%) and its changes corresponding to the driving inputs.
The state of charge decreased from 60% to 39.8% of charge in a time period of 49.3 seconds , for the specified driving conditions.
Plot 6:
Shows the Fuel Economy as Mile per Gallons for the corresponding input driving conditions.
The maximum miles that the car can run per gallon of fuel equivalent = 46 Miles,for the given vehicle at the specified driving conditions.
Case2
Simulation Condition:
The simulation is done for Hybrid electric vehicle with Wide open Throttle Drive cycle.
The Total cycle time = 100 seconds
The Top speed of this cycle = 80 mph
Time to start deceleration = 50seconds
The Grade angle - 8 Degrees
The wind velocity = 10 m/s.
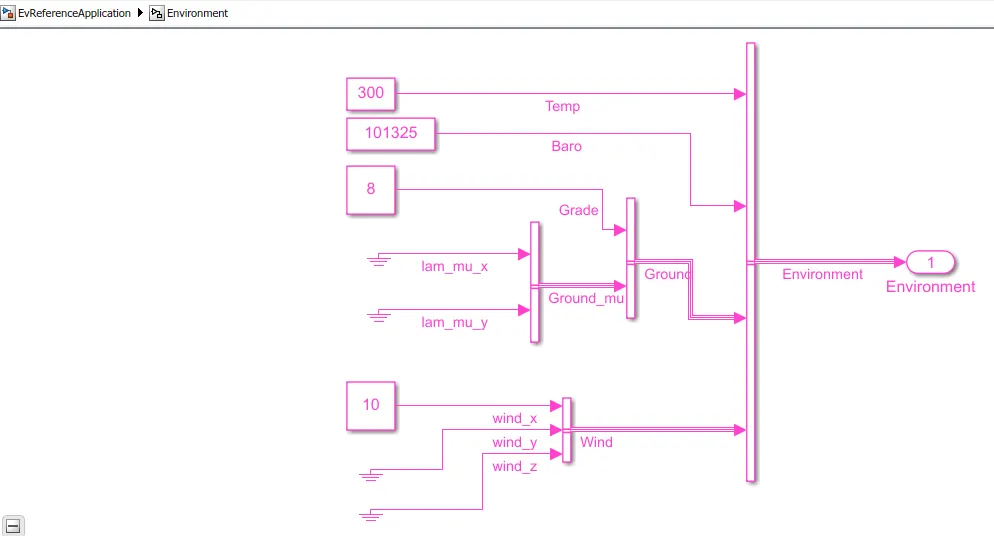
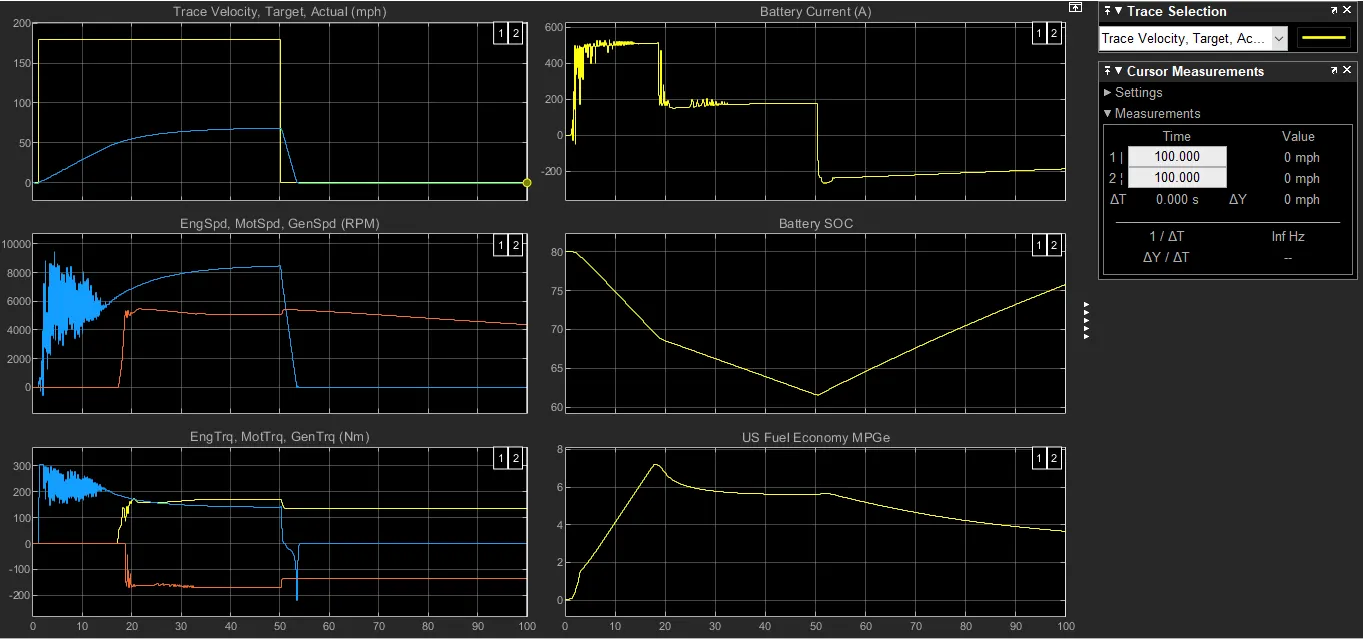
- In all the results we can observe some changes from the previous case
- Though the vehicle parameters and the drive cycle are the same ,here we have considered some changes in the environment blocks by adding some hill climb angles and wind velocity.
- The changes in the results are given below.
plot 1:
Shows the velocity of the vehicle with respect to the Drive cycle data with the Time scale on the x axis.
The top speed of 80 mph cannot be achieved as we have some additional forces acting and so the car can only run upto 67.2 mph
The acceleration time to reach top speed of 67.2 mph = 44.5 seconds
The deceleration time from 80 to minimum = 5.06 seconds
plot 2:
Shows the changes in speed of the Engine,motor and Generator in Rpm throughout the drive cycle.
Peak Engine speed = 4676 Rpm
Peak Motor speed = 8103.5 Rpm
Peak Generator speed = 12858.5 Rpm
plot 3:
Shows the Torque characteristics and its changes of engine,motor and generator in (Nm) throughout the drive cycle.
Peak Engine torque = 139.6 Nm ; Peak Motor torque = 206.4 Nm
Peak Generator torque = 48.2 Nm
plot 4:
Shows the Battery Current values (A) and its changes for various acceleration inputs as per the Drive cycle.
The peak current discharge from the battery = 167.6A
The peak current charging to the battery = -152.46 A
Plot 5:
Shows the Battery state of charge SOC (%) and its changes corresponding to the driving inputs.
The state of charge decreased from 60% to 25.98 % of charge in a time period of 49.3 seconds , for the specified driving conditions.
Plot 6:
Shows the Fuel Economy as Mile per Gallons for the corresponding input driving conditions.
The maximum miles that the car can run per gallon of fuel equivalent = 17.93 Miles,for the given vehicle at the specified driving conditions.
Observation:
- The simulation results for both the cases is found and we can see that the simulation 1 without the inclusion of hill climbing conditions and the wind drag velocity is much more efficient when compared to the simulation which includes the hill climbing conditions and the wind drag velocity.
- The vehicle was not able to achieve the required top speed though using the highest possible current discharge of that same battery used before.
- The state of charge also shows that the discharge is also high compared to the simulation 1
- The Fuel Economy is also down to half of the previous simulation.
- So one can say, it is evident that the efficiency of no load vehicle is high compared to the vehicle with additional loads acting on them and also we have visualized this using the Powertrain blockset
--------------------------------------------------------------------------------------------------------------------------------------------------------------------------------------------------------------------------------------------------------------------------
Question 4. Keeping all other parameters same, compare the simulated results of hybrid and pure electric powertrains.
Pure Electric Vehicle:
- A battery electric vehicle or pure Electric vehicle is a EV that exclusively uses chemical energy stored in rechargable battery packs with no secondary source of propulsion (e.g. hydrogen fuel cell, internal combustion engine, etc.) of energy.
- BEVs use electric motors and motor controllers instead of an conventional Internal combustion engines for propulsion. They derive all power from battery packs.
- So they don't produce any emission of waste gas and they are eco friendly.
- They also have their own limitations such as range etc.
- Example of Pure EV is Nissan Leaf.
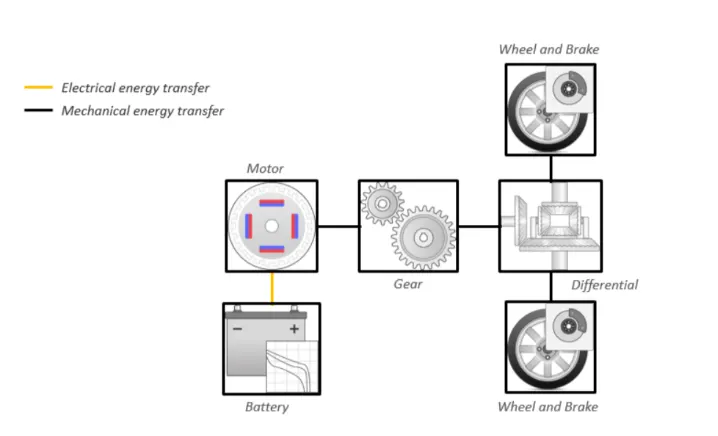
- Now comparing both the Pure electric and Hybrid electric vehicle with the given conditions in a simulation to observe the behaviour of both the type.
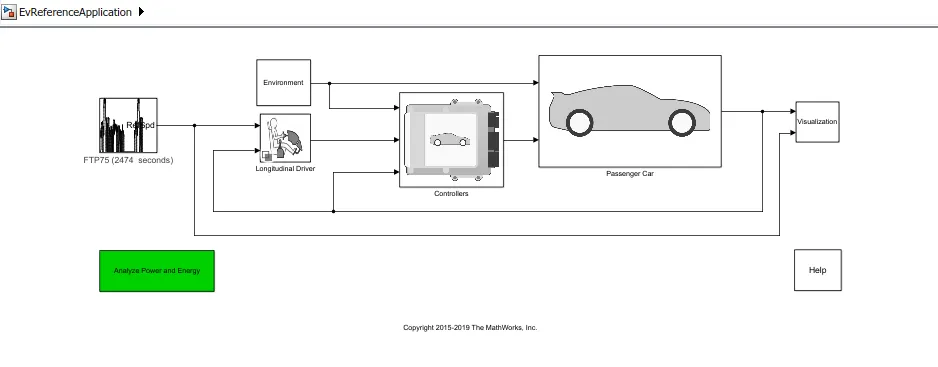
Case1
Simulation Condition:
The simulation is done for pure electric & Hybrid electric vehicle with Wide open Throttle (WOT) Drive cycle.
The Total cycle time = 100 seconds
The Top speed of this cycle = 80 mph
Time to start deceleration = 50 seconds
The Grade angle = 0 Degrees
The wind velocity = 0 m/s.
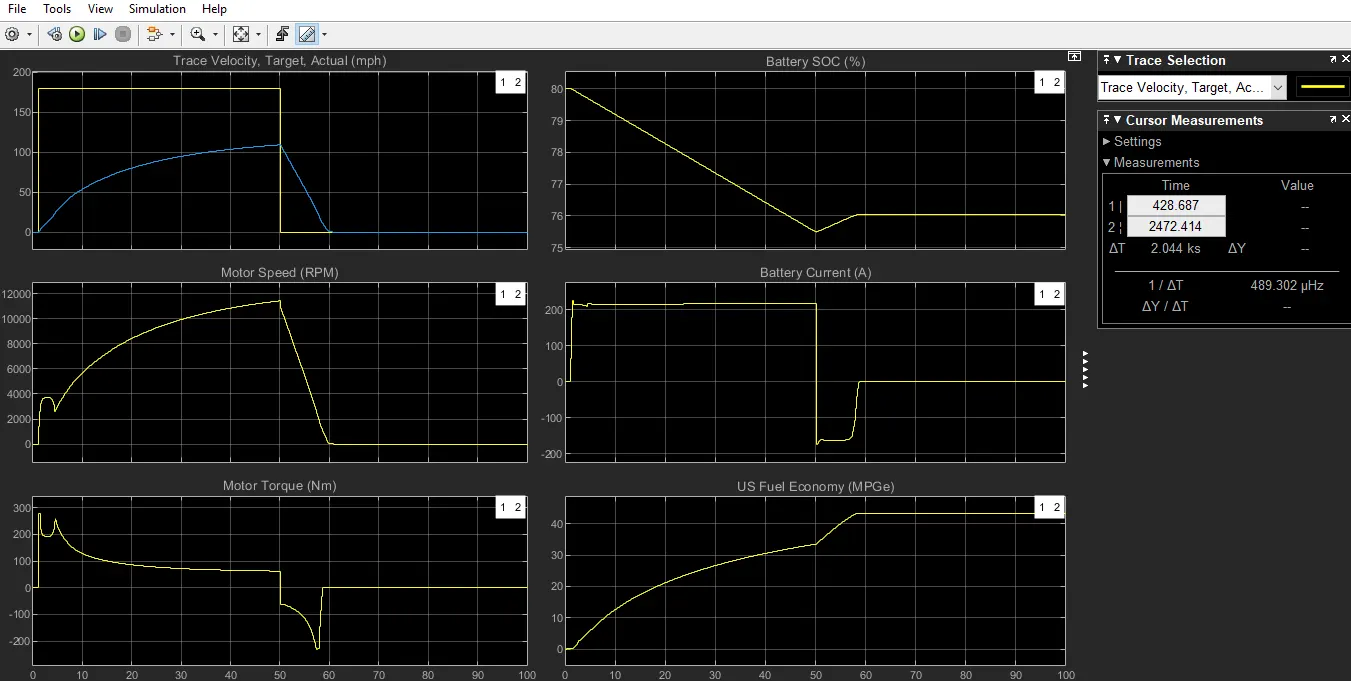
plot 1:
Shows the velocity of the vehicle with respect to the Drive cycle data with the Time scale on the x axis.
The top speed of 80 mph cannot be achieved as we have some additional forces acting and so the car can only run upto 108.9mph
The acceleration time to reach top speed of 108.9 mph = 50.2 seconds
The deceleration time from 80 to minimum = 9.8 seconds
plot 2:
Shows the changes in speed of the Motor in Rpm throughout the drive cycle.
Peak Motor speed = 1123 Rpm
plot 3:
Shows the Torque characteristics and its changes of Motor in (Nm) throughout the drive cycle.
Peak Motor torque = 260 Nm
plot 4:
Shows the Battery Current values (A) and its changes for various acceleration inputs as per the Drive cycle.
The peak current discharge from the battery = 216.8 A
The peak current charging to the battery = -173.7 A
Plot 5:
Shows the Battery state of charge SOC (%) and its changes corresponding to the driving inputs.
The state of charge decreased from 80% to 75.5% of charge in a time period of 50.3 seconds , for the specified driving conditions.
Plot 6:
Shows the Equivalent Fuel Economy as Mile per Gallons for the corresponding input driving conditions.Here there is no fuel in pure electric vehicle however this gives equivalent battery energy required that of the fuel energy,and calculates the Fuel efficiency.The maximum miles that the car can run per gallon of fuel equivalent = 20.45 Miles,for the given vehicle at the specified driving conditions.
Case2
Simulation Condition:
The simulation is done for pure electric & Hybrid electric vehicle with Wide open Throttle (WOT) Drive cycle.
The Total cycle time = 100 seconds
The Top speed of this cycle = 80 mph
Time to start deceleration = 50 seconds
The Grade angle = 8 Degrees
The wind velocity = 10 m/s.
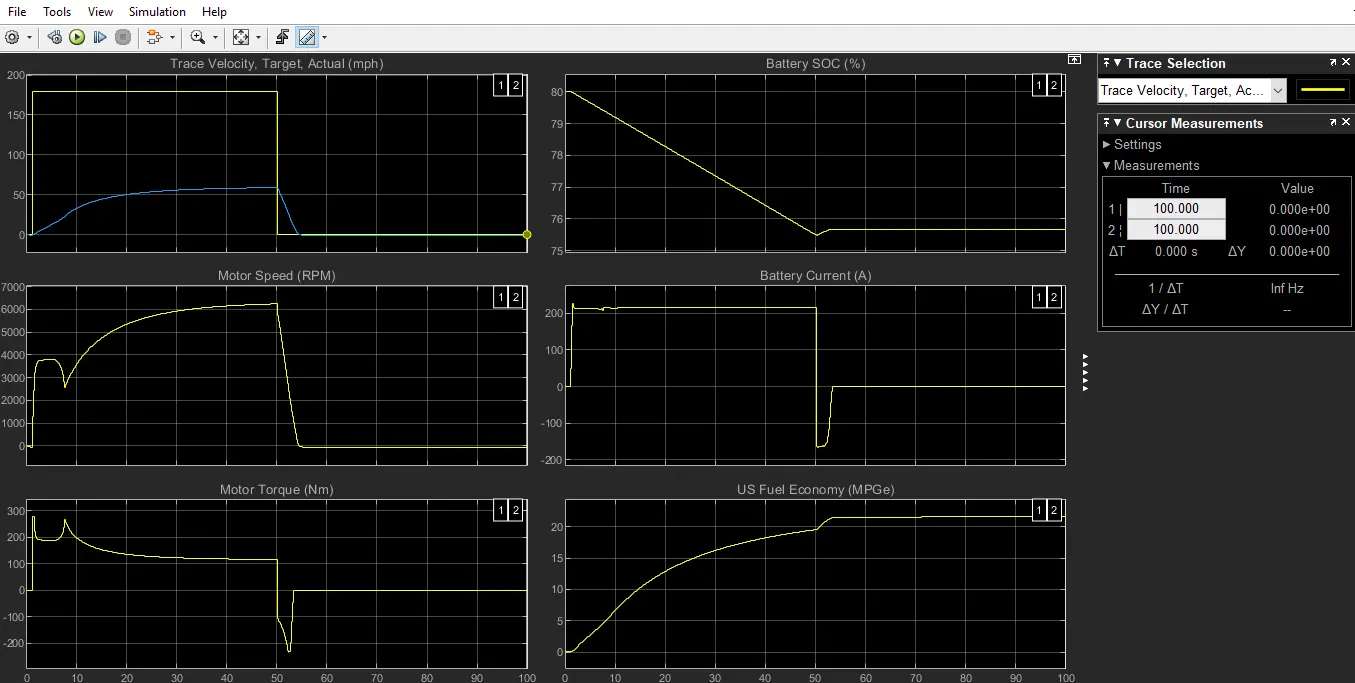
plot 1:
Shows the velocity of the vehicle with respect to the Drive cycle data with the Time scale on the x axis.
The top speed of 80 mph cannot be achieved as we have some additional forces acting and so the car can only run upto 58.9mph
The acceleration time to reach top speed of 58.9 mph = 48.8 seconds
The deceleration time from 80 to minimum = 4.63 seconds
plot 2:
Shows the changes in speed of the Motor in Rpm throughout the drive cycle.
Peak Motor speed = 6254 Rpm
plot 3:
Shows the Torque characteristics and its changes of Motor in (Nm) throughout the drive cycle.
Peak Motor torque = 280 Nm
plot 4:
Shows the Battery Current values (A) and its changes for various acceleration inputs as per the Drive cycle.
The peak current discharge from the battery = 225.8 A
The peak current charging to the battery = -163.7 A
Plot 5:
Shows the Battery state of charge SOC (%) and its changes corresponding to the driving inputs.
The state of charge decreased from 80% to 75.5% of charge in a time period of 49 seconds , for the specified driving conditions.
Plot 6:
Shows the Equivalent Fuel Economy as Mile per Gallons for the corresponding input driving conditions.Here there is no fuel in pure electric vehicle however this gives equivalent battery energy required that of the fuel energy,and calculates the Fuel efficiency.The maximum miles that the car can run per gallon of fuel equivalent = 21.45 Miles,for the given vehicle at the specified driving conditions.
Observation(EV VS HEV):
1. The electric vehicle when compared with hybrid electric vehicle with the same environmental and Drive cycle conditions results in less top speed achievement .The electric vehicle produces more values of Motor speed and motor torque compared to the hybrid vehicle's motor alone,but hybrid vehicle when it combines the torque of both motor and its engine it is higher than the electric vehicle's torque.This is responsible to pull the Hybrid car at higher top speed compared to the pure electric.
2. As the pure electric car here uses Lithium-ion battery compared to the Nickel metal hydride battery the discharging capacity and the rate of charging is higher in the pure electric car. As it is able to discharge in a fast rate the motor can produce high amount of torque instantly compared to the hybrid vehicle. Also the state of charge shows the battery efficiency of the pure electric to be higher than the hybrid vehicle and this is also due to the battery type used in these cars.
3. The efficiency of the Electric car is higher than the hybrid car which is evident from the miles per gallon numbers of both of these cars.