Project 1 - Parsing NASA thermodynamic data
AIM:
To write a code in MATLAB to parse nasa thermodynamic data file and then calculate thermodynamic properties of various gas species.
OBJECTIVE:
- Write a function that extracts the 14 coefficients and calculates the enthalpy,entropy and specific heats for all the species in the data file.
- Calculating molecular weight of each species.
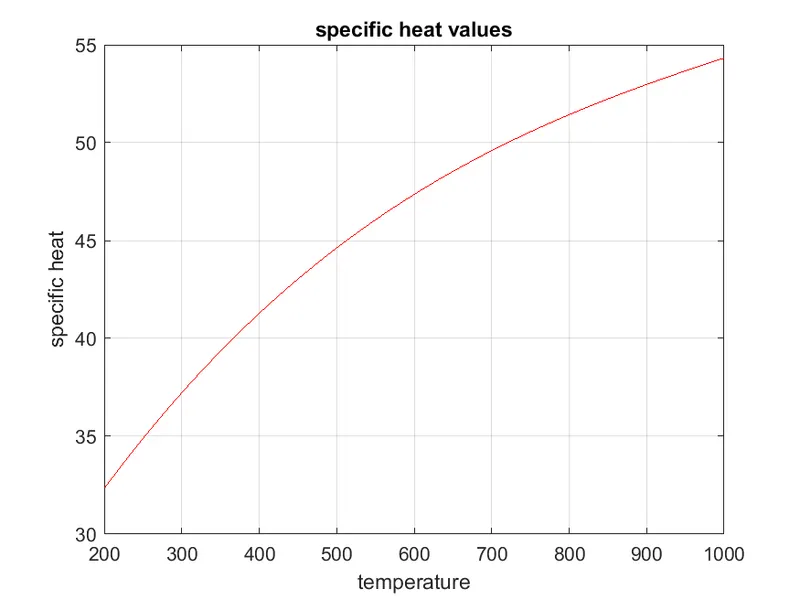
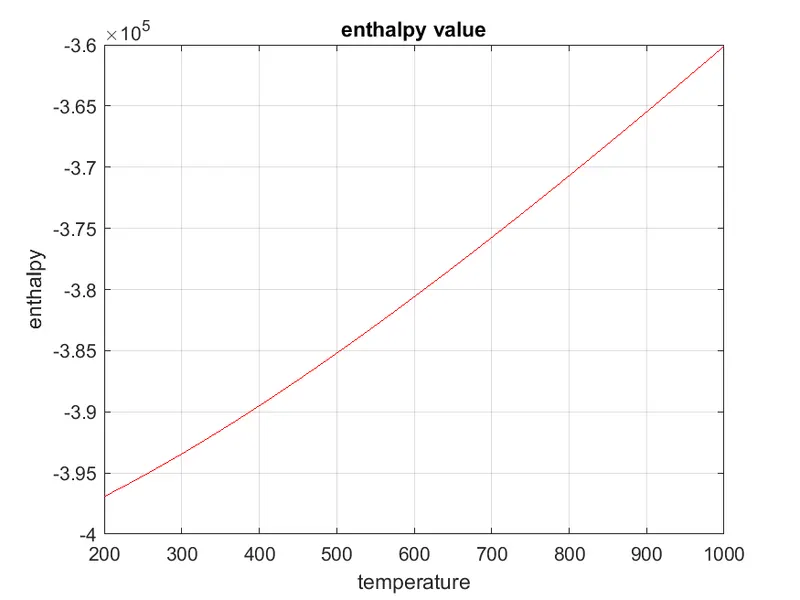
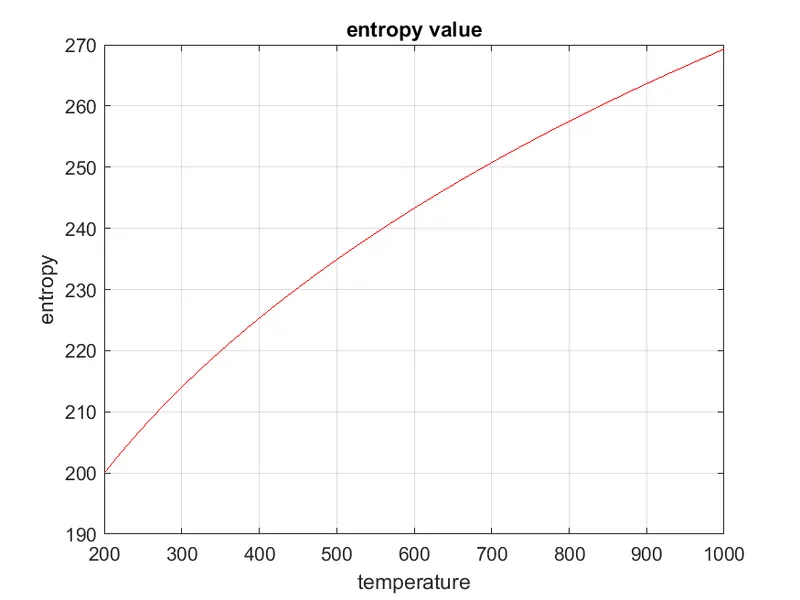
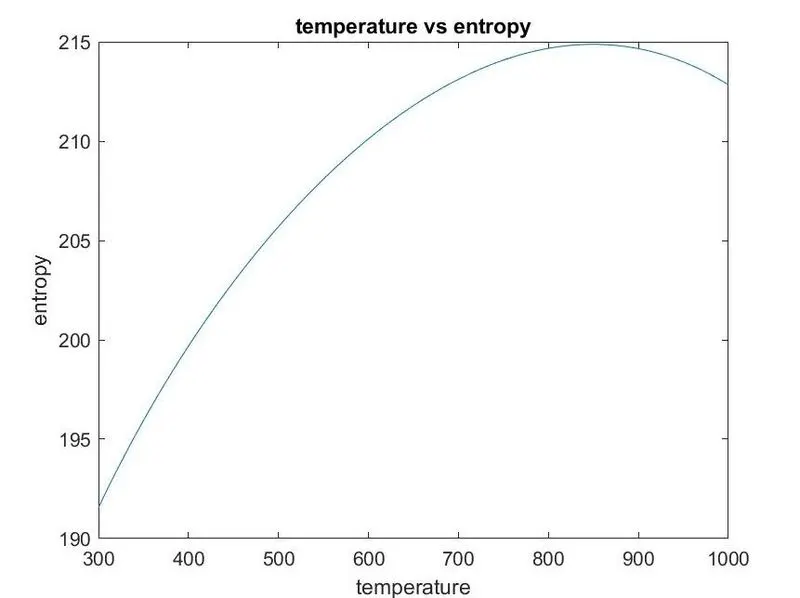
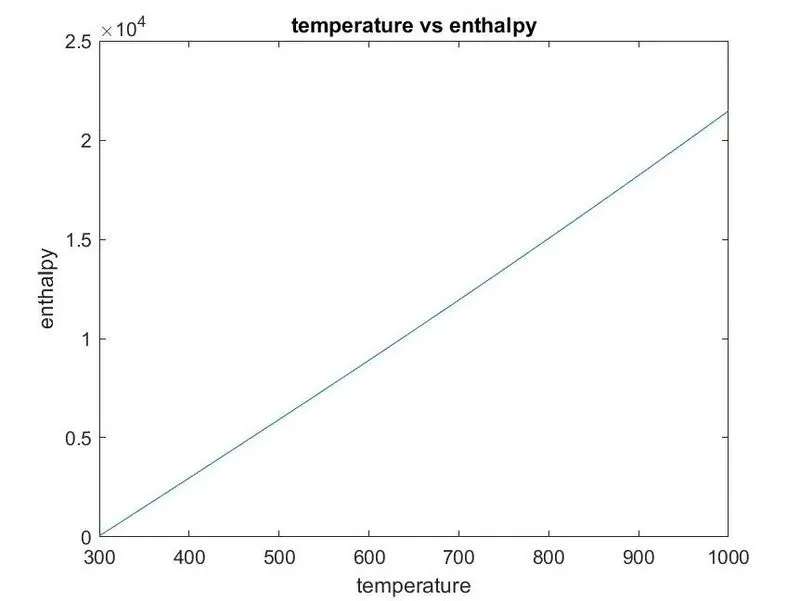
- Plotting the specific heat,enthalpy and entropy for the local temperature range.
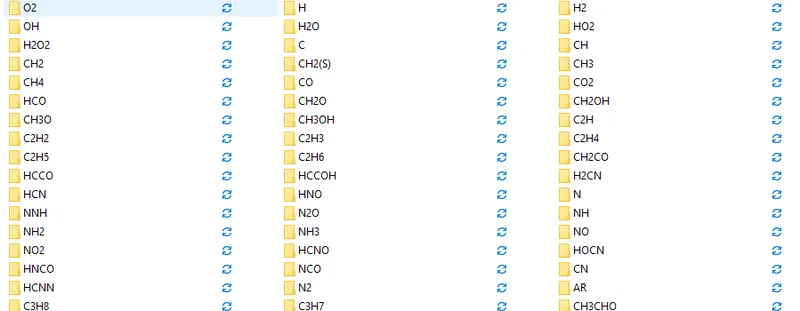
- Saving the plots as images with appropriate names and dumping them in seperate folders for each species.
THEORY:
File Parsing
File parsing is a string or symbol either in natural language computer language or data structure conferming to the rules of the former grammer.
MATHEMATICAL EQUATION:
For specific heat
cpR=b1+b2⋅T+b3⋅T2+b4⋅T3+b5⋅T4
For enthalpy
HRT=b1+b2T2+b3T23+b4⋅T34+b5⋅T45+b6T
For entropy
SR=b1⋅log(T)+b2⋅T+b3⋅T22+b4⋅T33+b5⋅T44+b7
where
T=local temprature
b1-b7=high temperature coefficient
b8-b14=low temprature coefficient
R=Gas constant=8.314
PROGRAM:
function for specific heat
% function for specific heat
function[Cp] = specific_heat(A1,A2,A3,A4,A5,B1,B2,B3,B4,B5,R,T,local_mid_temp)
if T>local_mid_temp
    Cp = (A1+(A2*T)+(A3*(T.^2))+(A4*(T.^3))+(A5*(T.^4))).*R
else
    Cp = (B1+(B2*T)+(B3*(T.^2))+(B4*(T.^3))+(B5*(T.^4))).*R
end
pogram for function of enthalpy
% pogram for function of enthalpy
function[H]= enthalpy(A1,A2,A3,A4,A5,A6,B1,B2,B3,B4,B5,B6,R,T,local_mid_temp)
if T>local_mid_temp

    H = R.*T.*(A1+(A2.*T)./2+(A3.*T.^2)./3+(A4.*T.^3)./4+(A5.*T.^4)./5+A6./T);
else
     H = R.*T.*(B1+(B2.*T)./2+(B3.*T.^2)./3+(B4.*T.^3)./4+(B5.*T.^4)./5+B6./T);

end
end
program for function of entropy
% program for function of entropy
function[S] = entropy(A1,A2,A3,A4,A5,A7,B1,B2,B3,B4,B5,B7,R,T,local_mid_temp)
if T>local_mid_temp
    S = R.*(A1.*log(T) + A2.*T + (A3.*T.^2)./2 + (A4.*T.^3)./3+ (A5.*T.^4)./4+ A7)
else
    S = R.*(B1.*log(T) + B2.*T + (B3.*T.^2)./2 + (B4.*T.^3)./3+ (B5.*T.^4)./4+ B7)
end
end
Main program
clear all
close all
clc
f1 = fopen('THERMO.dat','r')

%skipping the first lline
skippinglines = fgetl(f1)

tline = fgetl(f1)
A = strsplit (tline,' ')
global_low_temp  = str2num(A{2})
global_mid_temp  = str2num(A{3})
global_high_temp = str2num(A{4})

%skipping the next three lines
for i = 1:3
    skkippinglines = fgetl(f1)
end
% create for loop to calculate all species data
for i= 1:53
% taking the local temperature
line1 = fgetl(f1)
[name,local_temp] = strtok(line1,'G')
species_name = strtok(name)
temp = strsplit(local_temp)
local_low_temp  = str2double(temp{2})
local_mid_temp  = str2double(temp{3})
local_high_temp = str2double(temp{4})

%defining the temperature range from local temperature limits
T =  linspace(local_low_temp,local_high_temp,800)

% taking data of species
tline_1 = fgetl(f1)
tline_2 = fgetl(f1)
tline_3 = fgetl(f1)

a = findstr(tline_1,'E')
b = findstr(tline_2,'E')
c = findstr(tline_3,'E')
% here A values are denoted for high temperature coefficient
% here B values are denoted for low temperature coefficient
a1 = tline_1(1:a(1)+3)
A1 = str2num(a1)

a2 = tline_1(a(1)+4:a(2)+3)
A2 = str2num(a2)

a3 = tline_1(a(2)+4:a(3)+3)
A3 = str2num(a3)

a4 = tline_1(a(3)+4:a(4)+3)
A4 = str2num(a4)

a5 = tline_1(a(4)+4:a(5)+3)
A5 = str2num(a5)

b1 = tline_2(1:b(1)+3)
A6 = str2num(b1)

b2 = tline_2(b(1)+4:b(2)+3)
A7 = str2num(b2)

b3 = tline_2(b(2)+4:b(3)+3)
B1 = str2num(b3)

b4 = tline_2(b(3)+4:b(4)+3)
B2 = str2num(b4)

b5 = tline_2(b(4)+4:b(5)+3)
B3 = str2num(b5)

c1 = tline_3(1:c(1)+3)
B4 = str2num(c1)

c2 = tline_3(c(1)+4:c(2)+3)
B5 = str2num(c2)

c3 = tline_3(c(2)+4:c(3)+3)
B6 = str2num(c3)

c4 = tline_3(c(3)+4:c(4)+3)
B7 = str2num(c4)

% defining the value of universal gas constant in (J/mol.k)
R = 8.3145

% calculating specific heat
Cp = specific_heat(A1,A2,A3,A4,A5,B1,B2,B3,B4,B5,R,T,local_mid_temp)

% calculating the enthalpy
H =  enthalpy(A1,A2,A3,A4,A5,A6,B1,B2,B3,B4,B5,B6,R,T,local_mid_temp)

% calculating the entropy
S = entropy(A1,A2,A3,A4,A5,A7,B1,B2,B3,B4,B5,B7,R,T,local_mid_temp)

% calculating the molecular weight of following atoms
atoms = ['H','C','O','N','R','S']
atomic_weight = [ 1 12 16 14 40 32 ]
MW = 0
for i = 1:length(species_name)
    for j = 1:length(atoms)
        if strcmp(species_name(i),atoms(j))
            MW=MW+atomic_weight(j);
            dt = j;
        end
    end
    n= str2double(species_name(i))
    if n>1
        MW=MW+(atomic_weight(dt).*(n-1));
    end
end
fprintf('molecular weight of %s:%f',species_name,MW)
disp(' ')
% plotting the outputs
% creating the file directory to store plots

mkdir(species_name)
cd(species_name)

% plot for specific heat
figure(1)
plot(T,Cp,'color','r')
title('specific heat values')
grid on
xlabel('temperature')
ylabel('specific heat')
saveas(gcf,'temperature vs specific heat .png')

% plot for enthalpy
figure(2)
plot(T,H,'color','r')
title('enthalpy value')

grid on
xlabel('temperature')
ylabel('enthalpy')
saveas(gcf,'temperature vs enthalpy .png')

% plot for entropy
figure(3)
plot(T,S,'color','r')
title('entropy value')
grid on
xlabel('temperature')
ylabel('entropy')
saveas(gcf,'temperature vs entropy .png')
cd(pwd)
cd ..

end
Output in folders
OUTPUT:
For O2
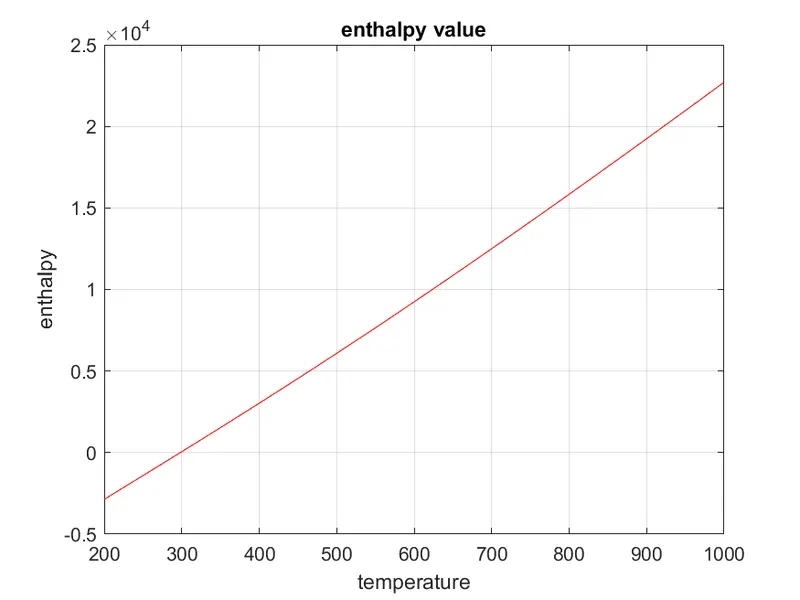
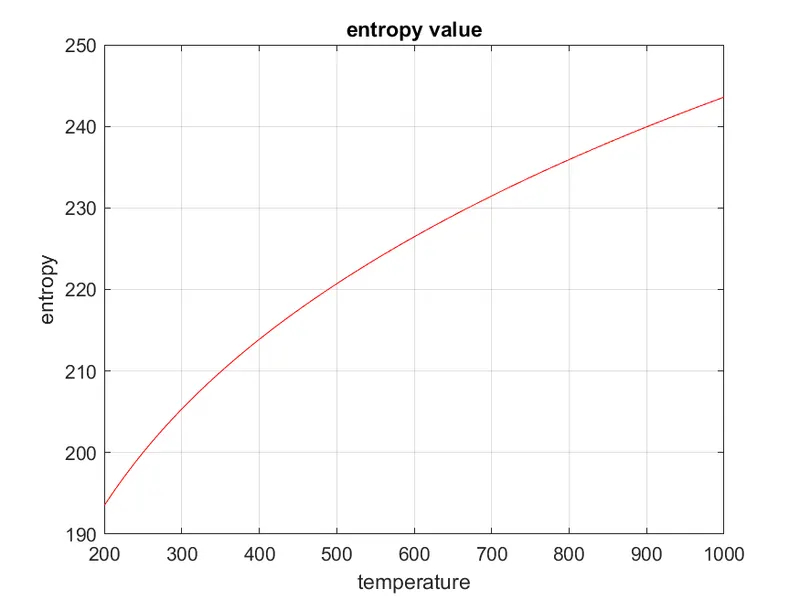
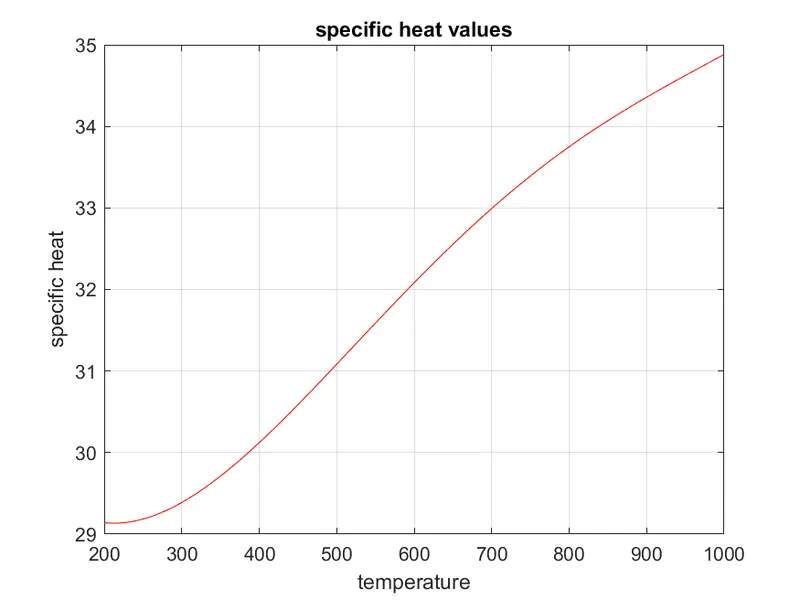
for N2
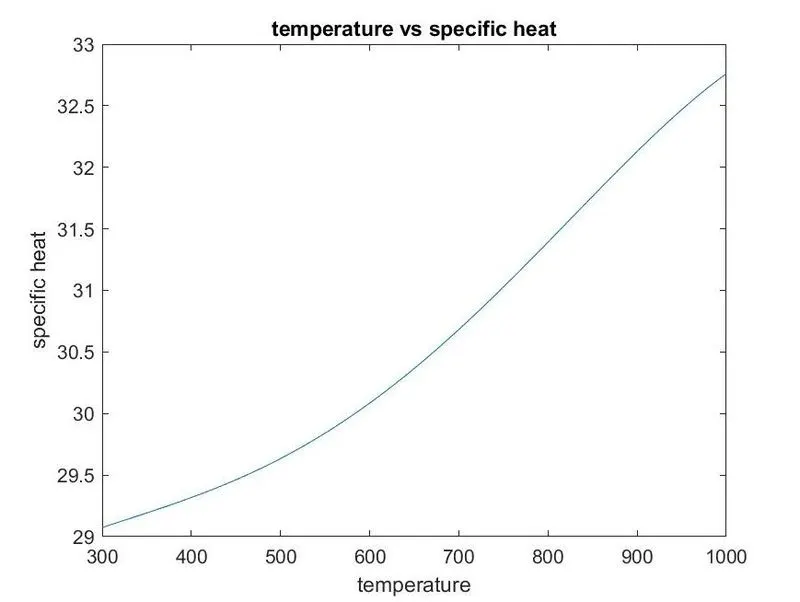
For CO2