Week-4 Challenge WOT Condition Part-2
Aim-
1.What is the difference between mapped and dynamic model of engine, motor and generator? How can you change model type?
Ans-
Mapped Engine is the default settings in powertrain blockset.It is used to measure the vehicle's performance parameters using standard lookup tables that have been pre-loaded into the system. This method of modelling is less precise. The values in the lookup tables are dependent on brake torque, requested torque, and engine speed. If any additional parameter is specified, such as Input engine temperature, lookup table values will be a function of the temperature parameter. Air mass flow, fuel flow, emission data, exhaust temperature, and efficiency are among the data collected from lookup tables. This information is used to determine what other parameters the end user requires.If you have engine data from a dynamometer or a design tool like GT-POWER.For quasi steady-state engine simulations mapped engine is used.
For modelling, dynamic engine model utilizes real-time data provided by the user at run time. The accuracy of this model is superior to that of the mapped engine model. When data from a vehicle's subsystems is required, this model is employed. We can figure out: Fuel flow, port gas mass flow, exhaust temperature, exhaust mass flow rate, and exhaust emissions are all factors to consider.Model decomposes the engine behavior into engine characteristics that are separated into lower-level components. By combining components in this way, the models capture the dynamic effects.
The Mapped Motor block implements a mapped motor and drive electronics operating in torque-control mode. The output torque tracks the torque reference demand and includes a motor-response and drive-response time constant. Use the block for fast system-level simulations when you do not know detailed motor parameters, for example, for motor power and torque tradeoff studies. The block assumes that the speed fluctuations due to mechanical load do not affect the motor torque tracking.
Dynamic or online motor testing is performed with the motor running in its normal environment and load condition. Equipment connects directly to the load side of low-voltage motors or in the low-voltage cabinet of medium- and high-voltage motors collecting voltage and current information. This data is analyzed and processed through numerous algorithms, displayed in categorized layouts and diagnosed with preset pass/fail criteria. Red, yellow, and green “flags” quickly and clearly indicate conditions of concern.
The mapped generator block is also similar like other blocks. Most of the data required is taken from the lookup tables corresponding to the given input parameters. Its simulation time is less.The dynamic generator involves user entering the parameters manually during the run time for their particular applications. The results take time and are more accurate.
For changing the model type ,in the modeling tab there will be variant manager,we can see different options wrt the model we have loaded,
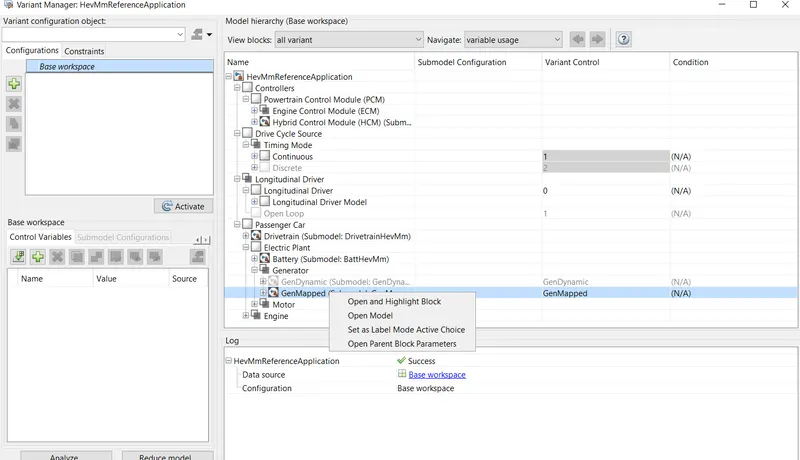
we have choose the model,then right click and set as label mode as active choice,so this can be done for the motor also.
2.How does the model calculate miles per gallon? Which factors are considered to model fuel flow?
Ans-
The MPGe unit was created in the United States to compare the efficiency of gasoline vehicles with BEVs, PHEVs, or FCEVs. MPGe is the abbreviation for Miles Per Gallon Equivalent. One gallon of petrol has the same amount of energy as 33.7 kwh of electricity, according to experts.So in the hybrid electric vehicle model the conversion is done by a block in the performance calculation.
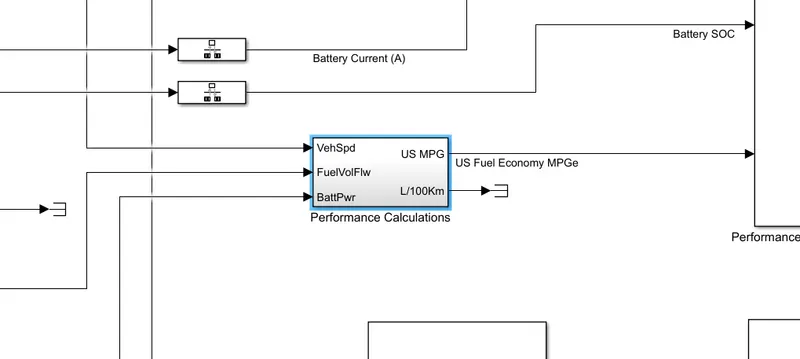
The inputs of the blocks are vehicle speed,fuel volume flow and battery power.As a result, battery power is converted to KW (W/1000) and then divided by 33.7 kwh. The battery's fuel equivalent is added to the fuel flow. The distance travelled is determined using the vehicle's speed and time. Conversions are then used to translate the distance into miles. The fuel flow is measured in m3 and the distance is measured in miles. Thus fuel efficiency is calculated.
3.Run the HEV ReferenceApplication with WOT drive cycle. Change the grade and wind velocity in the environment block. Comment on the results.
Ans-
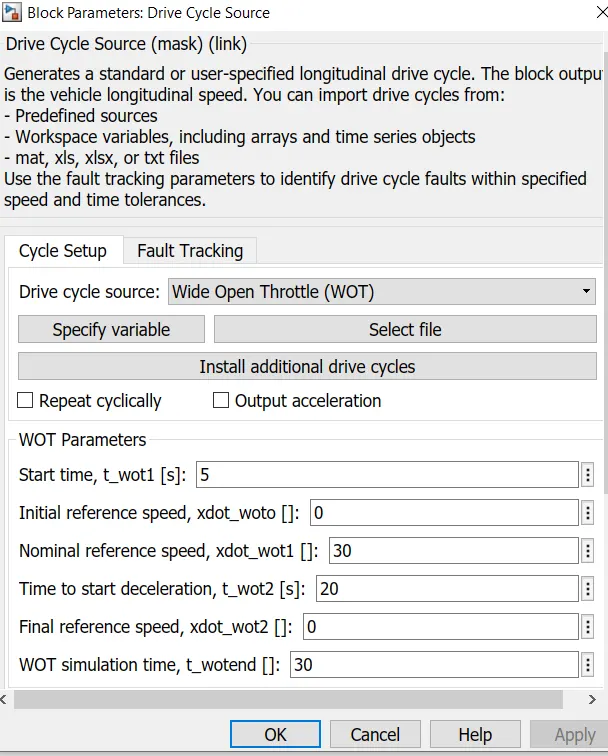
By clicking the driving cycle block we can change the cycle to WOT condition,and configurations can be changed.
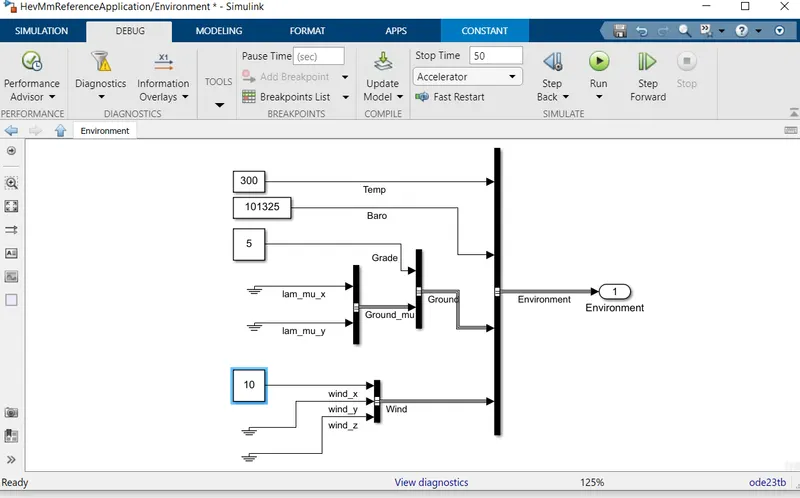
from the environmental block we have changed the values of the grade and wind and we run the simulation for the results,
from the visualization block we can see the graphical representation of the vehicle s performance,
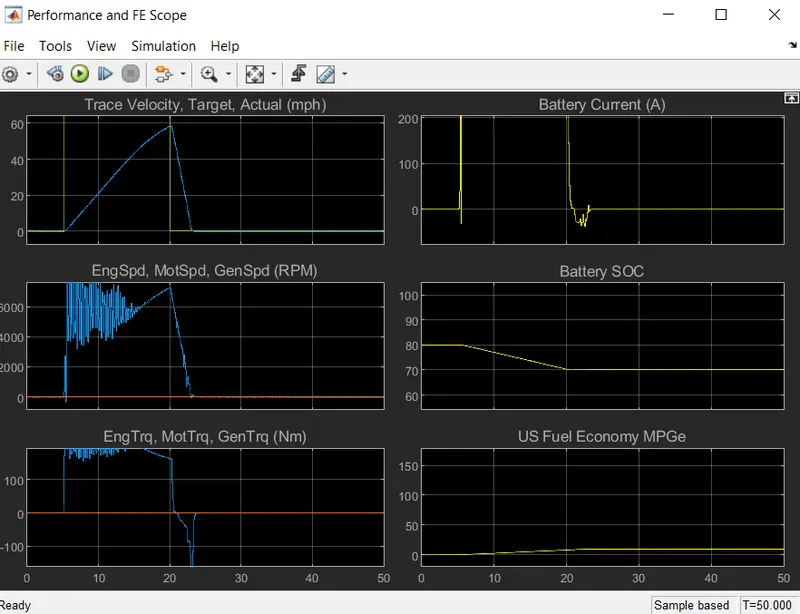
From the trace velocity target graph , we can see the deviation from the derived path and after sometime the actual path come behind the derived path,so the velocity is not attained in the real time condition.
In battery current graph,we can see the current increase with increase in the acceleration,and it becomes constant for some time and reduces to a minmum value,
In Battery SoC graph ,we can see it decreases and become constant after some time.
Engine,Motor, and Generator Speed graph Initially the engine torque increase and motor torque is going with a constant value.The engine torque is varied after some time.
4.Keeping all other parameters same, compare the simulated results of hybrid and pure electric powertrains.
Ans-From the help we can find the electrical vehicle reference model,by entering autoblkEvstart, we can load the model in matlab,
by opening the drive cycle we can change the configurations of WOT randomly,and apply it,
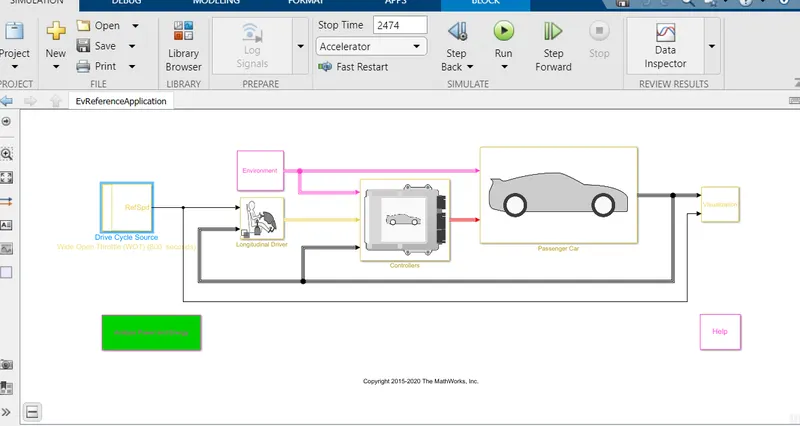
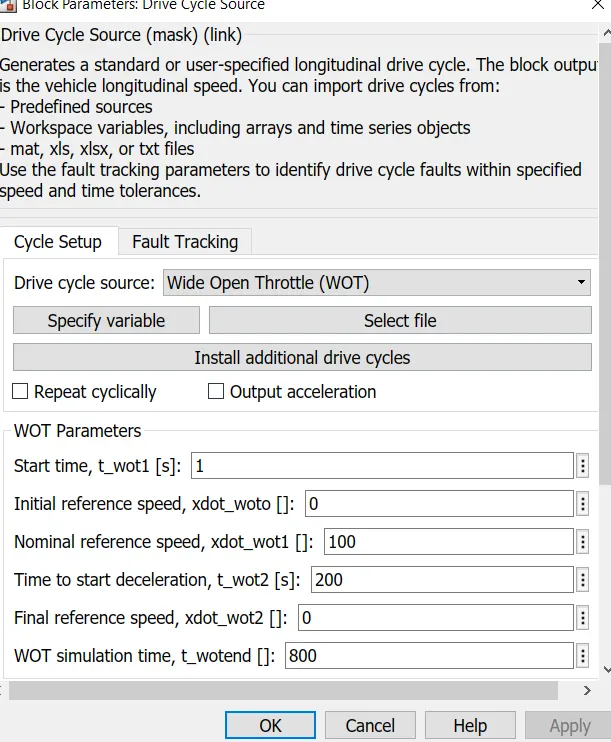
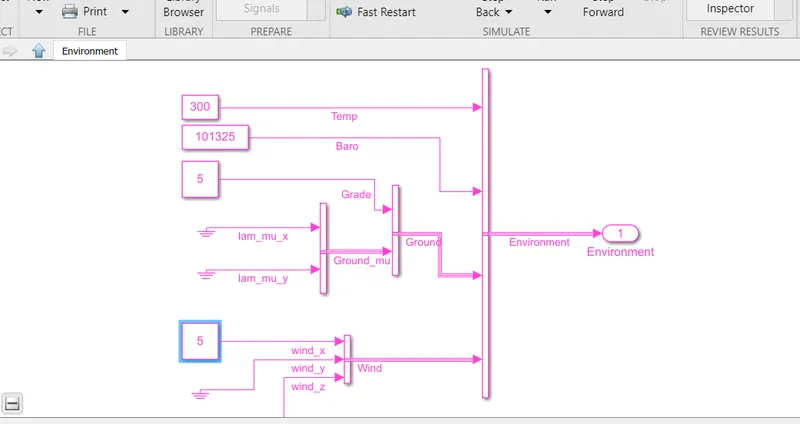
and we are changing the grade and the wind value in the environment block and run the model to see the results,
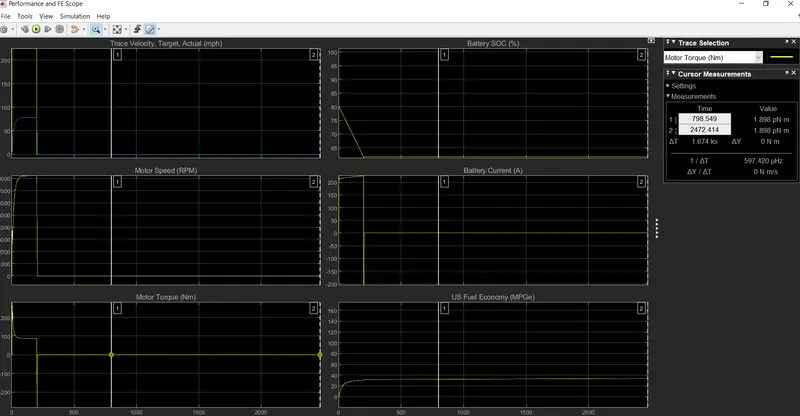
From the trace velocity target graph,we can see the actual path is deviated from the derived path,the difference is very large in this case
In battery current graph,first it increases constantly and suddenly a decrease can be seen and becomes zero.
In Battery SoC graph it gradually decreases from 60 and becomes steady in the value of 55,it
Engine,Motor, and Generator Speed graph it increases at first and at the deceleration point it have decreased to a certain value.
Engine,Motor, and Generator torque graph,at early part of the simulation there is a steep rise in the torque ,and its steep decreases and comes down very fastly,and goes constant after a value.