Week - 4
Aim
1.To implement control logic of a “washing machine” using Stateflow in simulink
2.To make a Simulink model for the “Gear shift” logic using chart
Objective-
To create a stateflow chart for working of a washing machine as per the given data
- If the power supply is available, the system gets activated
- If the Water supply is not available, stop the process & indicate through LED
- Soaking time should be 200s followed by Washing time of 100s.
- Then rinsing happens for next 20s & dryer runs for 50s
explanation-
For creating the control logic of a washing machine we are using stateflow.Stateflow provides a graphical language that includes state transition diagrams, flow charts, state transition tables, and truth tables. You can use Stateflow to describe how MATLAB algorithms and Simulink models react to input signals, events, and time-based conditions. Stateflow enables you to design and develop supervisory control, task scheduling, fault management, communication protocols, user interfaces, and hybrid systems. With Stateflow, you model combinatorial and sequential decision logic that can be simulated as a block within a Simulink model or executed as an object in MATLAB. Graphical animation enables you to analyze and debug your logic while it is executing. Edit-time and run-time checks ensure design consistency and completeness before implementation.
A washing machine is used to wash clothes, and many processes take place within the machine. We are all aware that by using a washing machine, the cloth washing process has become automatic. When we start a washing machine, we must place our clothes in it, and the machine will automatically fill with water, soaking the clothes until the washing process begins.The motor begins to work and the clothes are washed. Following the washing process, the clothes are rinsed and dried by the dryer.
For the model we have used constant block produces a constant value signal that can be real or complex. This block is used to provide a constant signal input.
A Stateflow chart is a graphical representation of a finite state machine made up of states, transitions, and details. A Stateflow chart can be used to describe how a MATLAB algorithm or Simulink model responds to external input signals, events, and time-based conditions.
A lamp block is used to show the value of the input signal, the Lamp block shows a colour. The Lamp block can be combined with other Dashboard blocks to create an integrated dashboard of controls and indicators for your model. During simulation, you can define pairs of input values and colours to provide the information you need.
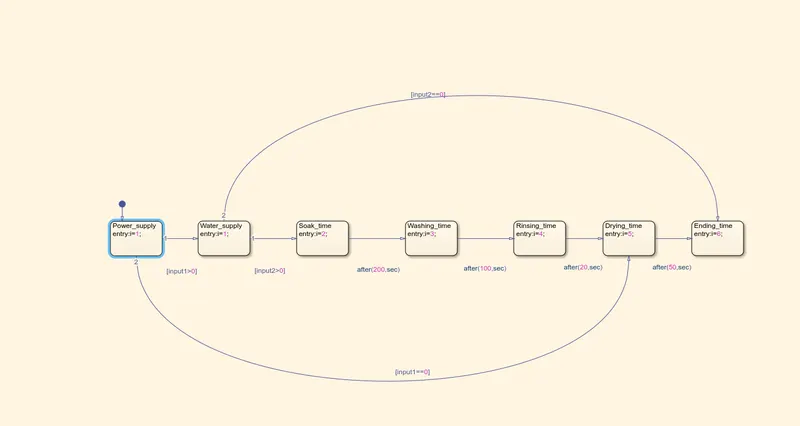
For performing the operation we have to create a state flow chart to execute the given situation wrt time.
if power supply is available,the device is in ON condition,so we have to give value of 1 to constant block and 0 for OFF condition.Similarly same values are given for the water supply.water supply is defined as a constant block.
For each operation specific time intervals are given so time delay is given for each condition.For representing the conditions we are assigning different colors to the lamp respectively.At the output,a display block is connected to represent the time phase.
Model-
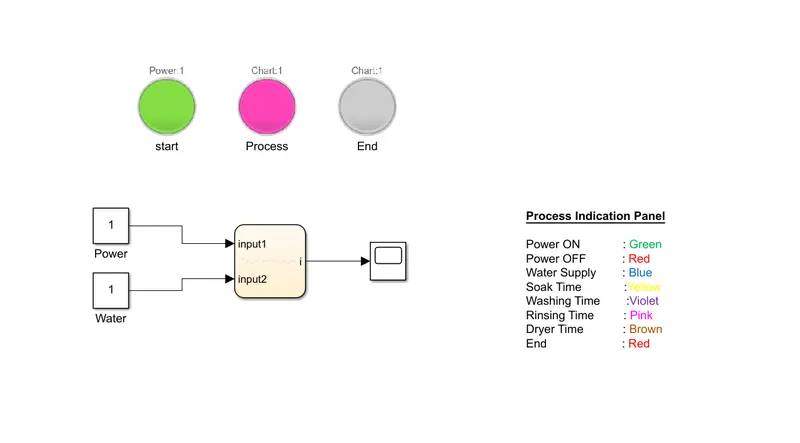
state flow chart-
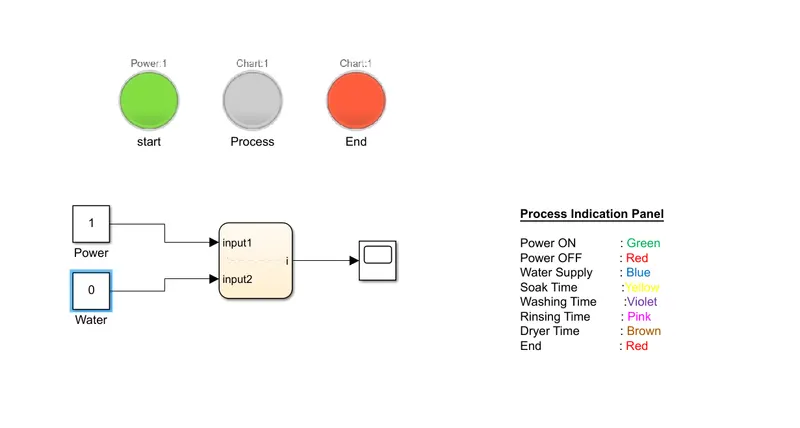
-We can see that when the input power is 1, the start lamp colour is green, and when the input power is 0, the start lamp colour is red.So, when the power is turned on, the device is triggered, and the green colour is shown.Then it will Checking if the water supply is not available the process will be terminated. If the water supply is zero, the system will be switched off and the stoplamp will turn red.
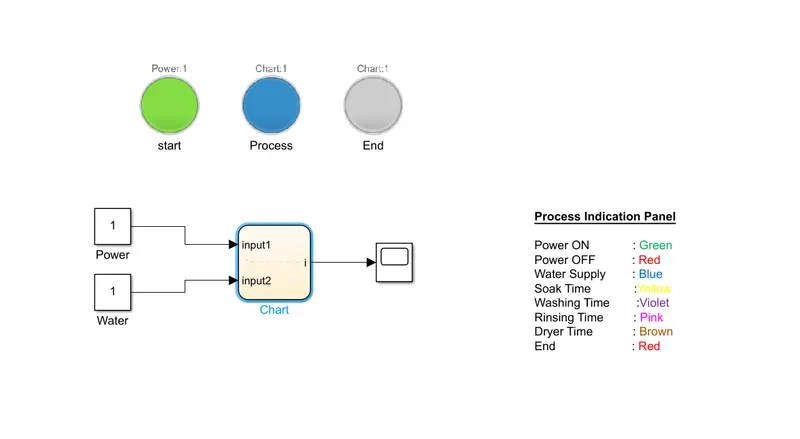
-if the water supply block is defined as 1 the the machine will work and go on to the next process.that is washing timeIn washing time the process lamp will indicate blue color.if the output given by the water supply is 0,the machine will not work the power lamp will show red color which indicates the terminating condition.
-The following operation is soaking following the washing operation,the soaking time is for 200 seconds,in this condition the lamp will indicate yellow color.in the static flow chart for time delaying we have given the time interval.the stop time is 200 seconds and after the filling of water the soaking process will be done.
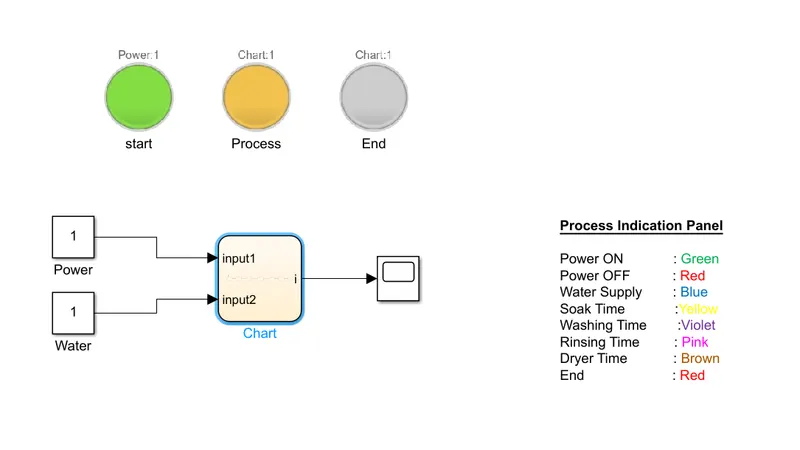
-After the soaking process the washing process is followed,the time interval for washing time is 100 seconds using the condition variable in the static flow chart we have assigned the time delay given to us. so in this process the lamp will indicate violet color.
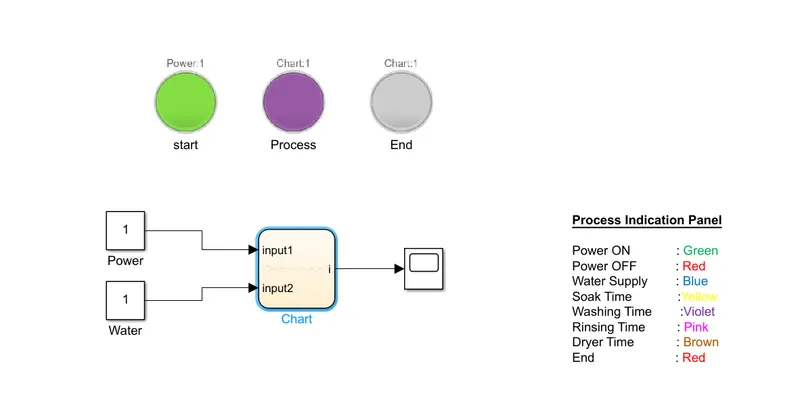
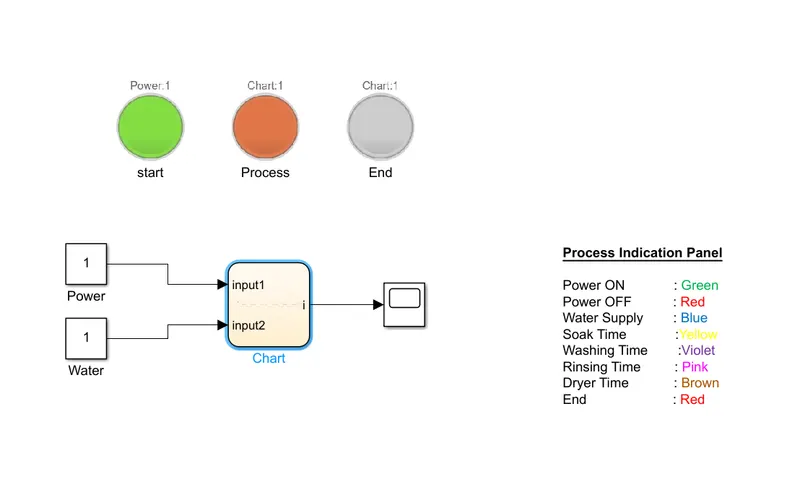
-The next operation is rinsing.the time interval for this process is 20s,we have assigned pink color for the operation,the lamp will indicate with pink color in the time of this rinsing process.and followed by this the dryer time is for 50 seconds we have assigned in the static flow chart and in the end the lamp will be showing red color which represents the off condition.
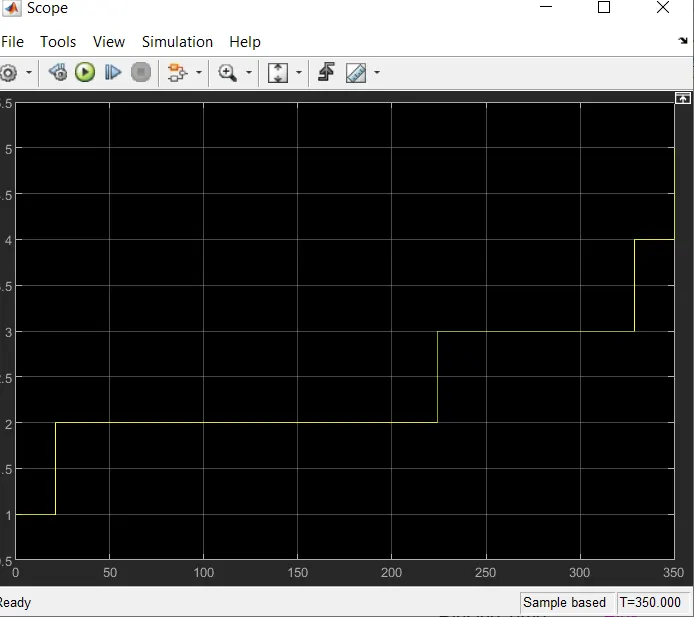
from the graph we can see the change in the process wrt time.
conclusion- We have created a model which represents the control logic of a washing machine.
2.
For creating a model which represents the gearshift logic , the gear should be changed with respect to the speed,in the given data we have speed values and their respective gears.
we have to use specific blocks in simulink to implement the operation of the gear shifter,the blocks used are constant block,chart block,slider and lamp block.The Constant block produces a constant value signal that can be real or complex. This block is used to provide a constant signal input.A Stateflow chart is a graphical representation of a finite state machine made up of states, transitions, and details. A Stateflow chart can be used to describe how a MATLAB algorithm or Simulink model responds to external input signals, events, and time-based conditions.To show the value of the input signal, the Lamp block shows a colour. The Lamp block can be combined with other Dashboard blocks to create an integrated dashboard of controls and indicators for your model. During simulation, you can define pairs of input values and colours to provide the information you need.
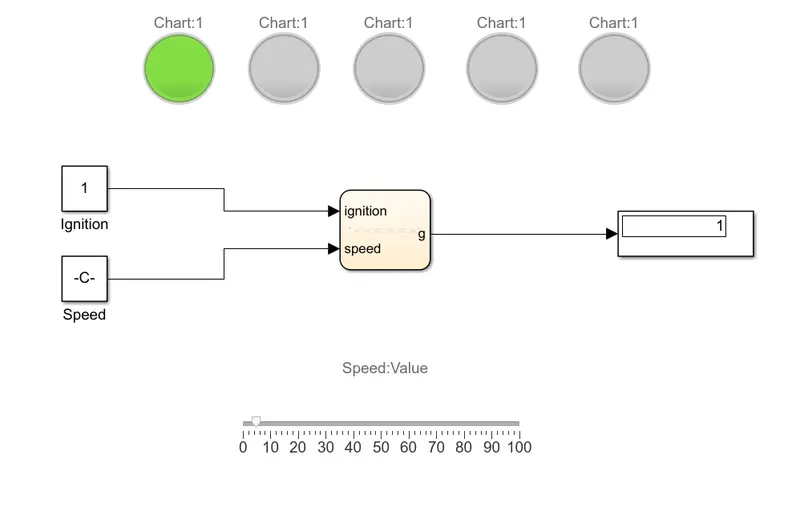
A chart block is generated to perform the gear shifting using the logic of'> and < ', and the number as per the speed is shown on the speedometer.For each point, a logic is generated based on the given speed range. A constant block is given to turn on the engine, as well as a display block to display the current gear number.To allocate speed values, a slider block is used as a speedometer and is connected to a constant block.We can check the gear shift number on the display block by adjusting the speed, and lamp blocks are connected at each stage of the gear shift to show the gear position in relation to speed.
-Model
-State flow chart
In the system we have 2 input block which are speed and ignition,so for ON condition we are giving the value of 1 for ignition and for speed,in order to different speed slider mehanism is used. as the input for speed.
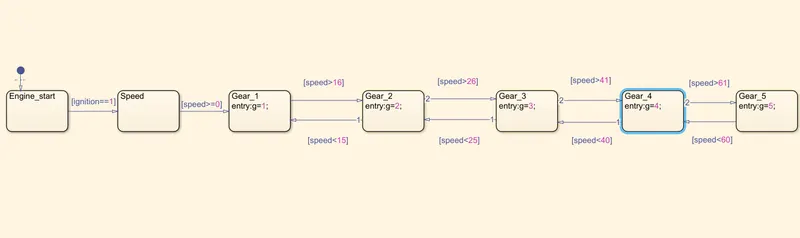
In the state flow chart we are connecting different states with specified condition.for each gear we are assigning values of speed in which 'g' is the output of the stateflow chart and ignition and speed are the inputs of the chart.As per the condition we are assigning the values for each gear.
If the ignition is turned on, it will check the speed, i.e. if the speed is between 0 and 15, it will show gear 1.
If it is greater than 15, another condition is verified, like wise the speed is calculated using this flow chart.
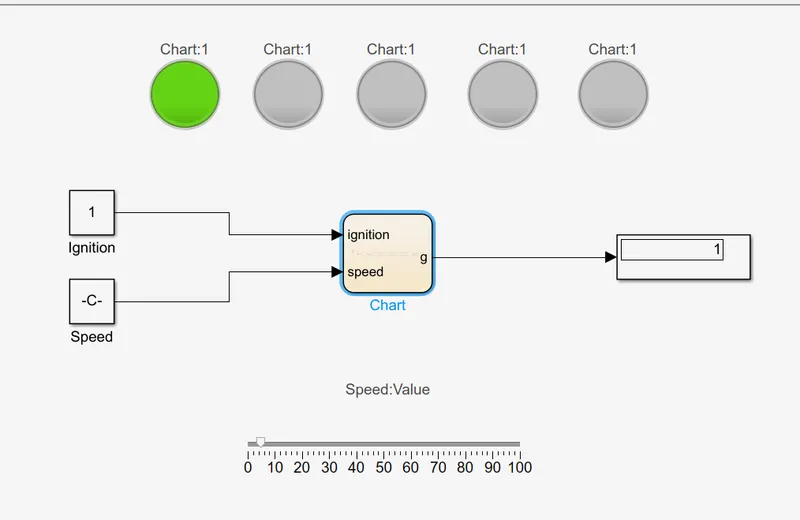
In this case, we can clearly see that the display output is 1 from 0 to 15 speeds, indicating that it is in first gear, and the lamp connected to the displays the output as gear 1 is showing green color.
for second gear-
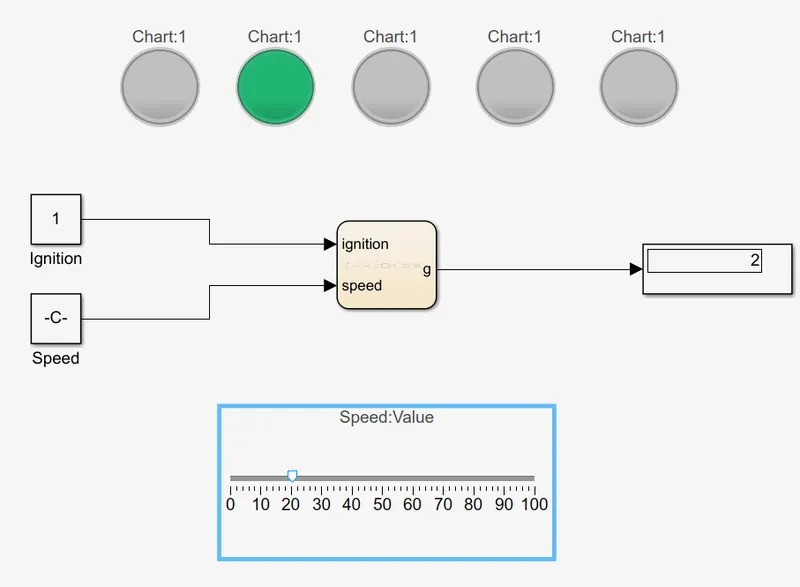
The lamp color represents that it is in second gear. We can see that the speed is between 16 and 25 mph, and that the vehicle is in gear 2.
for third gear -
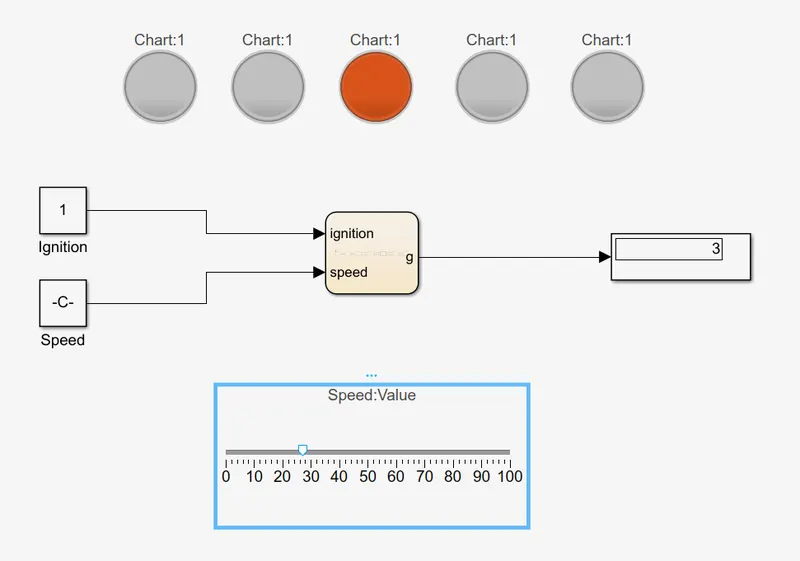
The gear 3 indicator on this indicates that the vehicle is in third gear. And the speed ranges from 26 to 40 km per hour. The display indicates that it is in third gear.
for gear 4-
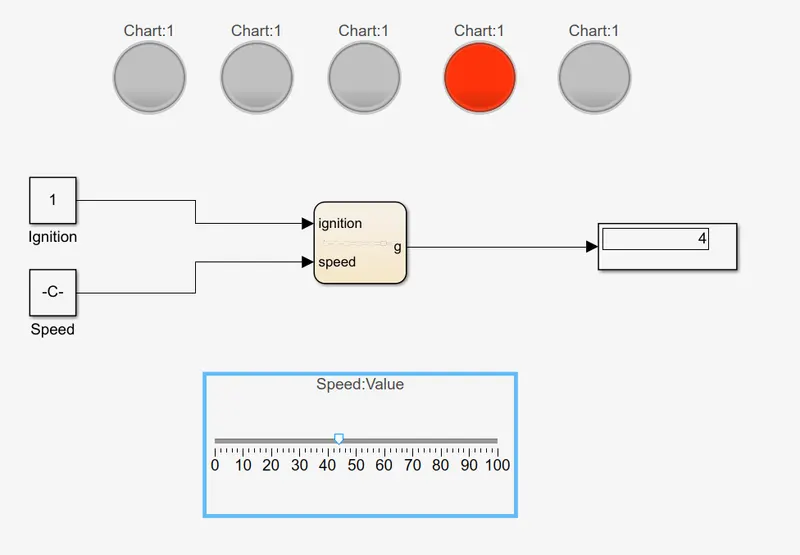
In this case, the gear 4 indicator lamp is ON, and the display itself indicates that it is in fourth gear, with a speed ranging from 41 to 60 kmph.
for fifth gear-
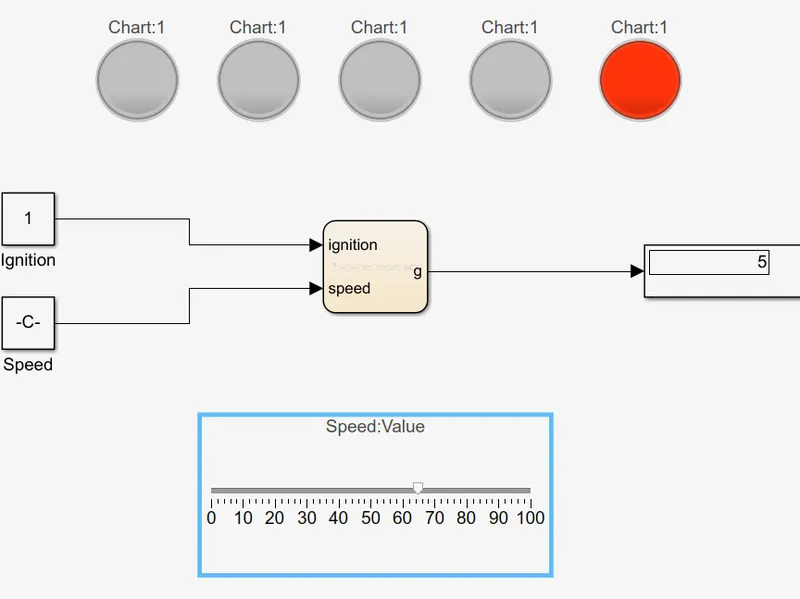
In this condition, the speed range is greater than 61 at this time, the vehicle is in fifth gear, as shown by the display and the indicator lamps.
Conclusion
Using the stateflow, gear shift logic with given parameters is implemented using simulink .