Project 1 - Parsing NASA thermodynamic data
clear all
close all
clc

%R=molar gas constant
R=8.314;
%for opening the file THERMO.dat
f1=fopen('THERMO.dat','r');
%for reading the lines
l1=fgetl(f1);
l2=fgetl(f1);
value=strsplit(l2,' ');

%for getting global Teratures from file in number form
global_lowT=str2num(value{2})
global_midT=str2num(value{3})
global_highT=str2num(value{4})
%for skipping the  3 lines
l3=fgetl(f1);
l4=fgetl(f1);
l5=fgetl(f1);
%for reading species and calculating cp,h,s and plotting the graph
for i=1:53
    tline=fgetl(f1);
    A=strsplit(tline,' ');
    name_of_species=(A{1});
    species_name=char(name_of_species);
    lowT=str2num(A{end-3});
    highT=str2num(A{end-2});
    midT=str2num(A{end-1});
    %for finding coefficents
    tline1=fgetl(f1);
    a=strfind(tline1,'E');

    a1=tline1(1:a(1)+3);
    a1=str2double(a1);
    a2=tline1(a(1)+4:a(2)+3);
    a2=str2double(a2);
    a3=tline1(a(2)+4:a(3)+3)
    a3=str2double(a3);
    a4=tline1(a(3)+4:a(4)+3)
    a4=str2double(a4);
    a5=tline1(a(4)+4:a(5)+3)
    a5=str2double(a5);

    tline2=fgetl(f1);
    a=strfind(tline2,'E');

    a6=tline2(1:a(1)+3);
    a6=str2double(a6);
    a7=tline2(a(1)+4:a(2)+3);
    a7=str2double(a7);
    a8 =tline2((a(2)+4):(a(3)+3));
    a8=str2double(a8);
    a9=tline2(a(3)+4:a(4)+3);
    a9=str2double(a9);
    a10=tline2(a(4)+4:a(5)+3);
    a10=str2double(a10);

    tline3=fgetl(f1);
    a=strfind(tline3,'E');
    a11=tline3(1:a(1)+3);
    a11=str2double(a11);
    a12=tline3(a(1)+4:a(2)+3);
    a12=str2double(a12);
    a13=tline3(a(2)+4:a(3)+3);
    a13=str2double(a13);
    a14=tline3(a(3)+4:a(4)+3);
    a14=str2double(a14);
    %Terature range
    T=linspace(lowT,highT,1000);
    %R = 8.314;
    %for calculating specific heat(cp),Enthalpy(H),Entropy(S)
     Cp=Specific_heat(a1,a2,a3,a4,a5,a8,a9,a10,a11,a12,T,R,midT);
     H=Enthalpy(a1,a2,a3,a4,a5,a6,a8,a9,a10,a11,a12,a13,T,R,midT)
     S =Entropy(a1,a2,a3,a4,a5,a7,a8,a9,a10,a11,a12,a14,T,R,midT);


     %for calculating molecular weight and printing it.
     Molecular_weight=wt(name_of_species);
     fprintf('molecular weight of %s=%fn',name_of_species,Molecular_weight);
     %plotting cp,h,t
     q=sprintf('%s',species_name);
     mkdir(q)
     cd(q)


     %plotting T vs Cp
     figure(1)
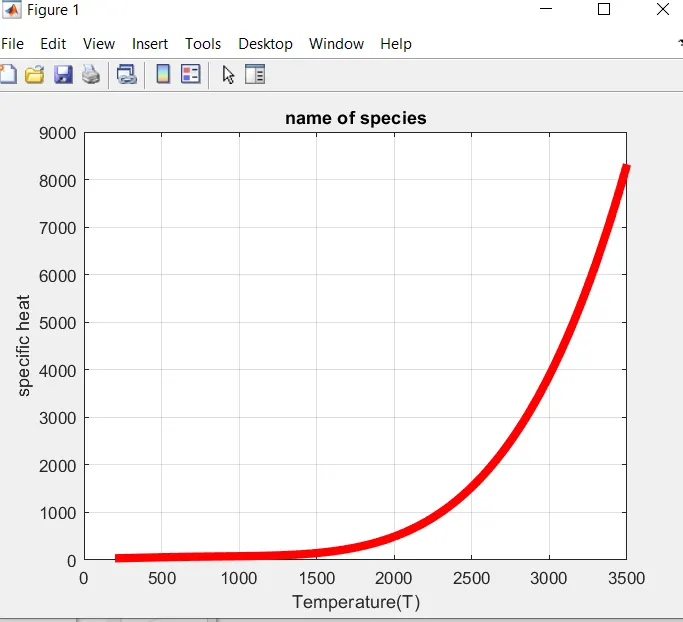
     plot(T,Cp,'linewidth',5,'color','r')
     xlabel('Temperature(T)')
     ylabel('specific heat')
     grid on
     title('name of species')
     saveas(figure(1),'specific heat.jpg');

     %plotting T vs H
     figure(2)
     plot(T,H,'linewidth',5,'color','b')
     xlabel('Temperature(T)')
     ylabel('enthalpy')
     grid on
     title('name of species');
     saveas(figure(2),'enthalpy.jpg');

     %plotting T vs S
     figure(3)
     plot(T,S,'linewidth',5,'color','m')
     xlabel('Temperature(T)')
     ylabel('entropy(s)')
     grid on
     title('name of species');
     saveas(figure(3),'entropy.jpg')
     cd ..
end


%enthalpy function


function H=Enthalpy(a1,a2,a3,a4,a5,a6,a8,a9,a10,a11,a12,a13,T,R,global_midtemp)
%for calculating enthalpy for higher and lower temperature respectively
if(T>=global_midtemp)
    H=R*((a1*T)+((a2*(T).^2)/2)+((a3*(T).^3)/3)+((a4*(T).^4)/4)+((a5*(T).^5)/5)+a6);

else
     H=R*((a8*T)+((a9*(T).^2)/2)+((a10*(T).^3)/3)+((a11*(T).^4)/4)+((a12*(T).^5)/5)+a13);
end
end


%specific heat function
function [Cp]= Specific_heat(a1,a2,a3,a4,a5,a8,a9,a10,a11,a12,T,R,midT)
%for calculating specific_heat for higher and lower Terature respectively
if(T>=midT)
   Cp = R*(a1 + a2*(T) + a3*((T).^2) + a4*((T).^3) + a5*((T).^4));
    %Cp=R*(a1+a2*T+a3*T^2+a4*T^3+a5*T^4);
else
    Cp = R*(a8 + a9*(T) + a10*((T).^2) + a11*((T).^3) + a12*((T).^4));
    %Cp=R*(a8+a9*T+a10*T^2+a11*T^3+a12*T^4);
end
end


%entropy function
function S =Entropy(a1,a2,a3,a4,a5,a7,a8,a9,a10,a11,a12,a14,T,R,midT)
%for calculating entropy for higher and lower Terature respectively
if(T>=midT)
    S = R*(a1*log(T) + a2*(T) + ((a3*(T).^2)/2) + ((a4*(T).^3)/3) + ((a5*(T).^4)/4) + a7);
else
    S = R*(a8*log(T) + a9*(T) + ((a10*(T).^2)/2) + ((a11*(T).^3)/3) + ((a12*(T).^4)/4) + a14);
end
end


%for calculating molecular weight
function Molecular_weight=wt(species_name)

Elements=['H' 'C' 'O' 'N' 'A' 'S'];
Atomic_weight =[1 12 16 14 40 32];
species=upper(species_name)
Molecular_weight=0;

for i=1:length(species)
  for    j=1:length(Elements)

    if strcmp(species(i),Elements(j))
AIM-
create a program for parsing a thermodynamic data file by nasa and calculate enthalpy entropy and specific heat for the given species and plotting with temperature.
OBJECTIVE-
- Write diferent function for enthalpy,entropy and specific heat and extracting the coefficients for calculating it.
- plotting enthalpy ,entropy, and specific heat against local temperature range for given species.
- calculating the molecular weight of each species,
- saving the plots as images in a folder for each species
INTRODUCTION-
Parsing is the process of converting one data format into a more understandable data format. However, it is a really straightforward reason.Reading in a data stream of some form and developing an in memory model of the semantic meaning of that data is what parsing a file includes. This seeks to make performing some sort of data transformation easier.The term "parsing" refers to the process of making something understandable. In programming, this refers to the process of converting data from one form to another that is easier to work with. This is accomplished by partially analysing the data, comprehending its underlying structure (by making some assumptions based on what you expect to find), and then representing that structure directly in the code.
We have to use the given equations for finding out ethalpy entropy and specific heat

where H=entropy
Cp=specific heat
R= Universal gas constant
T=Temperature
S=entropy
a=coefficients
Explanation of the code-
In the program we have to define the value of R ,that is universal Gas constant,and for opening the file fopen command is used to open our file.for reading the lines the fgetl command is used ,hence the header files are read and in the third line indicates the global temperature range for which the thermodynamic properties are valid,for converting it to numbersStr2double command is used and we are assigning these values as global temperature,for defining the temperature range linspace command is used.fscanf can also used to read the file,for reading the next 3 lines and skip those lines.then for loop is used to get the coefficeints and their temperature.with the 14 coefficients we are calculating the entropy enthalpy and specific heat.the molecular weight function.By using the equation above ,we are finding out the values,for creating a folder mkdir command is used for saving the result in a folder.then,for plotting each variables with temperature plot command is used.temperature vs specific heat,temperature vs entropy,temperature vs enthalpy is plotted.And molecular weight of each species is calculated.we will get these plots as figure and uses saveas command to save the plots.
RESULTS-
plots for oxygen(O2)
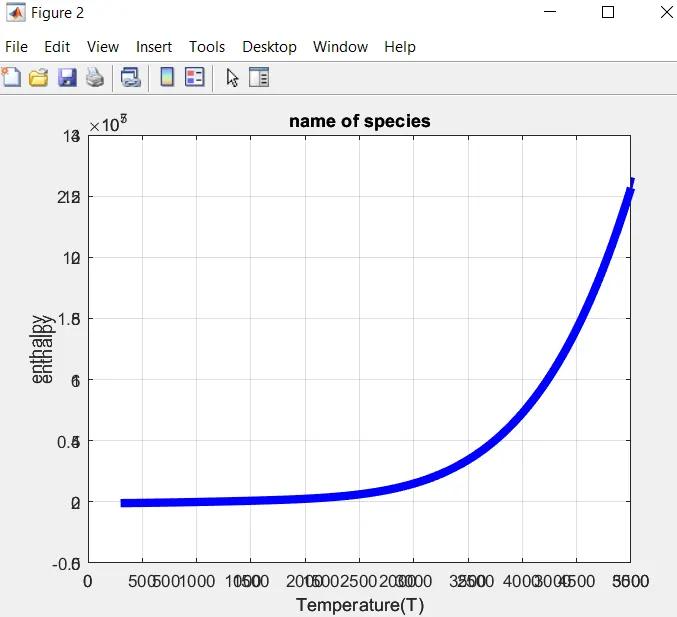
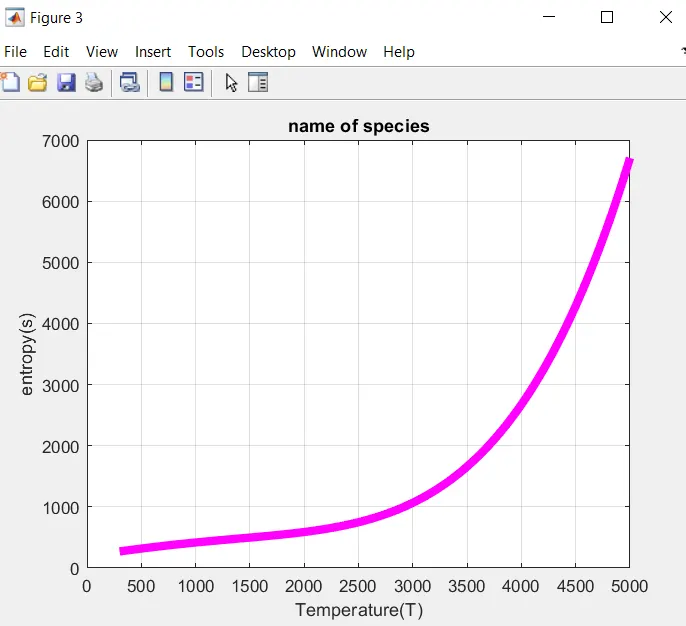
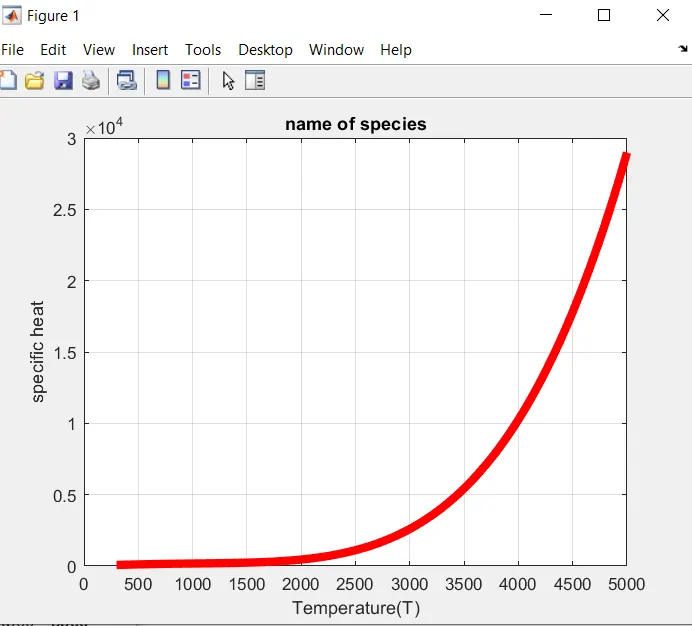
Plots for nitrogen(N2)
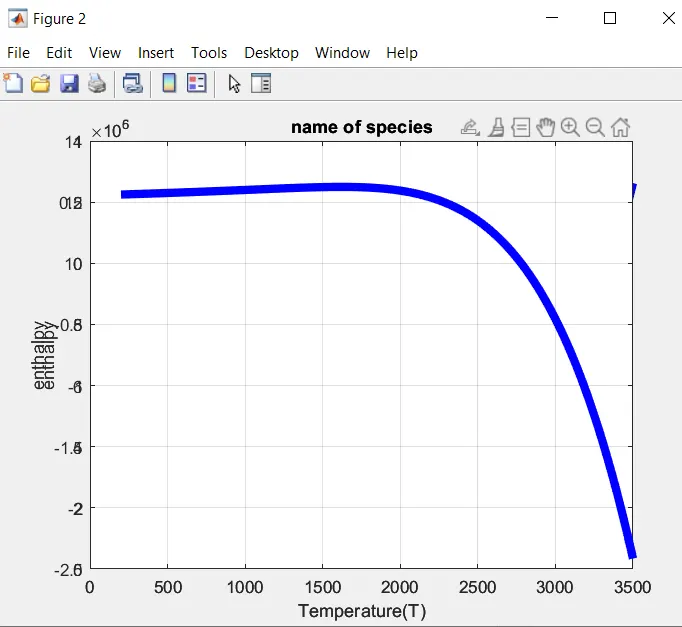
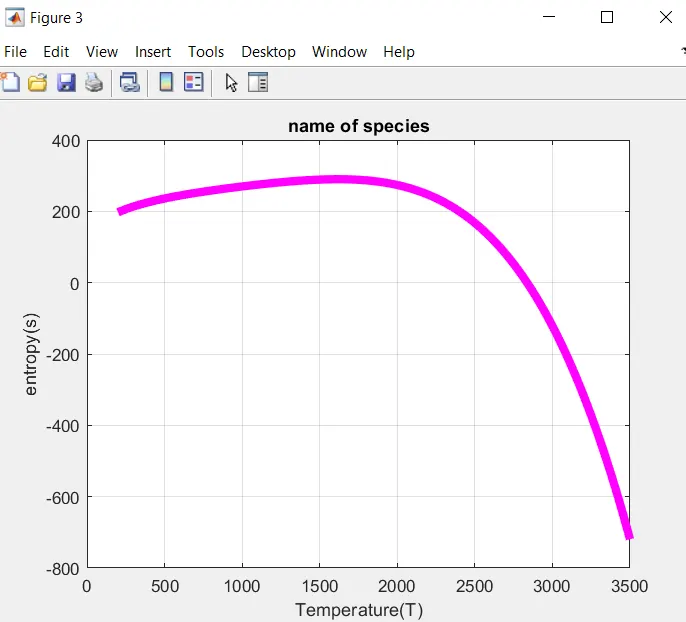
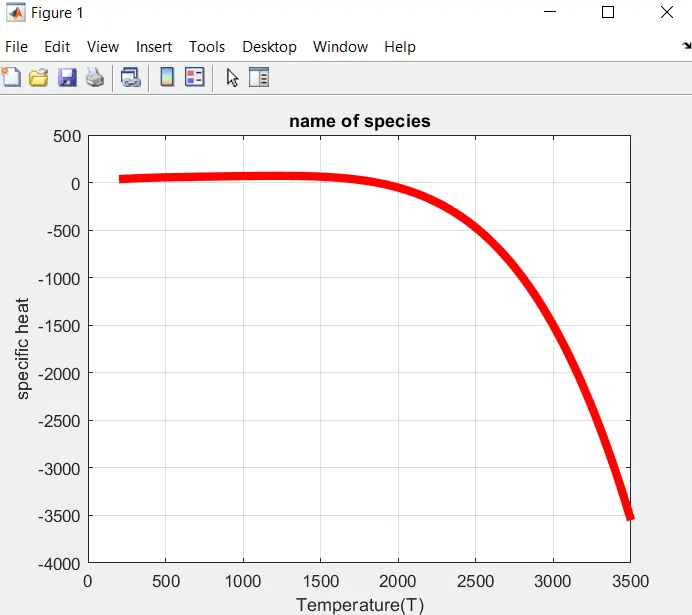
Plots for carbon dioxide(CO2)
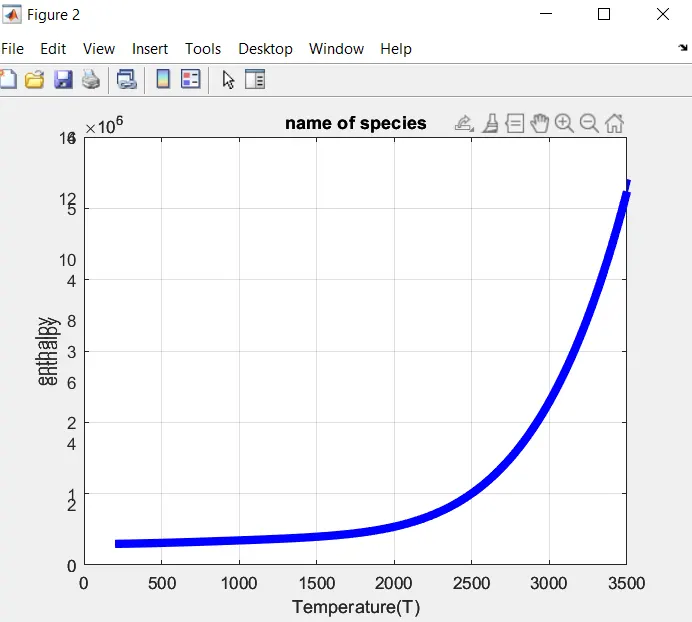
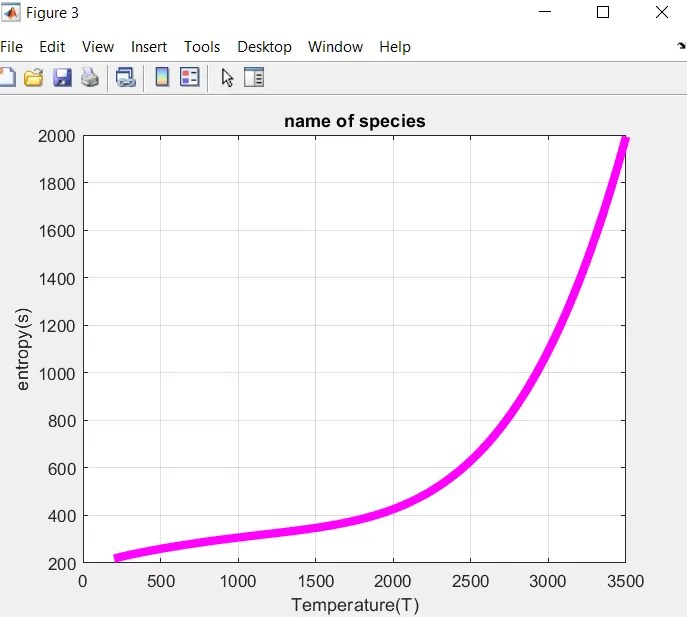
Screenshot of the folder-

CONCLUSION-
The parsing of the thermodynamic data from nasa file is done by matlab software ,and were able to calculate the thermodynamic properties from the given data,and graphs were plotted with respect to the local temperature for each of the species.
REFERENCE-