Week-4 Challenge WOT Condition Part-2
AIM:
1) What is the difference between mapped and dynamic model of engine, motor and generator? How can you change model type?
2) How does the model calculate miles per gallon? Which factors are considered to model fuel flow?
3) Run the HEV ReferenceApplication with WOT drive cycle. Change the grade and wind velocity in the environment block. Comment on the results.
4) Keeping all other parameters same, compare the simulated results of hybrid and pure electric powertrains.
Theory: -
Powertrain blockset t provides fully assembled reference application models of powertrains which include diesel, gasoline, hybrid and electric systems.
It includes a component library which simulates engine subsystems, transmission assemblies, traction motors, and battery pack and controller models.
A dynamometer is also included in the power train blockset which is used for virtual testing.
MDF file support provides a standard - based interface for calibrating the tools which helps in importing the data.
Powertrain blockset is used for design trade off analysis and component sizing and hardware in the loop testing.
We can customize the models by changing the components in a reference application with your own data.
Powertrain blockset provides a standard model architecture which can be reused throughout the development process.
Solutions: -
1) What is the difference between mapped and dynamic model of engine, motor and generator? How can you change model type?
Mapped Engine:
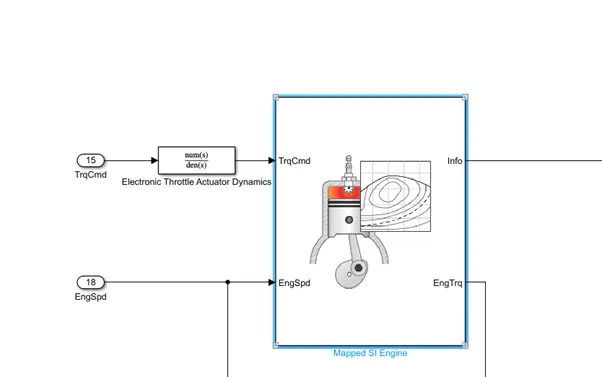
- Mapped engine is a default arrangement in a powertrain blockset.
- It is used to measure performance parameter of the vehicle by using steady-state look-up table.
- The table provides overall engine characteristics including actual torque, fuel flow rate, BSFC and engine out exhaust emission.
- This type of model is less accurate as it doesn’t contain in-depth information and simulation time is also less than the dynamic type.
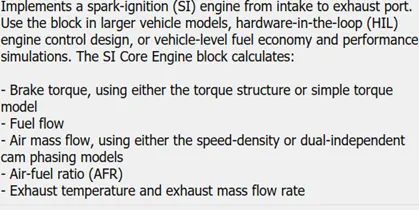
Dynamic Engine: -
- Real time data is given to dynamic engine by the user at the time of simulation.
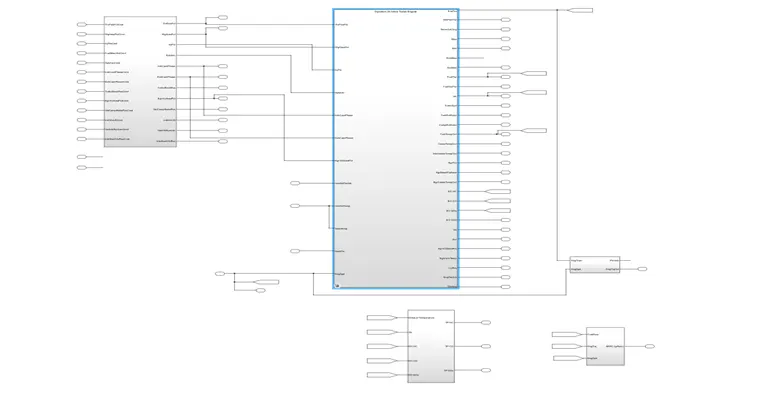
- It measures the performance parameter of the vehicle by using component level data to analyze the impact of individual component on overall performance.
- This type of model is more accurate compared to mapped models and it takes simulation time more to compared to the simulation time of mapped engine.
- This model calculates Brake torque using either the torque structure or simple torque model fuel flow. Air mass flow, Air-fuel ratio and exhaust temperature and exhaust mass flow rate.
Mapped Motor: -
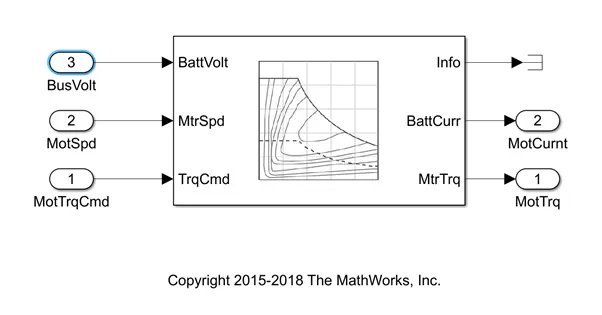
- Mapped motor will operate in torque control mode. Output torque traces the torque reference demand and changes are made accordingly.
- This type of motor is used for faster simulation without knowing the motor parameters like motor power and torque.
- In this model we can specify the input torque, speed, maximum motor power and some electrical losses.
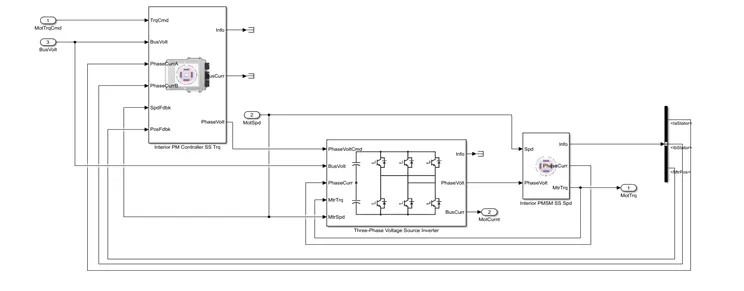
- Dynamic motor uses three phase interior permanent magnet synchronous motor (PMSM).
- The block uses the three phase voltage source invertor that generates line to neutral voltage commands for a balanced of three phase load. And this type of motor is more accurate.
- The torque control implements strategies for maximizing the torque per amp (MTPA) and weakening the magnetic flux.
Mapped Generator :
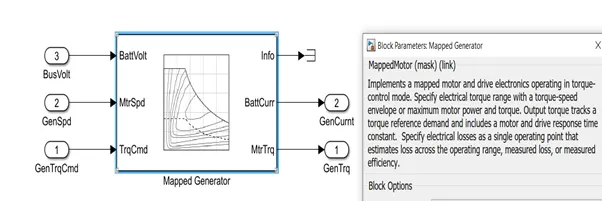
- Mapped generator block is similar to the mapped motor block.
- The data is given in the form of look-up tables and it is not so accurate model and it take less simulation time.
Dynamic Generator:
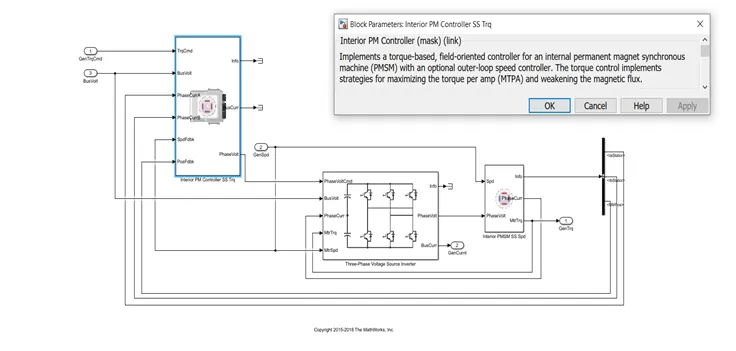
- Dynamic generator is similar to the dynamic motor.
- This block also uses three phase interior permanent synchronous generator (PMSG).
- It is a kind of real time simulation and the result will be accurate as compared to the mapped model.
So now second question is that how to change the model?
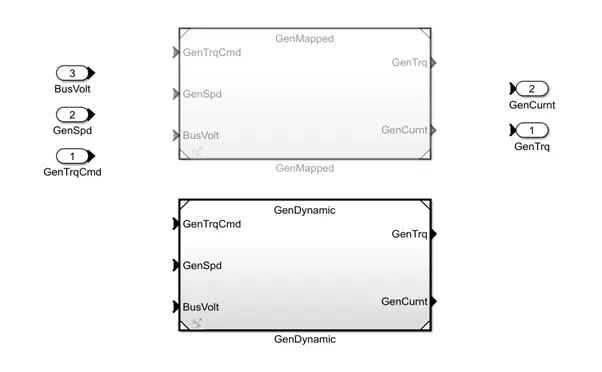
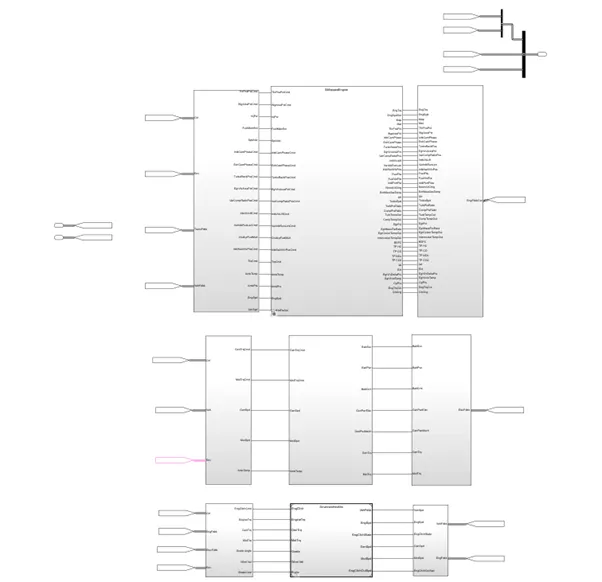
As shown in figure above I already change the model of dynamic generator and dynamic motor.
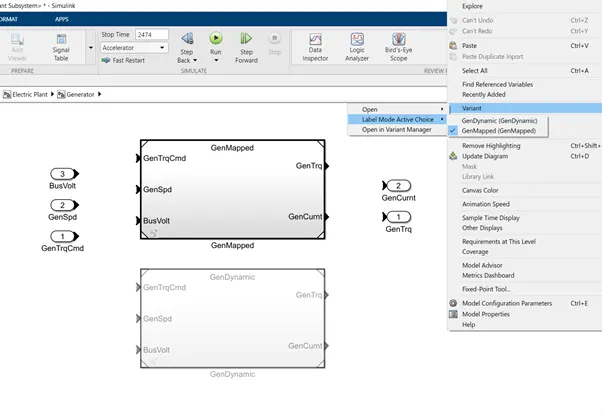
First step is right click on blank space and select the variant option and one pop up will open then select the label mode active choice from there you can change the model . As shown as below :
2) How does the model calculate miles per gallon? Which factors are considered to model fuel flow?
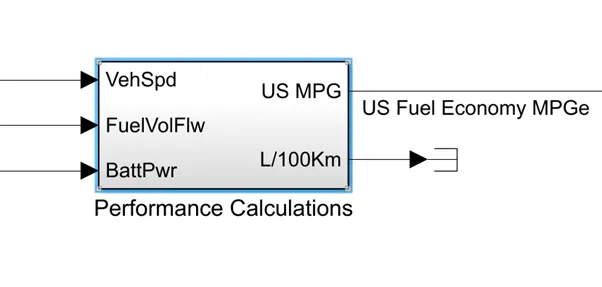
Miles per gallon(mpg) are commonly used in the United States, the United Kingdom, and Canada (alongside L/100 km). Kilometers per liter (km/L) are more commonly used elsewhere in the Americas, Asia, parts of Africa, and Oceania. When the mpg unit is used, it is necessary to identify the type of gallon used: the imperial gallon is 4.54609 liters, and the U.S. gallon is 3.785 liters.
Model:-
Battery:-
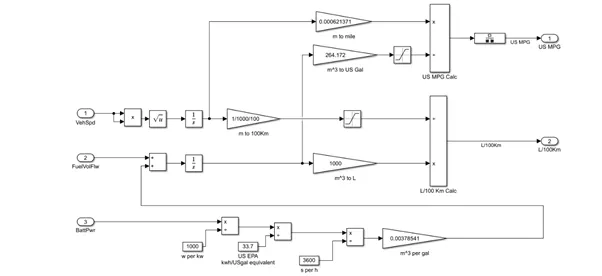
As we discussed earlier 1 gallon of gas equals to 33.7kWh of electricity so the battery power is converted W to kW by dividing by 1000 (W/1000) and then the value is divided by 33.7kWh/us-gallon and then hour is converted to sec by dividing by 3600 and the value will be in the US -gallon. The vehicle speed is integrated to get the distance and it will be in meters and converted to miles by multiplying by the term 0.000621 (1 meter = 0.000621 mile) and divided by 264.172 to convert from m^3 to US-gallon.
Vehicle Speed:-
In the vehicle speed we can see that the conversion, when we multiply speed with integration will get distance in miles. And converting it into km by dividing 1000.Then that is fed to two blocks i,e L/100 block and US MPG block, In the US the MPG is calculated in miles.
Factors considering to model fuel flow:-
Fuel Economy: - Fuel economy is a measure of how far a vehicle will travel with a gallon of fuel; it is expressed in miles per gallon. This is a popular measure used for a long time by consumers in the United States; it is used also by vehicle manufacturers and regulators, mostly to communicate with the public. As a metric, fuel economy actually measures distance travelled per unit of fuel.
Fuel Consumption: - Fuel consumption is the inverse of fuel economy. It is the amount of fuel consumed in driving a given distance. It is measured in the United States in gallons per 100 miles, and in liters per 100 kilometers in Europe and elsewhere throughout the world. Fuel consumption is a fundamental engineering measure that is directly related to fuel consumed per 100 miles and is useful because it can be employed as a direct measure of volumetric fuel savings. It is actually fuel consumption.
3) Run the HEV Reference Application with WOT drive cycle. Change the grade and wind velocity in the environment block. Comment on the results.
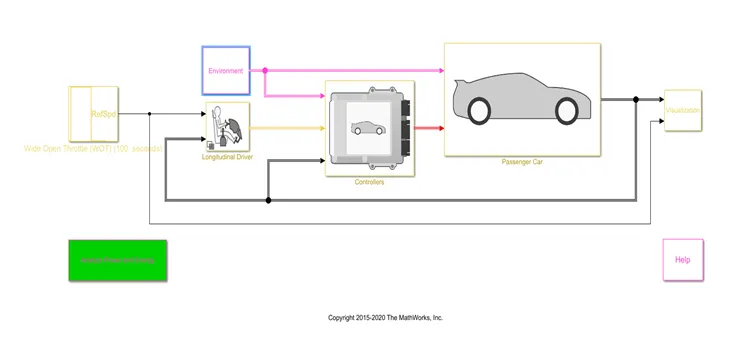
The Model of the Hev Reference Application is given below: -
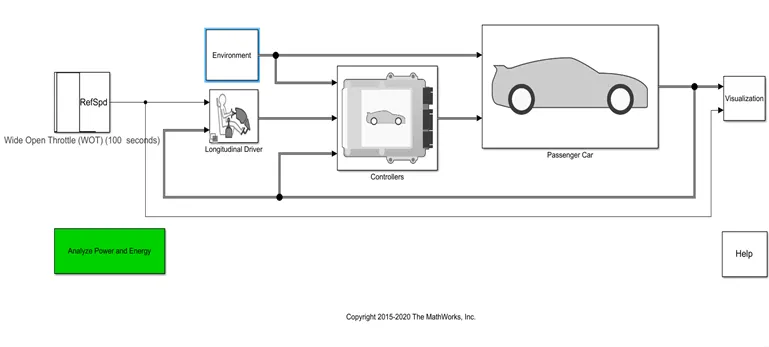
Now we try to understand the above model.
The first block is of the Drive Cycle. We apply the WOT Drive Cycle to the model.
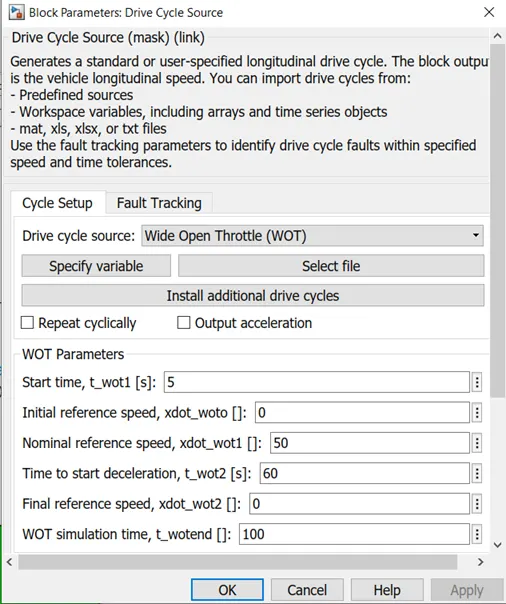
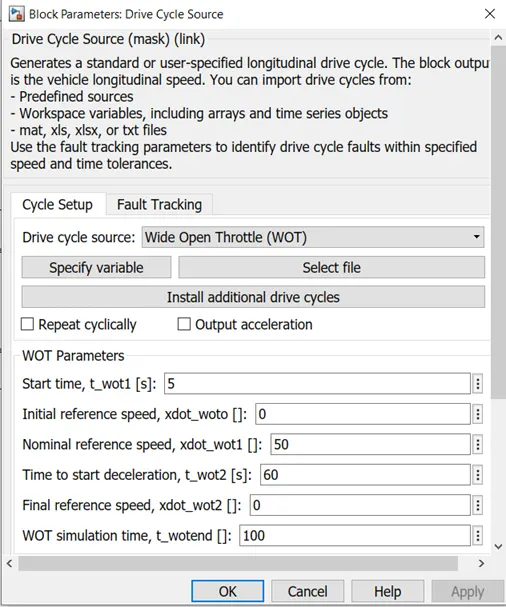
We change the cycle to WOT and we change the the nominal reference speed to 50 and deceleration time to 60.
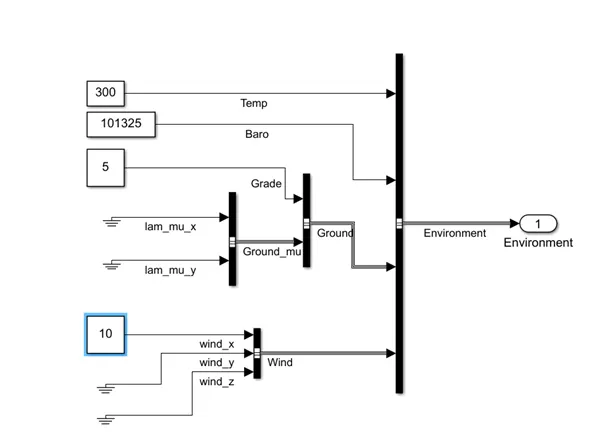
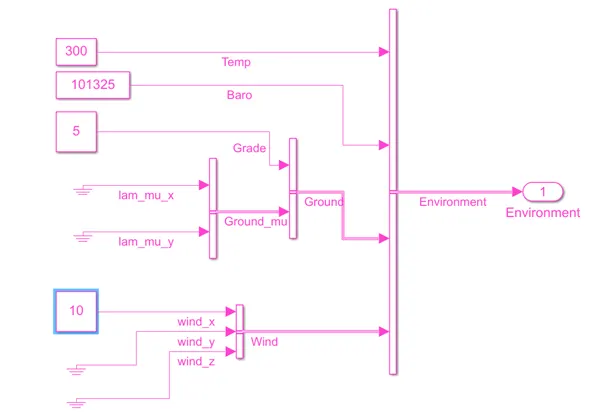
The second block is of environment. In that we can change the temperature, gradeability, wind etc. And we change the grade at 5 and the wind as 10.
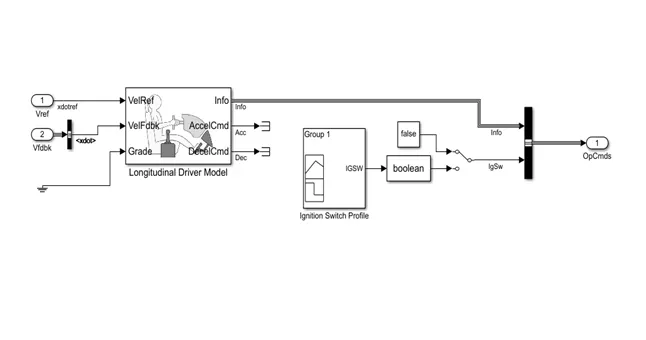
The third block is longitudinal driver model. This block is uses for acceleration and braking as shown as below
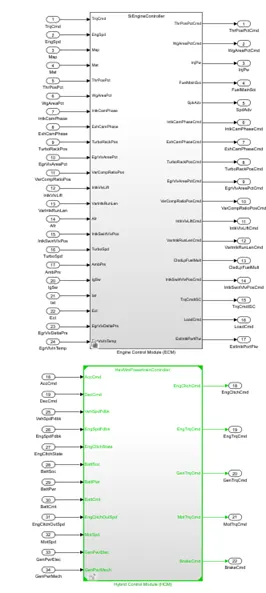
The fourth block is of Controller Subsystem. It implements the powertrain control module it contains hybrid control module and engine control module

The fifth block is of passenger car subsystem . It implements the hybrid passenger car that contains the engine, electric plant and drive train subsystem.
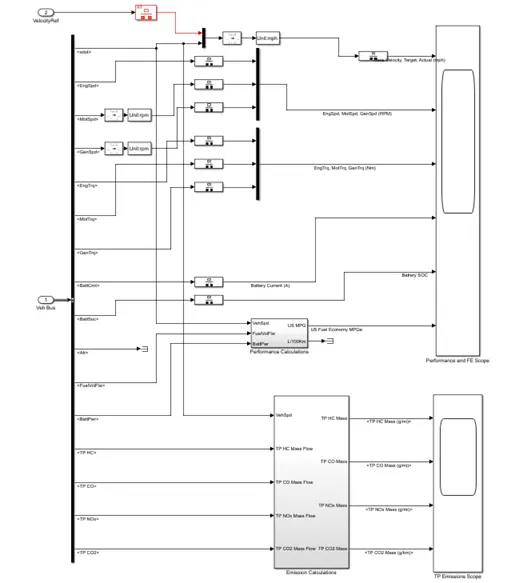
The sixth block is visualization subsystem . It displays the vehicle level performance, battery state of charge, fuel economy and emission results that are useful for power train matching and component selection analysis.
The Result
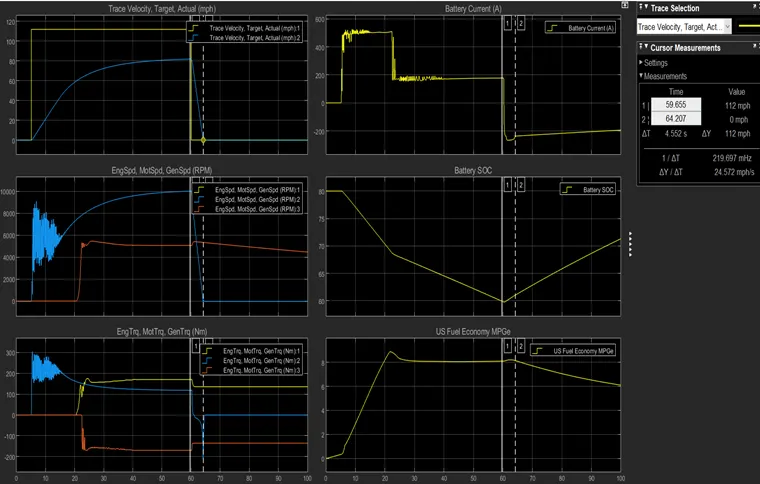
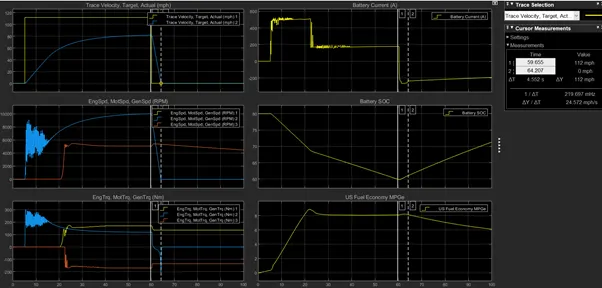
- Trace velocity, Target actual (mph): The yellow plot indicate the required velocity to overcome the grade and wind velocity in WOT case and blue plot indicate the traced velocity which doesn't meet the actual requirement to overcome the given grade and wind velocity and the velocity is obtained around 81.8mph.
- Engine speed, Motor speed, Generator speed (rpm): Initial speed of motor is very high hence the engine rpm remains constant and when battery is charging which means the regenerative case the generator speed is observed
- Engine torque, Motor Torque, Generator Torque(Nm): Initial torque of motor is very high which means the vehicle will start on motor alone mode and the engine torque(yellow plot) and generator torque(orange plot) will be observed as the state of charge(SOC) of battery decreases.
- Battery current(A): Initially the battery current is very high and reaches the maximum limit around 500 A and remains constant and it goes to negative value which indicate the vehicle is deaccelerating and in regenerating mode,
- Battery SOC: As the vehicle is accelerating the SOC will decreases and when it is deaccelerating the battery will charge as the vehicle in Regenerative mode and SOC of battery increases.
- US Fuel economy MPGe: Initially for 22sec the MPGe value is more because the motor offers enormous torque and afterwards the torque becomes nearly constant and MPGe value decreases.
4) Keeping all other parameters same, compare the simulated results of hybrid and pure electric powertrains.
Pure electric powertrain:
We keep all the same data as hev vehicle .
Now compare the result of hev and pure ev vehicle .
Hev Result :-
Ev Vehicle result : -
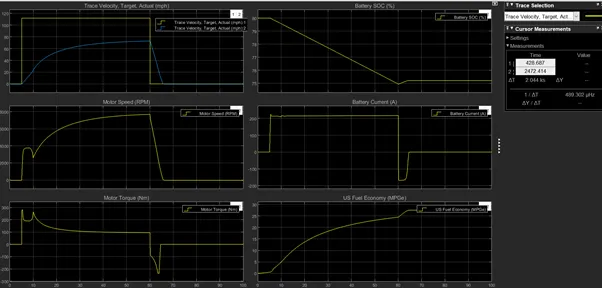
In plot one the result the top speed achieved is 72mph.The acceleration time to reach 72 mph is 60 seconds. The deceleration time from 72 mph to minimum is 5 seconds.
In plot two the speed of the motor changes in RPM throughout the drivecycle. Peak Motor Speed is 7694 rpm.
In plot three the torque characteristics and its changes of motor in (Nm) throughout the drive cycle. Peak Motor Torque is 94 Nm.
In plot four it shows the Battery Current values(A) and its changes for various acceleration inputs as per the driven cycle. The Peak Current Discharge from Battery is 217 A.The Peak Current Charging to the Battery is -197 A
The fifth plot shows the Battery State of Charge SOC(%) and its changes corresponding to the driving inputs. The State of Charge decreased from 80% to 74.5% of charge in 15.20 seconds for the specified driving conditions.
In sixth plot shows the Fuel Economy as Miles per Gation for the corresponding input driving conditions. The highest Miles per Gallon MPGen 24.5.
Conclusion: -
As from above information and we compare both the results we get the conclusion that the hybrid electric vehicle with same environmental and Drive cycle conditions results in less top speed achievement.
The discharging capacity and the rate of charging is higher in the pure electric car. Also the SOC(State of Charge) shows the battery efficiency of the pure electric to be higher than the Hybrid Vehicle.
The efficiency of the Pure Electric Car is higher than the Hybrid Electric Vehicle which is evident from the miles per gallon numbers of both of these cars.
Electric Vehicle produces zero emissions and the Hybrid Electric Vehicle produce waste gas emission.