Week-4 Challenge WOT Condition Part-2
1.
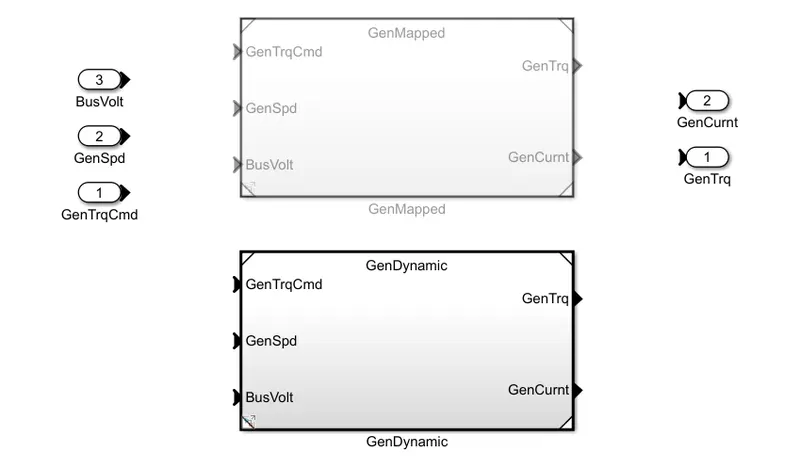
| Mapped | Dynamic |
| In mapped the data points are pre assigned in lookup tables. | The dynamic model uses the combination of outputs from various subsystem to generate the outpu. |
| Without considering the realtime motor or engine parameters, the required torque output is generated. | It runs by real simulation where the required input from the drive cycle is taken |
| The accuracy of this model is not high as this is doesn't run real parameters. | The accuracy of the model is high as it considers the real input from all the subsytem to generate the output. |
| The simulation time is less compared to the dynamic model | The simulation time is more compared to the mapped model. |
To change the model type, click on the variant configuration from the model explorer and then click on the model which needs be selected.
Then right click on the selected model and select make as active. 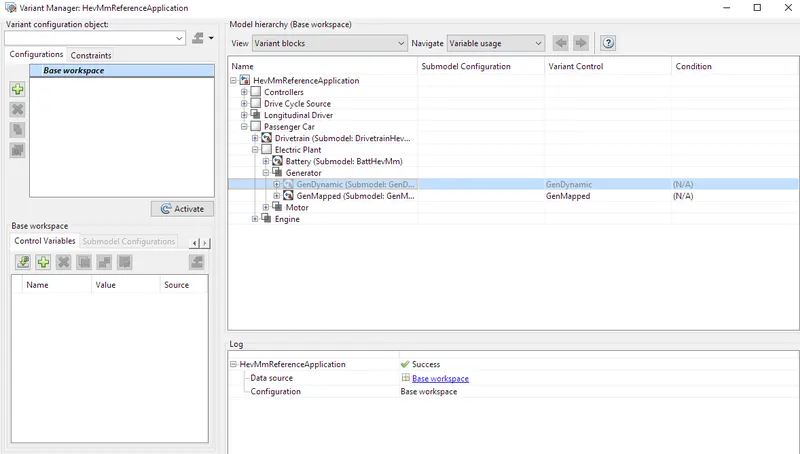
By default, the GenMapped will be selected. Now, using the above techinque changed to GenDynamic.
2.
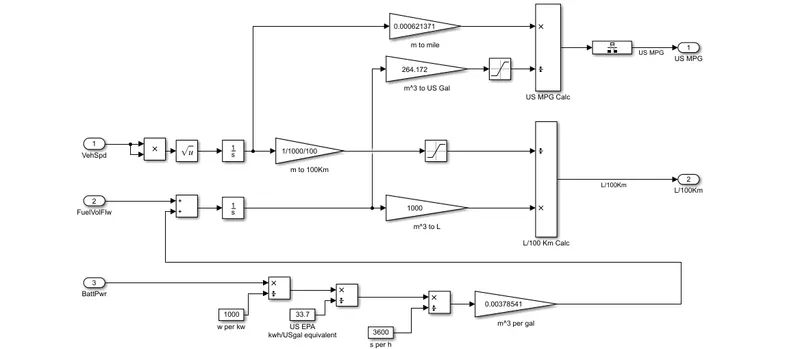
The factors considered for indicating Fuel Efficiency are
1. Vehicle speed
2. Battery power
3. Fuel Flow.
Conversion from Cubic meter to gallon:
We know 2641.172 UD Gallons is 1000L.
The reference model taken here for consideration is HEV and as it operates on both battery and Fuel Injection Engine.
The final output/ fuel efficiency is calculated by keeping in consideration of the battery output.
3.
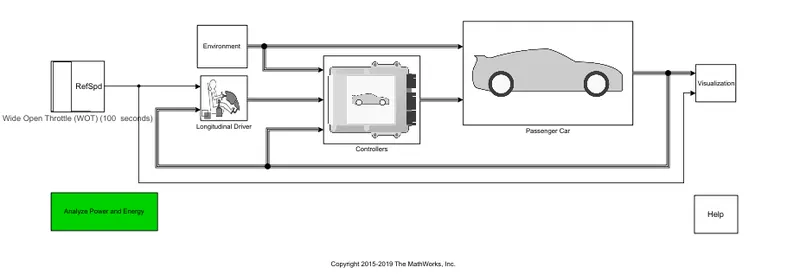
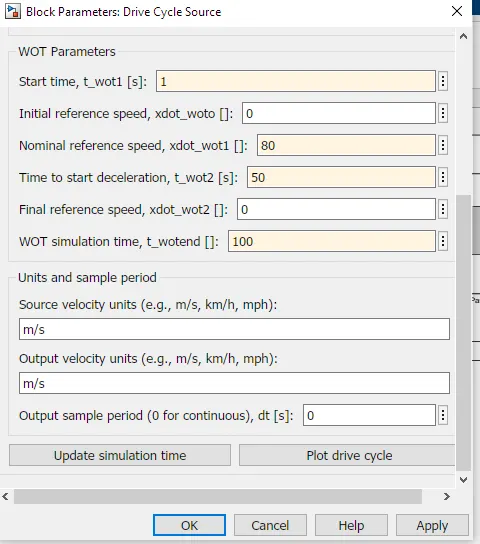
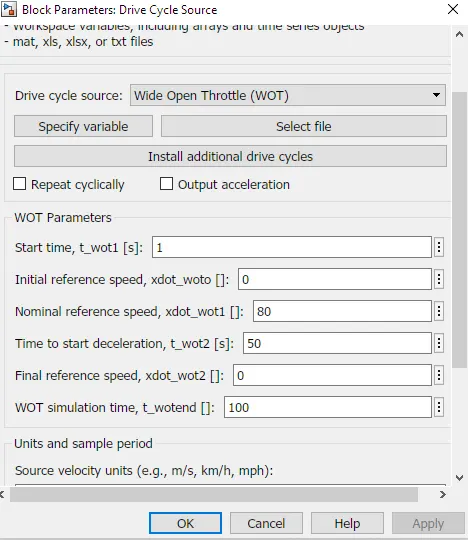
The nominal speed is set at 80km/hr, decelaration time at 50s,and the simulation time at 100s.
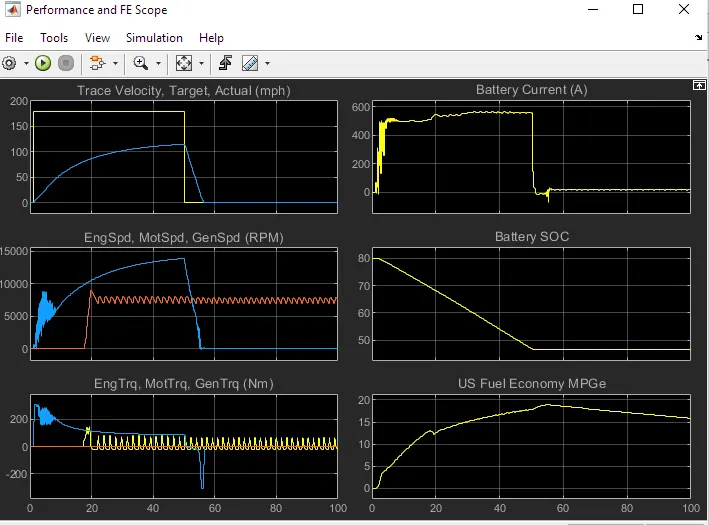
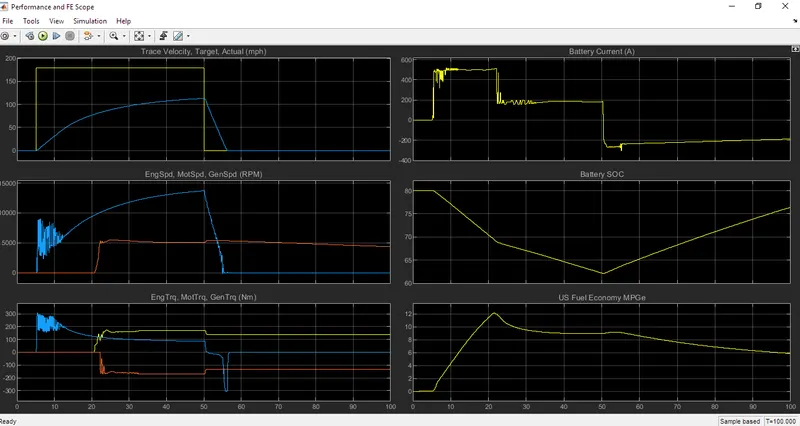
Plot 1 - It is seen that the target velocity is 180mph but the trace velocity is actually 110mph. \
Plot 2 - This plot gives the detailed analysis for the achieved Engine and motor speed in rpm. The contribution of both the power genrating sources for meeting the required velocity.
Plot 3 - This plot gives the detailed analysis of the engine motor torque and generator torque.
Plot 4 - This plot denotes the power produced by the battery and the readings in Ampere.
Plot 5 - This plot denotes the SOC of the battery. This denotes the range of charge used for the achievement of velocity.
Plot 6 - Thid is the fuel efficiency or range of the drive and the same is denoted in Miles per Gallon equivalent.
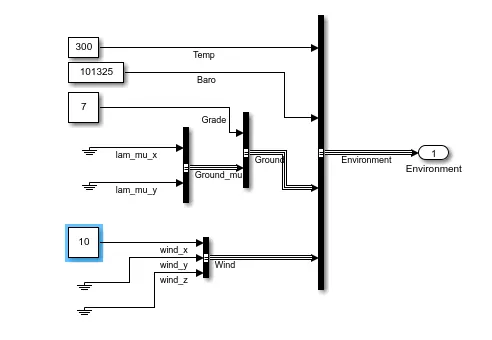
The wind is adjusted to 10 and the Grade is adjusted to 7.
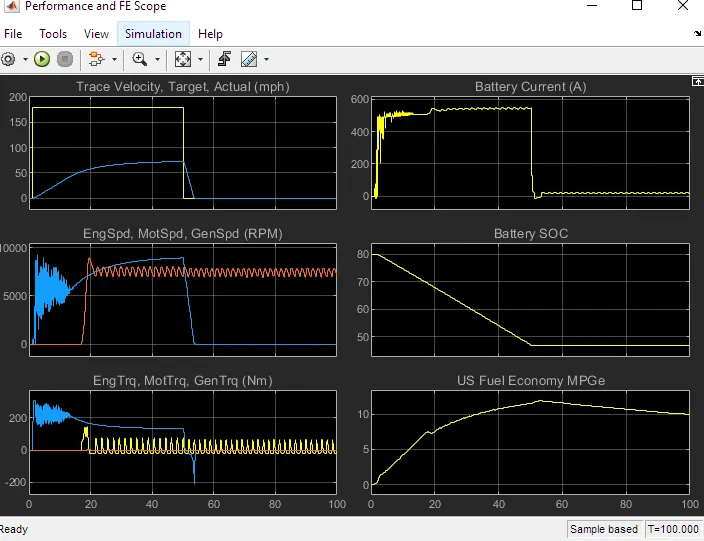
WOT wih change in Grade and Wind velocity:
Plot 1 - It is seen that as the wind and the grade increases, the vehicle is not able to reach the target velocity.
Plot 2 - This plot comparing the normal plot the engine speed has reduced to a steep slope on the negative side as compared to the normal situation.
Plot 3 - This plot gives multiple variations in all these aspects and the same is visible in both the results of Normal and with grade adn wind velocity.
Plot 4 - Battery current has been fluctuating at a higher range as compared to the normal after the vehicle is reaching near to the stable pace the fluctuation starts and is simualted.
Plot 5 - The SOC remains more or less simiar in both the cases and resulted at 45% after the end of WOT.
Plot 6 - The avg. fuel economy is between 6 and 11mph in both the scenarios.
4.
Pure Electric vehicle:
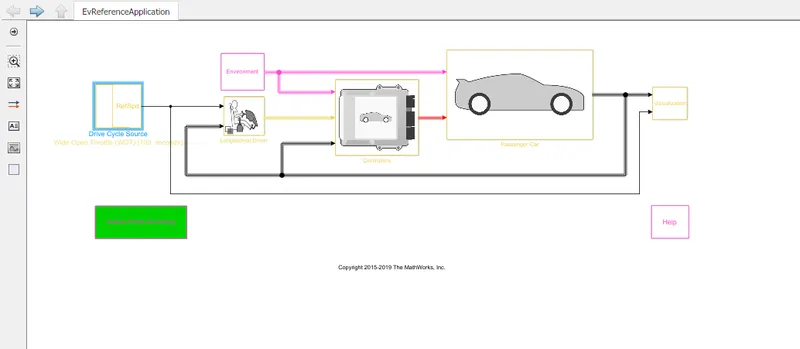
Sll the values are same as per the previous statement.
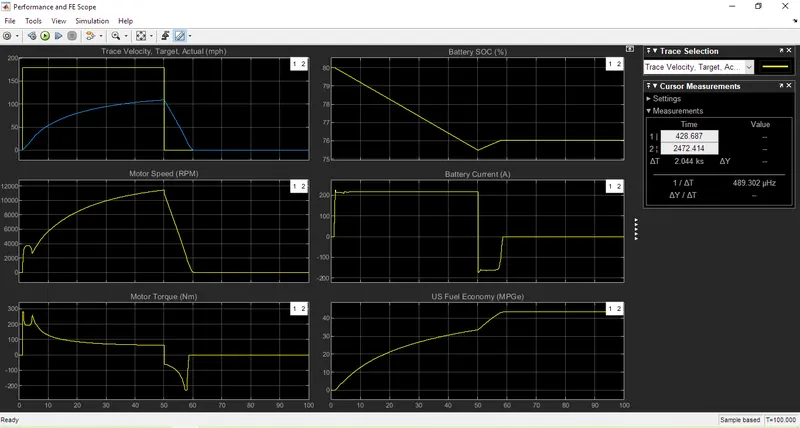
The performance of the EV is plotted below .
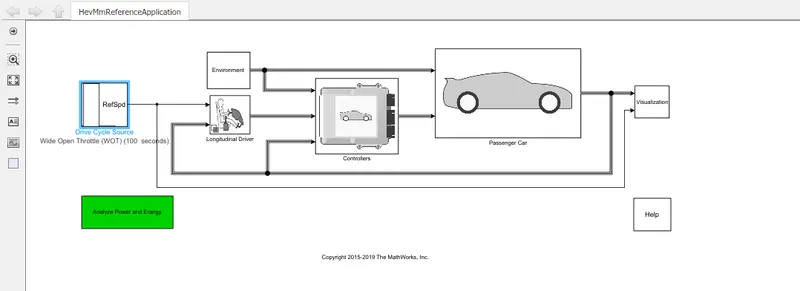
HYBRID VEHICLE:
CONCLUSION:
1. The electric vehicle when compared with the HEV in the the same environment results in less top speed achievement.
2. As the pure electric car here used the Li-Io battery compared to the Nickel metal hydride battery the discharging capacity and the rate of charging is higher in the pure electric car.
3. The efficiency of the electric car is higher than the hybrid car which is evident from the miles per gallon numbers of both these cars.