Week-4 Challenge WOT Condition Part-2
Aim:-
- What is the difference between a mapped and dynamic model of engine, motor, and generator? How can you change the model type?
- How does the model calculate miles per gallon? Which factors are considered to model fuel flow?
- Run the HEV ReferenceApplication with WOT drive cycle. Change the grade and wind velocity in the environment block. Comment on the results.
- Keeping all other parameters the same, compare the simulated results of hybrid and pure electric powertrains.
Findings:-
- What is the difference between a mapped and dynamic model of engine, motor, and generator? How can you change the model type?
Mapped Model of Engine:- Model uses a set of steady-state lookup tables to characterize engine performance. The tables provide overall engine characteristics, including actual torque, fuel flow rate, Brake-specific fuel consumption (BSFC), and engine-out exhaust emissions.
Dynamic model of engine:-Model decomposes the engine behavior into engine characteristics that are separated into lower-level components. By combining components in this way, the models capture the dynamic effects.
Mapped Model of Motor:- The Mapped Motor block implements a mapped motor and drive electronics operating in torque control mode. The output torque tracks the torque reference demand and includes a motor-response and drive-response time constant. Use the block for fast system-level simulations when you do not know detailed motor parameters, for example, for motor power and torque tradeoff studies. The block assumes that the speed fluctuations due to mechanical load do not affect the motor torque tracking.
Dynamic model of Motor:- The dynamic model of motor is 3 phase PMSM (Permanent Magnet Synchronous Motor. It has a 3 phase Voltage source inverter.
Mapped Model of Generator:- This block is also the same block-like Mapped motor block. This model Generates power and provides electromechanical actuation based on a lookup table.
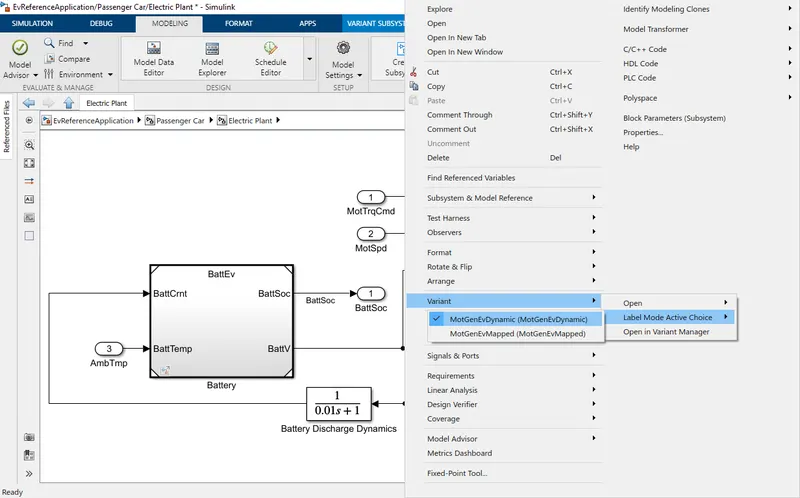
How can you change the model type?
Open the Model, Open Passenger Car, open the electric plant, right-click on the motor, and follow the below picture.
- How does the model calculate miles per gallon? Which factors are considered to model fuel flow?
We need to go in the visualization blockset to see “does the modal calculate miles per gallon”. After going into the visualization blockset we need to go to the performance subsystem.
Visualization blockset:-
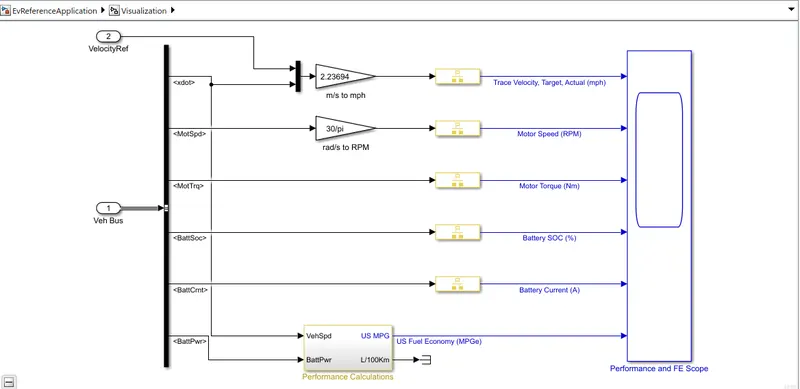 Performance Calculation:-As we can see in the below blockset, there are two inputs given vehicle speed and battery power. Here vehicle speed is converted into distance km and miles(US standard). Battery power is converted into volume m^3/gal. After that m^3/gal is converted into liters and gallons. Taking these two values distance and volume of fuel the miles per gallon is calculated.
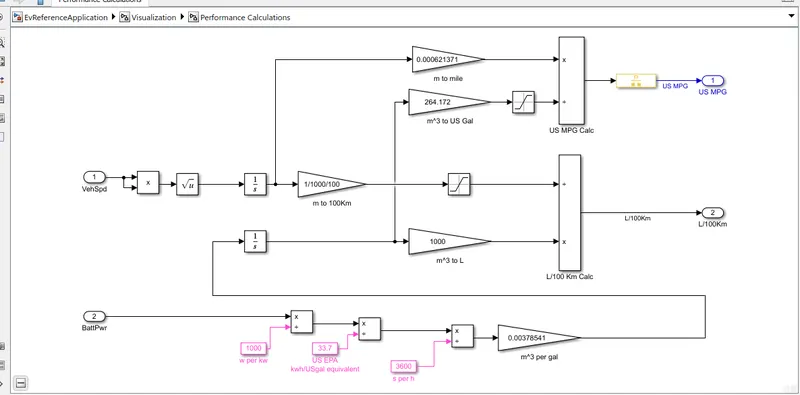 Model of fuel flow:- Here battery power is converted from w to kw, after that kw is converted into kwh/us gal according to the standard of Environmental Protection Agency, after that it is divided from 3600 and multiplied with gain block and after that integrated to convert m^3 and gallons.
- Run the HEV ReferenceApplication with WOT drive cycle. Change the grade and wind velocity in the environment block. Comment on the results.
To open the HEV ReferenceApplication WOT drive cycle use autoblkHevStart in command.I have set the WOT conduction according to the picture below.
Changed the grade and wind velocity:-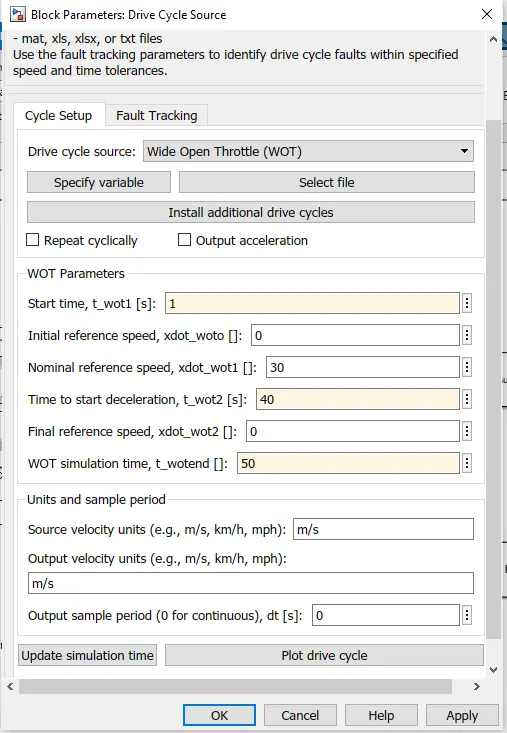
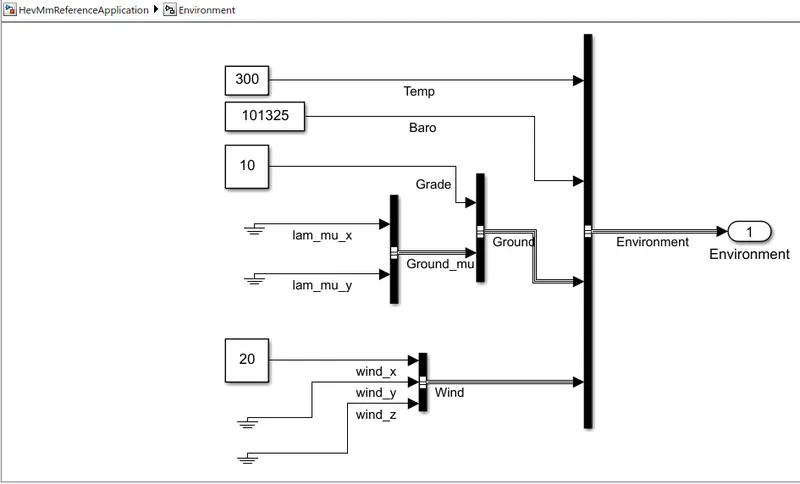 After that, I run the modal for 50 secs as we can see in the picture below.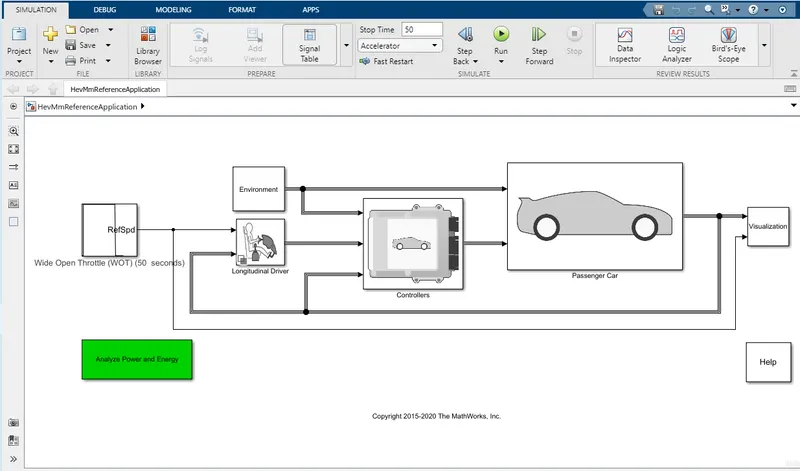
Results:-
Performance and FE scope:-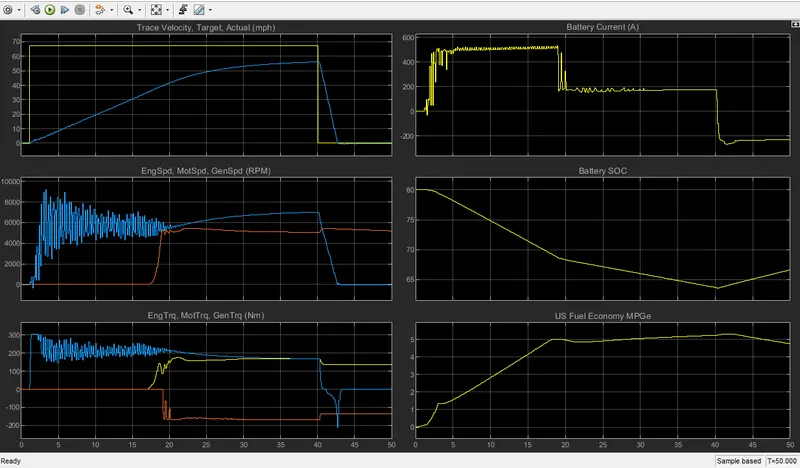 As we can see in the above picture, in plot 1 we applied WOT with full velocity within no time. The trace velocity remained 67.1 m/h till the deacceleration. but as we can see the actual velocity of the vehicle did not reach trace velocity because of gradeability and wind velocity has been increased, the value of current and engine power is also limited. As we can see in the 2nd plot the current is going negative after starting deacceleration. This negative current means the battery is charging and the regenerative brake is applied. We can also see in plot 3 the speed of the motor and generator is the same and it overlaps. TP Emission Scope:-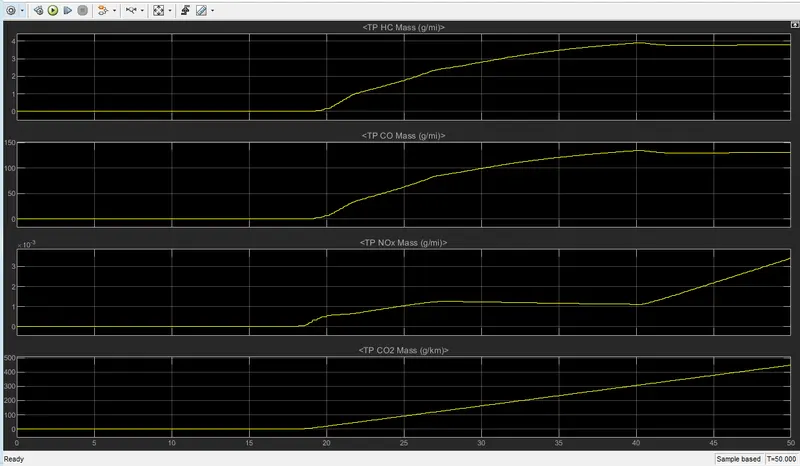
- Keeping all other parameters the same, compare the simulated results of hybrid and pure electric powertrains.
I have kept all the parameters the same as per HEV ReferenceApplication mentioned above in the previous question.
Result(pure electric):-
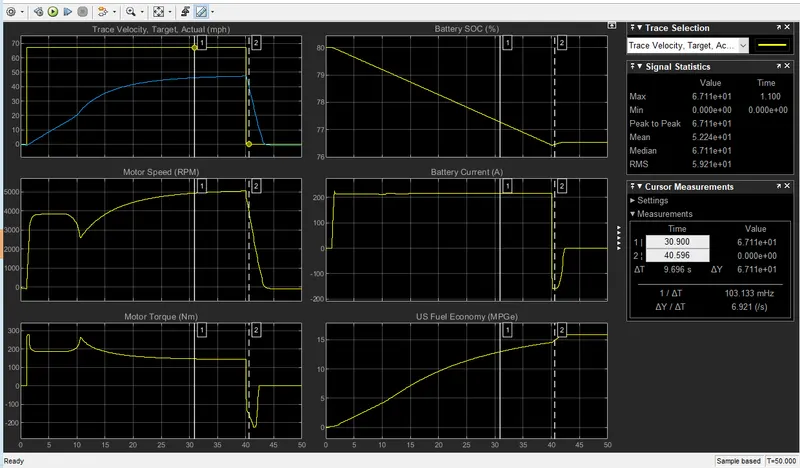 As we can see in the fully electric the actual speed of the vehicle is around 48 mph and in HEV 56 mph.