Project 1 - Parsing NASA thermodynamic data
Aim:-
- Write a function that extracts the 14 coefficients and calculates the enthalpy, entropy, and specific heats for all the species in the data file. You will be reading this file NASA thermodynamic data(Tip: use fopen and fgetl). The formulas are shown below.
Here R is the universal gas constant, T is the temperature
Cp is Specific Heat, H is Enthalpy, S is Entropy
where a1, a2, a3, a4, a5, a6, and a7 are the numerical coefficients supplied in NASA thermodynamic files.The first 7 numbers starting on the second line of each species entry (five of the second line and the first two of the third line) are the seven coefficients (a1 through a7, respectively) for the high-temperature range (above 1000 K, the upper boundary is specified on the first line of the species entry). The following seven numbers are the coefficients (a1 through a7, respectively) for the low-temperature range (below 1000 K, the lower boundary is specified on the first line of the species entry).
- Calculate the molecular weight of each species and display it in the command window.
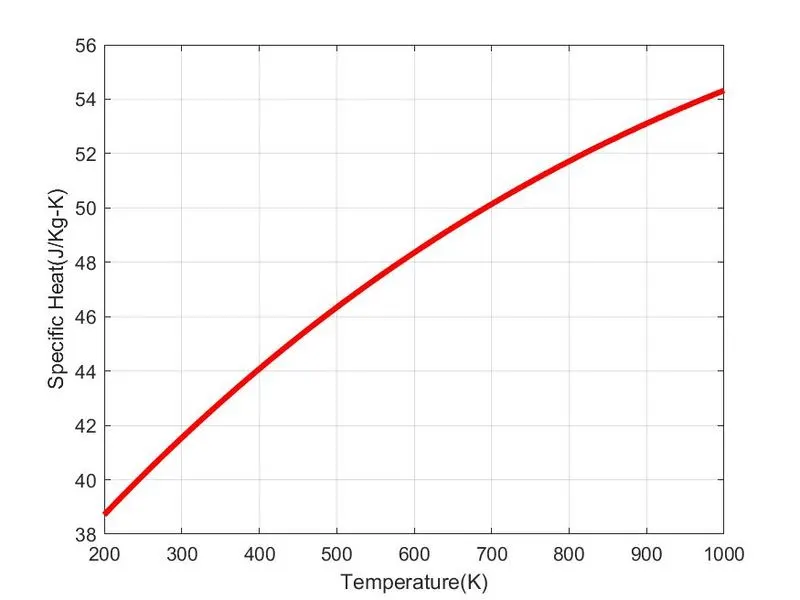
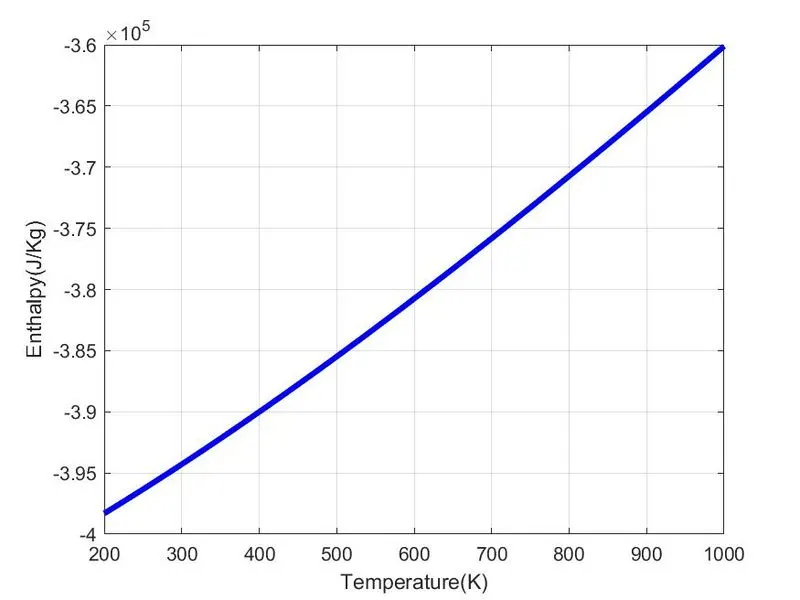
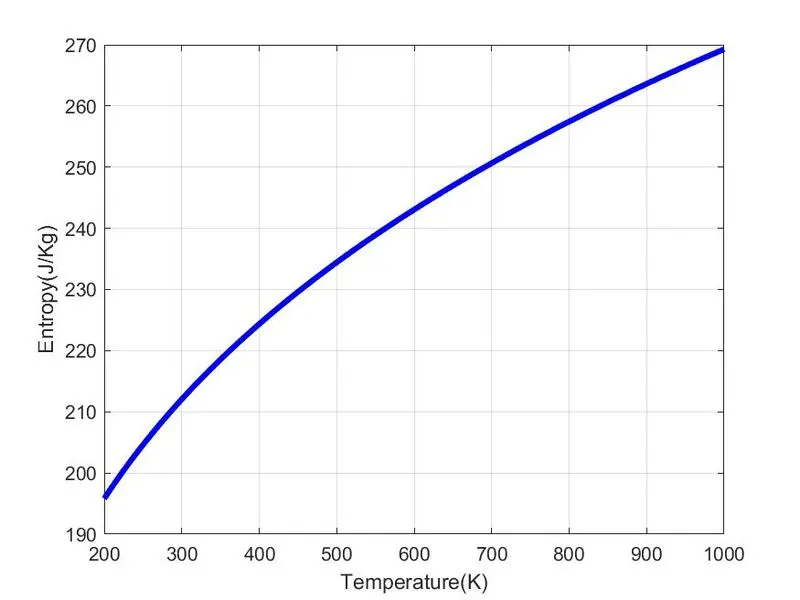
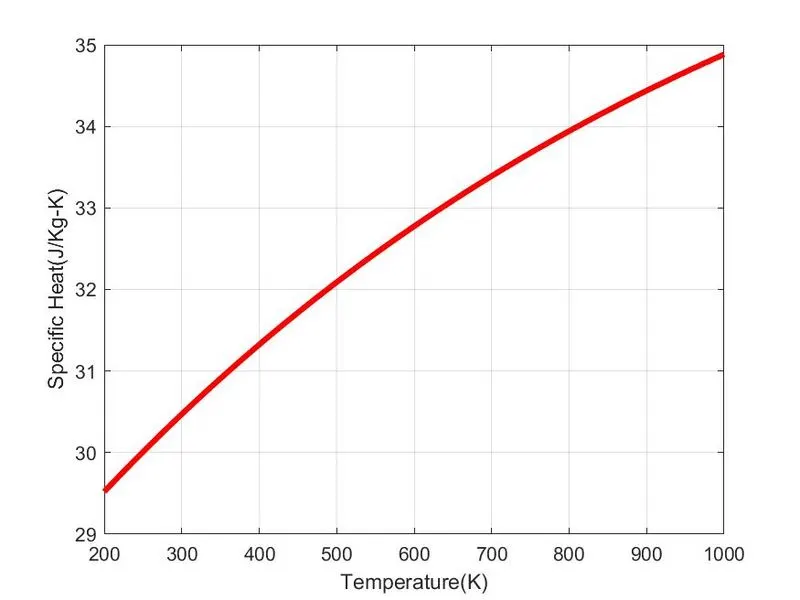
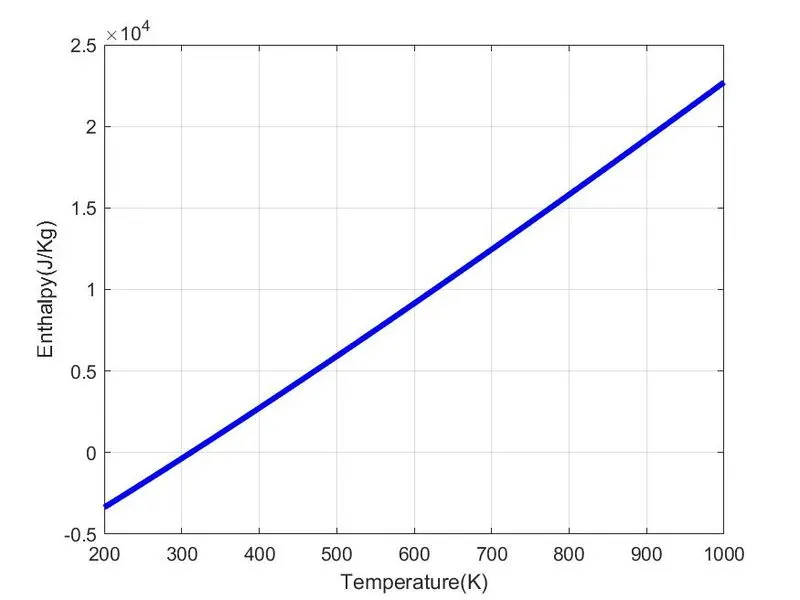
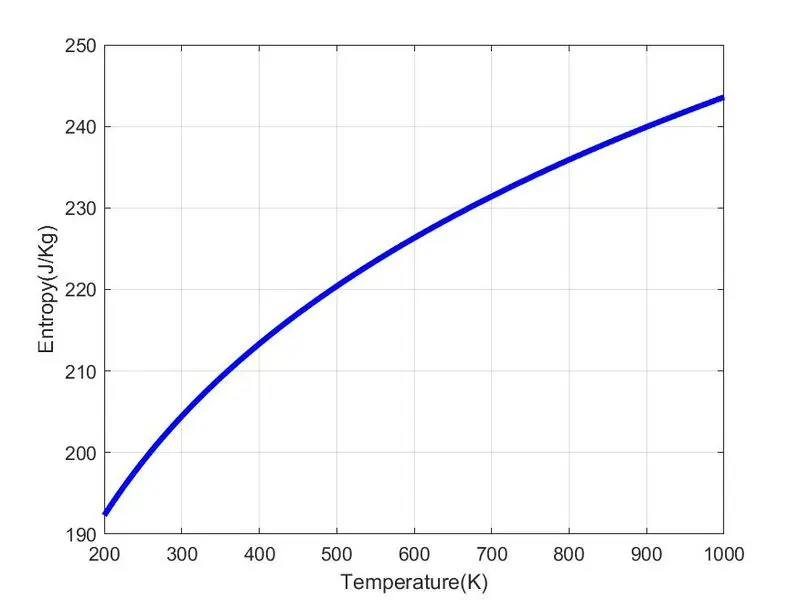
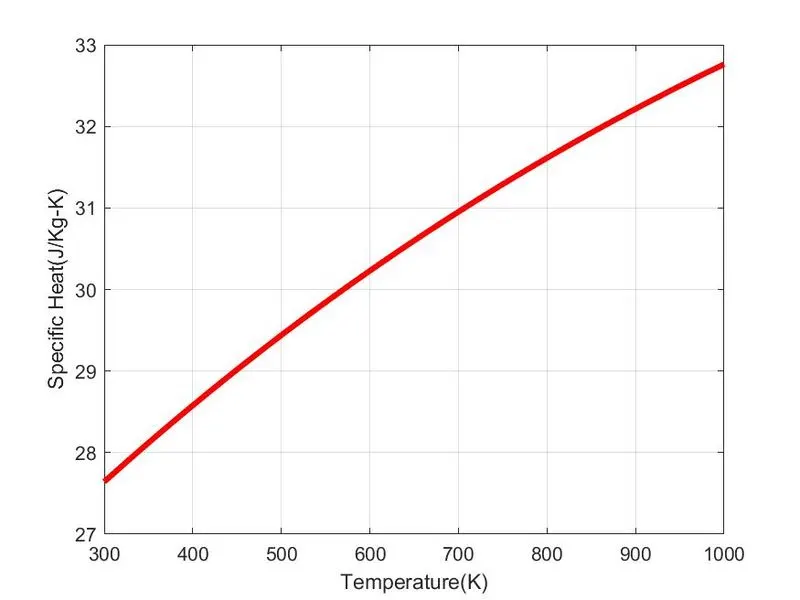
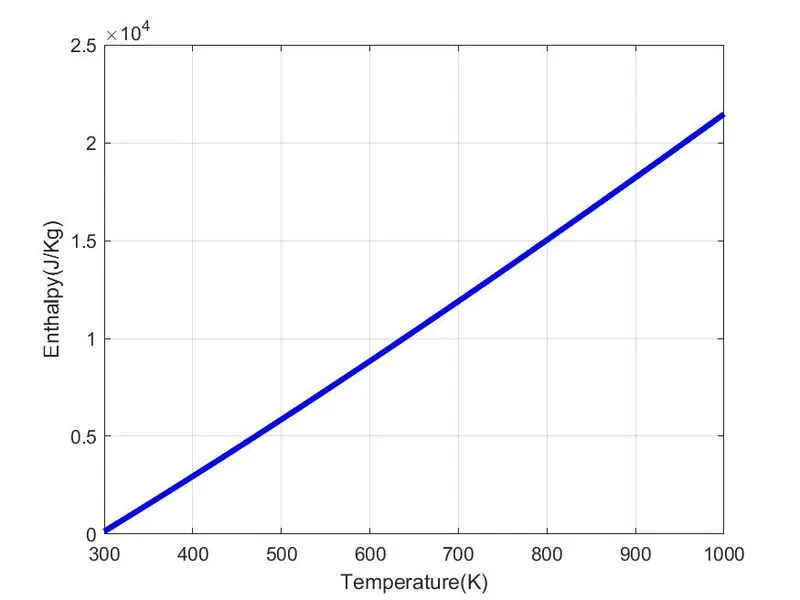
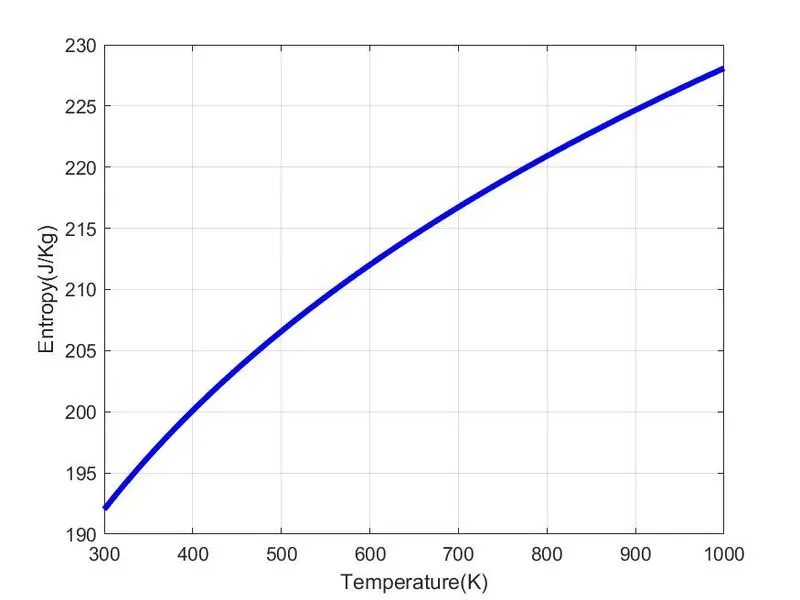
- Plot the Cp, Enthalpy, and Entropy for the local temperature range (low temperature: high temperature) specific for each species.
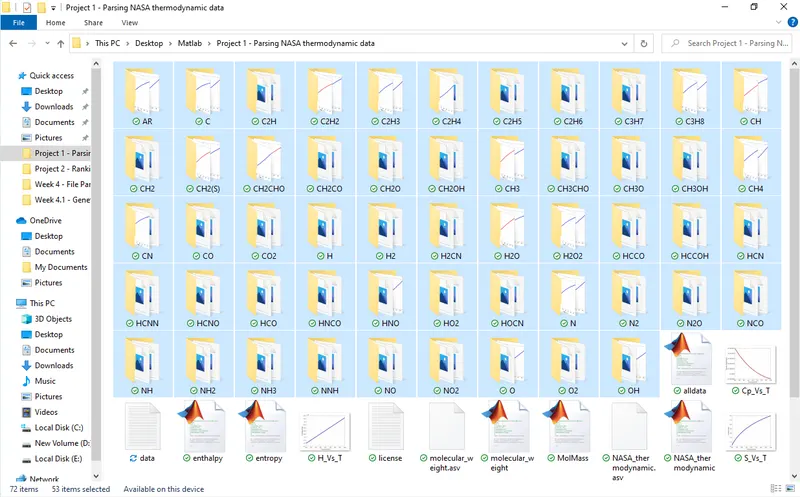
- Save the plots as images with appropriate names and dump them in separate folders for each species with a suitable name. All these should be generated automatically.
- The main program that you will submit will just take the "THERMO.dat" file as an input and generate Cp, H, and S plots.
- Please write a detailed report to describe your logic.
- Screenshot of the window where all the folders are saved.
- Plots for o2, N2, and Co2 species (your program should be case insensitive if it is going to take the species name as an input).
Main Code:-
clear all
close all
clc

R = 8.3145;
% reading the file THERMO.DAT
f1 = fopen('THERMO.DAT', 'r');
% reading 1st line, for Header
header = fgetl(f1);
% reading 2nd line, for global temperature
T_global = fgetl(f1);
T_global = strsplit(T_global,' ');
% If str is a cell array of character vectors or a string array,
% then use {} in str2num solver or directly use str2double(T_global(2)) to
% get arry vector
T_global_low = str2num(T_global{2});
T_global_mid = str2num(T_global{3});
T_global_high = str2num(T_global{3});

% skiping 3 lines that is comment
for i = 1:3
    omit = fgetl(f1);
end

for j = 1:53
% Reading the 1st line of species
w = fgetl(f1);
A = strsplit(w,' ');
% Reading the name of species, 6 is logest charecter of species name
species_name{j} = A{1};
% Finding the string '.'
w1 = findstr(w,'.');
% Reading the local temperature
T_local_low = w(w1(1)-3:w1(1)+3);
T_local_mid = w(w1(2)-4:w1(2)+3);
T_local_high = w(w1(3)-4:w1(3)+3);
% converting string value into number
T_local_low = str2num(T_local_low);
T_local_mid = str2num(T_local_mid);
T_local_high = str2num(T_local_high);
% deviding local temperature in linspace for multipale values
T = linspace(T_local_low, T_local_high, 200);
x1 = fgetl(f1);
x2 = fgetl(f1);
x3 = fgetl(f1);
A_x1 = findstr(x1,'E');
A_x2 = findstr(x2,'E');
A_x3 = findstr(x3,'E');
a1 = x1(1:A_x1(1)+3);
a2 = x1(A_x1(1)+4:A_x1(2)+3);
a3 = x1(A_x1(2)+4:A_x1(3)+3);
a4 = x1(A_x1(3)+4:A_x1(4)+3);
a5 = x1(A_x1(4)+4:A_x1(5)+3);
a6 = x2(1:A_x2(1)+3);
a7 = x2(A_x2(1)+4:A_x2(2)+3);
a1 = str2num(a1);
a2 = str2num(a2);
a3 = str2num(a3);
a4 = str2num(a4);
a5 = str2num(a5);
a6 = str2num(a6);
a7 = str2num(a7);
b1 = x2(A_x2(2)+4:A_x2(3)+3);
b2 = x2(A_x2(3)+4:A_x2(4)+3);
b3 = x2(A_x2(4)+4:A_x2(5)+3);
b4 = x3(1:A_x3(1)+3);
b5 = x3(A_x3(1)+4:A_x3(2)+3);
b6 = x3(A_x3(2)+4:A_x3(3)+3);
b7 = x3(A_x3(3)+4:A_x3(4)+3);
b1 = str2num(b1);
b2 = str2num(b2);
b3 = str2num(b3);
b4 = str2num(b4);
b5 = str2num(b5);
b6 = str2num(b6);
b7 = str2num(b7);

[Cp,s,h] = alldata(a1,a2,a3,a4,a5,a6,a7,b1,b2,b3,b4,b5,b6,b7,R,T,T_local_mid);
Mol_mass(j) = molecular_weight(species_name{j})

% Plotting
p1 = figure(1);
plot(T,Cp,'linewidth',3,'color','r')
xlabel('Temperature(K)')
ylabel('Specific Heat(J/Kg-K)')
grid on

p2 = figure(2);
plot(T,h,'linewidth',3,'color','b')
xlabel('Temperature(K)')
ylabel('Enthalpy(J/Kg)')
grid on

p3 = figure(3);
plot(T,s,'linewidth',3,'color','b')
xlabel('Temperature(K)')
ylabel('Entropy(J/Kg)')
grid on
% creating new folder for every species
mkdir(['C:\Users\hritu\OneDrive\Desktop\Matlab\Project 1 - Parsing NASA thermodynamic data\', species_name{j}])
% Going in the folder that is created by mkdir
cd(['C:\Users\hritu\OneDrive\Desktop\Matlab\Project 1 - Parsing NASA thermodynamic data\', species_name{j}])
% saving all  files (figure)
saveas(p1, 'Cp_Vs_T.jpg')
saveas(p2, 'H_Vs_T.jpg')
saveas(p3, 'S_Vs_T.jpg')
% coming back in main folder
cd(['C:\Users\hritu\OneDrive\Desktop\Matlab\Project 1 - Parsing NASA thermodynamic data\'])
end

f2 = fopen('data.txt','w');
fprintf(f2,'%15s %25s','Species Name','Molecular Weight');
fprintf(f2,'\n');
for l =1:53
fprintf(f2, '%10s %20s', species_name{l}, Mol_mass(l));
fprintf(f2,'\n');
end
fclose(f2);
Function:-
% Function for Molecular Weight (MW)
function [MW] = molecular_weight(species_name)
element = ['H','C','N','O','A'];
atomic_weight = [1.00784, 12.0107, 14.0067, 15.999, 39.948];
MW = 0;
for i = 1:length(species_name)
    for j = 1:length(element)
       if strcmp(species_name(i),element(j))
            [MW] = MW + atomic_weight(j);
            position = j;
       end
    end

    n = str2double(species_name(i));
    if n>1
        [MW] = MW + atomic_weight(position)*(n-1);
    end
end
end
% Function for Specific Heat(Cp), Entropy(s), Enthalpy(h)
function [Cp,s,h] = alldata(a1,a2,a3,a4,a5,a6,a7,b1,b2,b3,b4,b5,b6,b7,R,T,T_local_mid)
for k = 1:length(T)
if T(k) <= T_local_mid
Cp(k) = R*((a1+(a2*T(k)+(a3*T(k)^2)+(a4*T(k)^3)+(a5*T(k)^4))));
s(k) = R*((a1*log(T(k))+(a2*T(k))+(a3*T(k)^2/2)+(a4*T(k)^3/3)+(a5*T(k)^4/4)+a7));
h(k) = R*T(k)*((a1+(a2*T(k)/2)+(a3*T(k)^2/3)+(a4*T(k)^3/4)+(a5*T(k)^4/5)+(a6/T(k))));
else
Cp(k) = R*((b1+(b2*T(k))+(b3*T(k)^2)+(b4*T(k)^3)+(b5*T(k)^4)));
s(k) = R*((b1*log(T(k))+(b2*T(k))+(b3*T(k)^2/2)+(b4*T(k)^3/3)+(b5*T(k)^4/4)+b7));
h(k) = R*T(k)*((b1+(b2*T(k)/2)+(b3*T(k)^2/3)+(b4*T(k)^3/4)+(b5*T(k)^4/5)+(b6/T(k))));
end
end
endMolecular Weight:-
https://drive.google.com/file/d/1EQOAAtE4winWYl8b0somC1wM6RFwUv1q/view?usp=sharing
Screenshot of the window where all the folders are saved.
Plots for o2:-
Plots for N2:-
Plots for CO2:-