Week-4 Challenge WOT Condition Part-2
Objective -
- What is the difference between mapped and dynamic model of engine, motor and generator? How can you change model type?
- How does the model calculate miles per gallon? Which factors are considered to model fuel flow?
- Run the HEV ReferenceApplication with WOT drive cycle. Change the grade and wind velocity in the environment block. Comment on the results.
- Keeping all other parameters same, compare the simulated results of hybrid and pure electric powertrains.
Objective 1- Difference between mapped and dynamic model
1.Major difference between the mapped and dynamic model is as follows;
-Mapped models are already calculated and plotted in form of graphs while dynamic models are not plotted.
-Each time the simulation initiates with mapped model the simulation runs and completes very fast because each does not calculate each value real time while running while,
-When Simulation runs with the dynamic model it takes more time to complete the simulation because the dynamic model calculates the all values in real time.
2. How we can change the models in the system...
When there more than two models inside subsystem the following icon appear at the end of the subsystem's left corner, right click on this icon will allow us to change the model type .
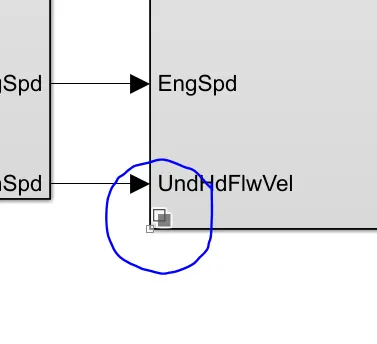
ICON that will halp in changing the models
Objective 2 - How economy is calculated
1. How model calculates the miles per gallon that's the economy of the vehicle.
-In visualization this block calculates the miles per gallon. to calculate the miles per gallon it requires the vehicle speed, Fuel volume flow, as well as battery power.
-With the above factors with some logical combination it converts the fuel, speed and battery power it calculates the economy of the vehicle.
-First the model covert the vehicle speed to distance , then integrate the fuel flow and battery and then this value divides the distance.
-But to convert them to miles and km and liter and gallon the respective converters are used.
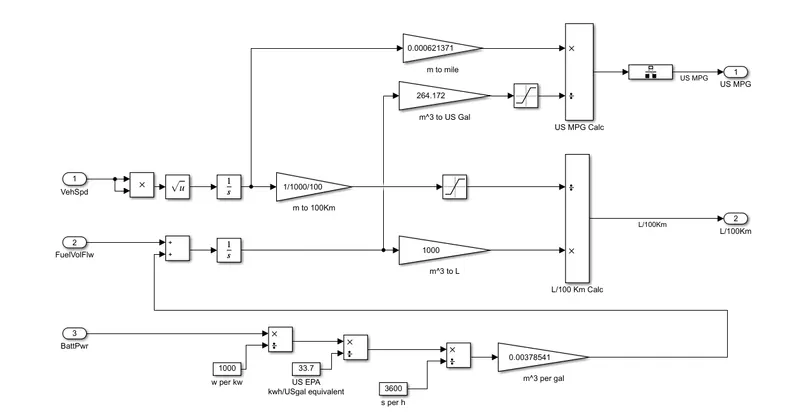
Block Calculating Economy of the Vehicle
Objective 3 -Changing the environmental values and Running simulation
1. Following block is the environment block where we can set the environment where we can decide the or input the environmental values such as temperature, pressure, grade etc.
2. This values will act as the factor to calculate tractive effort and other calculations.
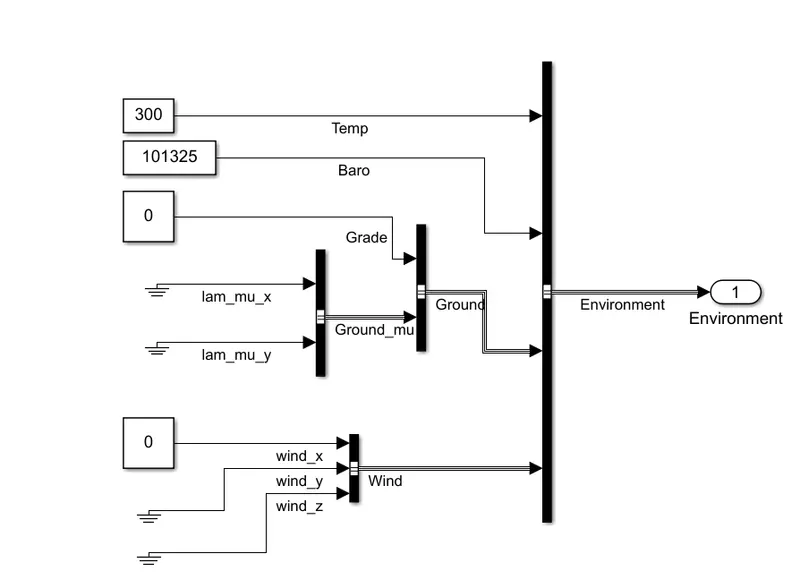
Environment Controlling Block
This is the results for the HEV when all the parameters kept as default.
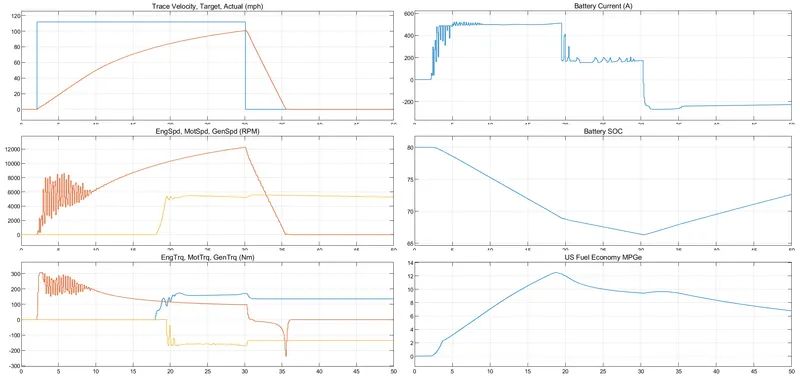
Results For Default Values of The environment block
After that we are changing the values of grade and wind speed to 10 .
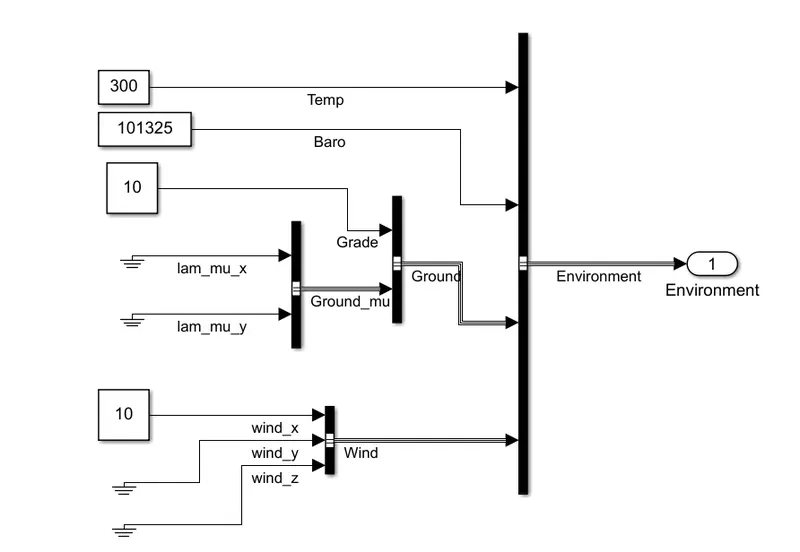
Environmental Values of Wind Speed and Grade changed to 10
The result for the changing the above conditions we can see the vehicle speed is much lower than that of the original speed due to default values, while all other values remain same because all the energy generation remains constant.
But due to external conditions are varied all the power generated is being spent to overcome the acceleration, Hill climb and drag force.
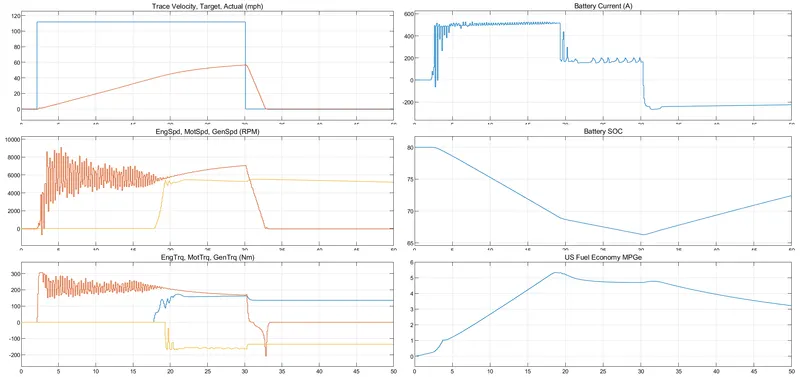
Results for Wind Speed and Grade changed to 10
Objective - 4- COMPARISON OF EV AND HEV APPLICATION
Below is the comparison between the results of the EV and HEV reference application.
Both Application simulation has run between 200 seconds.
1. First graph is the results of EV reference application and second graph is the result of HEV reference application
2. There is much more fluctuation the battery current and engine speed graphs for HEV applications, where there is less fluctuation in in EV application.
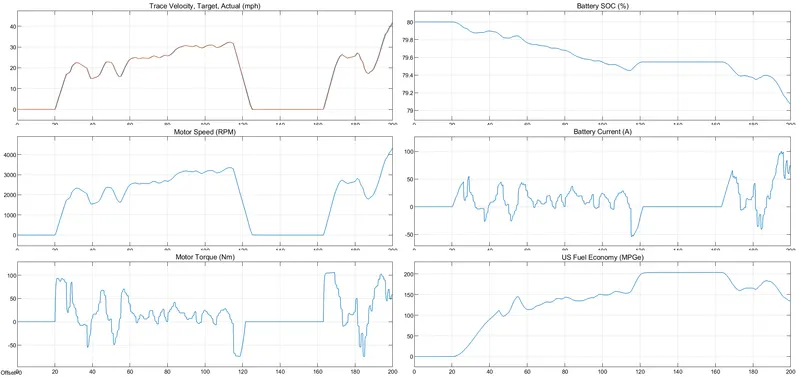
RESULTS FOR EV REFERENCE APPLICATION SIMULATION FOR 200S FOR FTP CYCLE
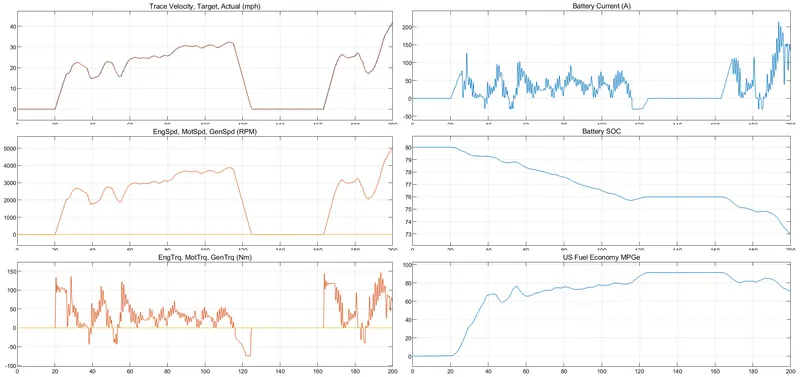
RESULTS FOR HEV REFERENCE APPLICATION SIMULATION FOR 200S FOR FTP CYCLE
Results and Conclusion-
1. All the objectives are completed successfully.
2. EV and HEV application simulations performed successfully.
3. All the graphs and results are observed.